南美和中美坚固型平板电脑市场预测至 2030 年 - 区域分析 - 按类型(全坚固型平板电脑、半坚固型平板电脑和超坚固型平板电脑)、操作系统(Android、Windows 和 iOS)和应用(航空航天和国防、汽车、建筑、能源和公用事业、制造业、石油和天然气等)

BMIRE00030161 | Pages: 76 | Electronics and Semiconductor | May 2024 | Type: Regional | Status: Published
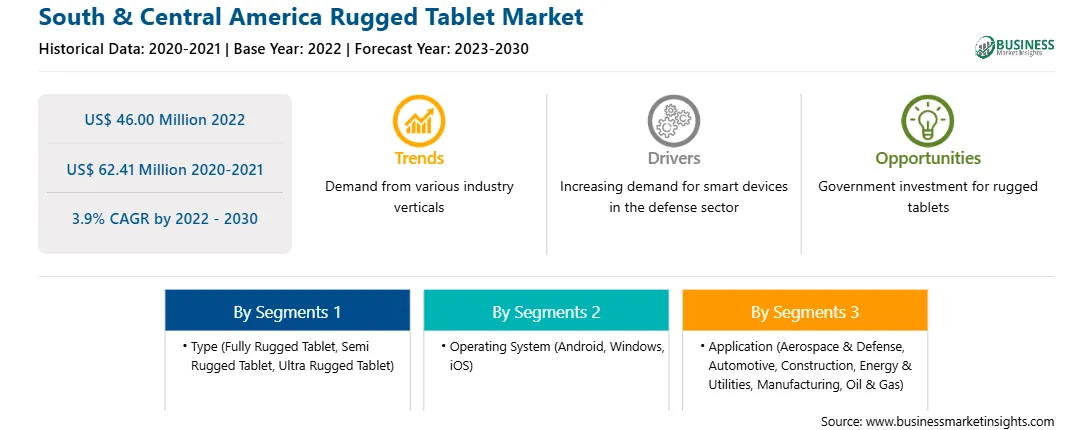
2022 年,南美和中美坚固型平板电脑市场价值为 4600 万美元,预计到 2030 年将达到 6241 万美元;预计 2022 年至 2030 年的复合年增长率为 3.9%。

人工智能和物联网等新技术的兴起推动了南美和中美坚固型平板电脑市场的发展

支持人工智能的设备无处不在。根据 Simpli Learn 的数据,人工智能技术以某种形式应用于当今超过 77% 的电子产品中。此外,坚固型平板电脑可以收集和发送来自现场众多传感器和设备的物联网数据。这些平板电脑可能配备特定的数据收集和分析软件,使远程监控和管理物联网设备变得更加简单。例如,坚固型平板电脑可用于跟踪车队的行踪、操作工业机械以及检查仓库中的温度和湿度水平。

坚固型平板电脑还可以与人工智能设备集成以确保安全。各部门正在使用协作的坚固型平板电脑来保障学校安全、政府大楼和其他公共场所的安全。例如,2023 年 10 月,京瓷与三家技术开发商合作开发了一项创新解决方案,以提高学校、政府大楼和其他公共场所的安全性。京瓷的超坚固移动技术(Android 智能手机和平板电脑);Omni-Response 360° 传感技术,通过全面的仪表板实现最佳态势感知;ZeroEyes AI 枪支检测和智能态势感知软件;以及连接站点、车辆、物联网技术和安全人员的 Cradlepoint 网络构成了学校安全解决方案。因此,人工智能和物联网等新技术的兴起预计将为市场增长提供丰厚的机会。

南美和中美坚固型平板电脑市场概览

SAM 其他地区的坚固型平板电脑市场细分为智利、秘鲁等。市场受到运输和能源行业不断增长的需求的推动。秘鲁的交通基础设施部门在 2022 年取得了进展,2022 年 1 月至 11 月在机场、铁路、港口和公路项目上的投资为 4.67 亿美元。此外,机场在 2022 年 1 月至 11 月期间获得了 3370 万美元的投资,有些月份的投资低于 100 万美元。

根据全球可再生能源公司 Mainstream Renewable Power 的一份报告,智利有潜力生产 44GW 的风力发电。智利对能源进口的严重依赖刺激了对可再生能源的需求。此外,由于该国夏季出现长期干旱,能源价格大幅上涨,推动了对国内生产的可再生能源的需求。在运输和能源行业中,坚固型平板电脑比传统平板电脑更常用于保存和传输数据,从而推动了南美洲和中美洲其他地区坚固型平板电脑市场的增长。

南美和中美坚固型平板电脑市场收入及预测至 2030 年(百万美元)

南美和中美坚固型平板电脑市场细分

南美和中美坚固型平板电脑市场根据类型、操作系统、应用程序和国家/地区进行细分。根据类型,南美和中美坚固型平板电脑市场细分为全坚固型平板电脑、半坚固型平板电脑和超坚固型平板电脑。全坚固型平板电脑细分市场在 2022 年占据最大市场份额。

就操作系统而言,南美和中美坚固型平板电脑市场分为 Android、Windows 和 iOS。Android 细分市场在 2022 年占据最大市场份额。

按应用细分,南美和中美坚固型平板电脑市场细分为航空航天和国防、汽车、建筑、能源和公用事业、制造业、石油和天然气等。 2022 年,航空航天和国防领域占据了最大的市场份额。

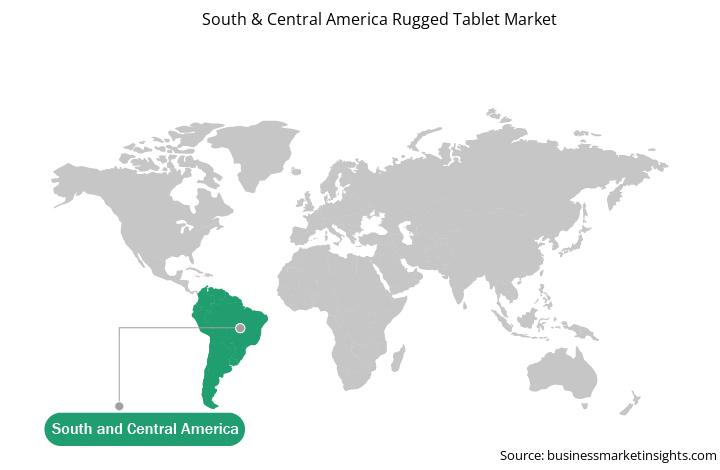
根据国家/地区,南美和中美坚固型平板电脑市场分为巴西、阿根廷、哥伦比亚和南美和中美其他地区。2022 年,南美和中美其他地区占据了南美和中美坚固型平板电脑市场份额的主导地位。

AAEON Technology Inc、戴尔科技公司、松下控股公司、Zebra Technologies Corp 和 Kontron AG 是南美和中美坚固型平板电脑市场的一些领先企业。

Table of Content


1. Introduction

1.1 The Insight Partners Research Report Guidance

1.2 Market Segmentation

2. Executive Summary

2.1 Key Insights

2.2 Market Attractiveness

3. Research Methodology

3.1 Coverage

3.2 Secondary Research

3.3 Primary Research

4. South & Central America Rugged Tablet Market Landscape

4.1 Overview

4.1.1 List of Vendors in Value Chain

5. South & Central America Rugged Tablet Market - Key Industry Dynamics

5.1 Drivers

5.1.1 Increasing Demand for Smart Devices in Defense Sector

5.1.2 Rising Demand from Industrial Sector

5.1.3 Adoption of Android Operating System in Rugged Tablets

5.2 Restraints

5.2.1 High Initial Procurement Cost

5.2.2 Technological Limitations

5.3 Opportunity

5.3.1 Rise of New Technologies, Such as AI and IoT

5.3.2 Government Investment in Rugged Tablets

5.4 Future Trend

5.4.1 Increasing Adoption in Several Industries

5.5 Impact of Drivers and Restraints:

6. Rugged Tablet Market - South & Central America Market Analysis

6.1 Overview

6.2 South & Central America Rugged Tablet Market Revenue (US$ Million), 2022 - 2030

7. South & Central America Rugged Tablet Market Analysis - Type

7.1 Fully Rugged Tablet

7.1.1 Overview

7.1.2 Fully Rugged Tablet: Market Revenue and Forecasts to 2030 (US$ Million)

7.2 Semi Rugged Tablet

7.2.1 Overview

7.2.2 Semi Rugged Tablet: Market Revenue and Forecasts to 2030 (US$ Million)

7.3 Ultra Rugged Tablet

7.3.1 Overview

7.3.2 Ultra Rugged Tablet: Market Revenue and Forecasts to 2030 (US$ Million)

8. South & Central America Rugged Tablet Market Analysis - Operating System

8.1 Android

8.1.1 Overview

8.1.2 Android: Market Revenue and Forecasts to 2030 (US$ Million)

8.2 Windows

8.2.1 Overview

8.2.2 Windows: Market Revenue and Forecasts to 2030 (US$ Million)

8.3 iOS

8.3.1 Overview

8.3.2 iOS: Market Revenue and Forecasts to 2030 (US$ Million)

9. South & Central America Rugged Tablet Market Analysis - Application

9.1 Aerospace & Defense

9.1.1 Overview

9.1.2 Aerospace & Defense: Market Revenue and Forecasts to 2030 (US$ Million)

9.2 Automotive

9.2.1 Overview

9.2.2 Automotive: Market Revenue and Forecasts to 2030 (US$ Million)

9.3 Construction

9.3.1 Overview

9.3.2 Construction: Market Revenue and Forecasts to 2030 (US$ Million)

9.4 Energy & Utilities

9.4.1 Overview

9.4.2 Energy & Utilities: Market Revenue and Forecasts to 2030 (US$ Million)

9.5 Manufacturing

9.5.1 Overview

9.5.2 Manufacturing: Market Revenue and Forecasts to 2030 (US$ Million)

9.6 Oil & Gas

9.6.1 Overview

9.6.2 Oil & Gas: Market Revenue and Forecasts to 2030 (US$ Million)

9.7 Others

9.7.1 Overview

9.7.2 Others: Market Revenue and Forecasts to 2030 (US$ Million)

10. South & Central America Rugged Tablet Market - Country Analysis

10.1 South & Central America

10.1.1 South & Central America Rugged Tablet Market Revenue and Forecasts and Analysis - By Countries

10.1.1.1 Brazil Rugged Tablet Market Revenue and Forecasts to 2030 (US$ Million)

10.1.1.1.1 Brazil Rugged Tablet Market Breakdown by Type

10.1.1.1.2 Brazil Rugged Tablet Market Breakdown by Operating System

10.1.1.1.3 Brazil Rugged Tablet Market Breakdown by Application

10.1.1.2 Argentina Rugged Tablet Market Revenue and Forecasts to 2030 (US$ Million)

10.1.1.2.1 Argentina Rugged Tablet Market Breakdown by Type

10.1.1.2.2 Argentina Rugged Tablet Market Breakdown by Operating System

10.1.1.2.3 Argentina Rugged Tablet Market Breakdown by Application

10.1.1.3 Columbia Rugged Tablet Market Revenue and Forecasts to 2030 (US$ Million)

10.1.1.3.1 Columbia Rugged Tablet Market Breakdown by Type

10.1.1.3.2 Columbia Rugged Tablet Market Breakdown by Operating System

10.1.1.3.3 Columbia Rugged Tablet Market Breakdown by Application

10.1.1.4 Rest of South & Central America Rugged Tablet Market Revenue and Forecasts to 2030 (US$ Million)

10.1.1.4.1 Rest of South & Central America Rugged Tablet Market Breakdown by Type

10.1.1.4.2 Rest of South & Central America Rugged Tablet Market Breakdown by Operating System

10.1.1.4.3 Rest of South & Central America Rugged Tablet Market Breakdown by Application

11. Rugged Tablet Market Industry Landscape

11.1 Overview

11.2 Market Initiative

11.3 New Product Development

11.4 Merger and Acquisition

12. Company Profiles

12.1 AAEON Technology Inc

12.1.1 Key Facts

12.1.2 Business Description

12.1.3 Products and Services

12.1.4 Financial Overview

12.1.5 SWOT Analysis

12.1.6 Key Developments

12.2 Dell Technologies Inc

12.2.1 Key Facts

12.2.2 Business Description

12.2.3 Products and Services

12.2.4 Financial Overview

12.2.5 SWOT Analysis

12.2.6 Key Developments

12.3 Panasonic Holdings Corp

12.3.1 Key Facts

12.3.2 Business Description

12.3.3 Products and Services

12.3.4 Financial Overview

12.3.5 SWOT Analysis

12.3.6 Key Developments

12.4 Zebra Technologies Corp

12.4.1 Key Facts

12.4.2 Business Description

12.4.3 Products and Services

12.4.4 Financial Overview

12.4.5 SWOT Analysis

12.4.6 Key Developments

12.5 Kontron AG

12.5.1 Key Facts

12.5.2 Business Description

12.5.3 Products and Services

12.5.4 Financial Overview

12.5.5 SWOT Analysis

12.5.6 Key Developments

13. Appendix

13.1 About The Insight Partners

13.2 Word Index


List of Tables

Table 1. Rugged Tablet Market Segmentation

Table 2. Rugged Tablet Market Revenue and Forecasts to 2030 (US$ Million) - Type

Table 3. Rugged Tablet Market Revenue and Forecasts to 2030 (US$ Million) - Operating System

Table 4. Rugged Tablet Market Revenue and Forecasts to 2030 (US$ Million) - Application

Table 5. South and Central America Rugged Tablet Market, by Country - Revenue and Forecast to 2030 (USD Million)

Table 6. Brazil Rugged Tablet Market Revenue and Forecasts to 2030 (US$ Million) - By Type

Table 7. Brazil Rugged Tablet Market Revenue and Forecasts to 2030 (US$ Million) - By Operating System

Table 8. Brazil Rugged Tablet Market Revenue and Forecasts to 2030 (US$ Million) - By Application

Table 9. Argentina Rugged Tablet Market Revenue and Forecasts to 2030 (US$ Million) - By Type

Table 10. Argentina Rugged Tablet Market Revenue and Forecasts to 2030 (US$ Million) - By Operating System

Table 11. Argentina Rugged Tablet Market Revenue and Forecasts to 2030 (US$ Million) - By Application

Table 12. Columbia Rugged Tablet Market Revenue and Forecasts to 2030 (US$ Million) - By Type

Table 13. Columbia Rugged Tablet Market Revenue and Forecasts to 2030 (US$ Million) - By Operating System

Table 14. Columbia Rugged Tablet Market Revenue and Forecasts to 2030 (US$ Million) - By Application

Table 15. Rest of South & Central America Rugged Tablet Market Revenue and Forecasts to 2030 (US$ Million) - By Type

Table 16. Rest of South & Central America Rugged Tablet Market Revenue and Forecasts to 2030 (US$ Million) - By Operating System

Table 17. Rest of South & Central America Rugged Tablet Market Revenue and Forecasts to 2030 (US$ Million) - By Application

Table 18. List of Abbreviation


List of Figures

Figure 1. Rugged Tablet Market Segmentation, By Country

Figure 2. Ecosystem: Rugged Tablet Market

Figure 3. Rugged Tablet Market - Key Industry Dynamics

Figure 4. Impact Analysis of Drivers and Restraints

Figure 5. South & Central America Rugged Tablet Market Revenue (US$ Million), 2022 - 2030

Figure 6. Rugged Tablet Market Share (%) - Type, 2022 and 2030

Figure 7. Fully Rugged Tablet: Market Revenue and Forecasts to 2030 (US$ Million)

Figure 8. Semi Rugged Tablet: Market Revenue and Forecasts to 2030 (US$ Million)

Figure 9. Ultra Rugged Tablet: Market Revenue and Forecasts to 2030 (US$ Million)

Figure 10. Rugged Tablet Market Share (%) - Operating System, 2022 and 2030

Figure 11. Android: Market Revenue and Forecasts to 2030 (US$ Million)

Figure 12. Windows: Market Revenue and Forecasts to 2030 (US$ Million)

Figure 13. iOS: Market Revenue and Forecasts to 2030 (US$ Million)

Figure 14. Rugged Tablet Market Share (%) - Application, 2022 and 2030

Figure 15. Aerospace & Defense: Market Revenue and Forecasts to 2030 (US$ Million)

Figure 16. Automotive: Market Revenue and Forecasts to 2030 (US$ Million)

Figure 17. Construction: Market Revenue and Forecasts to 2030 (US$ Million)

Figure 18. Energy & Utilities: Market Revenue and Forecasts to 2030 (US$ Million)

Figure 19. Manufacturing: Market Revenue and Forecasts to 2030 (US$ Million)

Figure 20. Oil & Gas: Market Revenue and Forecasts to 2030 (US$ Million)

Figure 21. Others: Market Revenue and Forecasts to 2030 (US$ Million)

Figure 22. South & Central America Rugged Tablet Market, by Key Countries - Revenue (2022) (Million)

Figure 23. Rugged Tablet Market Breakdown by Key Countries, 2022 and 2030 (%)

Figure 24. Brazil Rugged Tablet Market Revenue and Forecasts to 2030 (US$ Million)

Figure 25. Argentina Rugged Tablet Market Revenue and Forecasts to 2030 (US$ Million)

Figure 26. Columbia Rugged Tablet Market Revenue and Forecasts to 2030 (US$ Million)

Figure 27. Rest of South & Central America Rugged Tablet Market Revenue and Forecasts to 2030 (US$ Million)

1. AAEON Technology Inc


2. Dell Technologies Inc

3. Panasonic Holdings Corp

4. Zebra Technologies Corp

5. Kontron AG


  • Save and reduce time carrying out entry-level research by identifying the growth, size, leading players, and segments in the South & Central America rugged tablet market.
  • Highlights key business priorities in order to assist companies to realign their business strategies.
  • The key findings and recommendations highlight crucial progressive industry trends in the South & Central America rugged tablet market, thereby allowing players across the value chain to develop effective long-term strategies.
  • Develop/modify business expansion plans by using substantial growth offering developed and emerging markets.
  • Scrutinize in-depth South & Central America market trends and outlook coupled with the factors driving the South & Central America rugged tablet market, as well as those hindering it.
  • Enhance the decision-making process by understanding the strategies that underpin commercial interest with respect to client products, segmentation, pricing, and distribution.
Report Code
Full Name
Country Name
Email Id
Phone Number
Job Title
Company
Requirement

Note : Your data will never be shared with third parties, however, we may send you information from time to time about our products that may be of interest to you. By submitting your details, you agree to be contacted by us. You may contact us at any time to opt-out.


Purchase Options
Single User License
$3550
$2840
Site License
$4550
$3640
Enterprise License
$5550
$4440