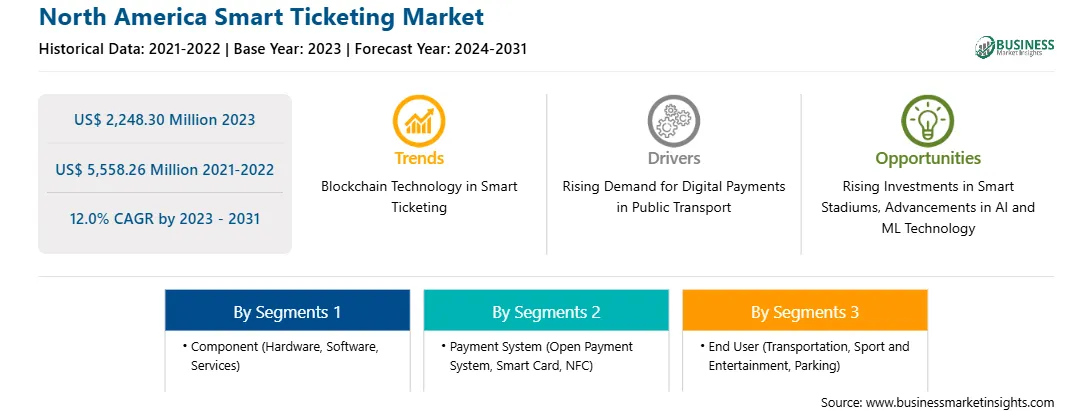
2031 年北美智能票务市场预测 – 区域分析 – 按组件(硬件、软件和服务)、支付系统(开放支付系统、智能卡和 NFC)和最终用户(交通、体育和娱乐、停车等)
公共交通数字支付需求不断增长推动北美智能票务市场发展
现代城市提供各种交通选择,例如公共汽车、火车和地铁。每个公共交通系统都有自己的票务系统。管理不同交通方式的多张智能卡或应用程序可能会让通勤者不堪重负。需要一种集中的方法来整合所有交通网络。朝着这个方向发展,世界各地的公共交通基础设施正在升级。升级还旨在通过无缝支付界面改善通勤者的体验。例如,2024 年,Indra 获得了一份价值 1600 万美元的合同,为 Bi-State Development(一家运营圣路易斯都会区公共交通服务的州际公共机构)和 MetroLink(美国密苏里州和伊利诺伊州的轻轨网络)翻新售票机。该合同涵盖为圣路易斯地铁网络的 38 个车站设计、生产和交付全新的尖端自动售货机。这些机器将取代目前正在使用的机器,这些机器之前由 Indra 在 2006 年至 2012 年间交付。Indra 还将负责维护这些机器,并建立基于云的管理系统来跟踪和管理它们。随着城市发展成为智能、互联和数字优先的环境,公共交通服务的数字支付将继续成为首要议题,从而推动智能票务市场的增长。
北美智能票务市场概览
由于智能票务系统中使用的智能卡技术的进步,北美智能票务市场正在经历显着增长。智能手机和尖端可穿戴设备推动的非接触式解决方案正在获得显着的关注,因为这些解决方案有助于优化时间并通过灵活的支付选项减少实体售票柜台的摩擦。三星等知名智能可穿戴设备制造商已在其智能手表中引入了支付功能。此外,大多数设备制造商正在将支付服务(包括三星支付、Fitbit Pay、Apple Pay、Garmin Pay 和 Google Pay)集成到他们的移动钱包产品中。虽然智能手表支付仍处于发展阶段,但它们具有巨大的市场潜力。这些发展预计将使消费者能够使用他们的可穿戴设备购买门票,反映出票务格局的显着转变。此外,Cubic Corporation 等主要智能票务市场参与者采取的举措对市场有利。
例如,2023 年 5 月,英飞凌的 CALYPSO 举措促进了符合开放标准的可互操作票务解决方案的开发,使制造商能够根据运输运营商和当局的独特需求量身定制解决方案。这种方法消除了对磁条、条形码和专有票证的依赖,确保了跨不同系统的更大灵活性和兼容性。这一发展代表着在全州范围内实现非接触式票务系统的现代化和扩展方面迈出了重要一步,计划在整个客运铁路系统中全面部署,随后是公交车和渡轮。
北美智能票务市场收入和预测到 2031 年(百万美元)
北美智能票务市场细分
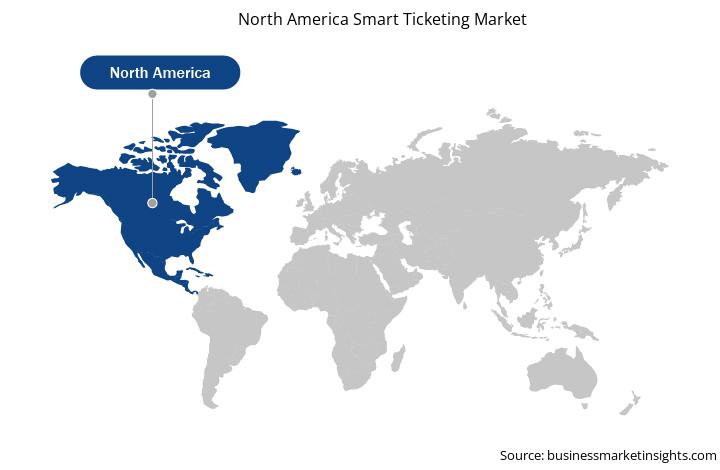
北美智能票务市场分为组件、支付系统、最终用户和国家。
根据组件,北美智能票务市场分为硬件、软件和服务。 2023 年,硬件部分占据了最大的市场份额。
按技术划分,北美智能票务市场分为开放支付系统、智能卡和 NFC。智能卡部分在 2023 年占据了最大的市场份额。
根据最终用户,北美智能票务市场细分为交通、体育和娱乐、停车等。2023 年,交通运输部分占据了最大的市场份额。
按国家划分,北美智能票务市场分为美国、加拿大和墨西哥。2023 年,美国占据了北美智能票务市场份额的主导地位。
英飞凌科技股份公司、恩智浦半导体公司、施乐控股公司、Cubic Corp、IDEMIA France SAS、Thales SA、Confidex、HID Global Corp 和西门子能源股份公司是北美智能票务市场的一些领先公司。
1. Introduction
1.1 The Insight Partners Research Report Guidance
1.2 Market Segmentation
2. Executive Summary
2.1 Key Insights
2.2 Market Attractiveness
3. Research Methodology
3.1 Secondary Research
3.2 Primary Research
3.2.1 Hypothesis formulation:
3.2.2 Macro-economic factor analysis:
3.2.3 Developing base number:
3.2.4 Data Triangulation:
3.2.5 Country level data:
4. North America Smart Ticketing Market Landscape
4.1 Overview
4.2 Ecosystem Analysis
4.2.1 List of Vendors in the Value Chain
4.3 List of Vendors
5. North America Smart Ticketing Market – Key Market Dynamics
5.1 Market Drivers
5.1.1 Rising Demand for Digital Payments in Public Transport
5.1.2 Increasing Integration of IoT for Better Mobility in Smart Cities
5.2 Market Restraints
5.2.1 Data Safety and Security Issues
5.3 Market Opportunities
5.3.1 Rising Investments in Smart Stadiums
5.3.2 Advancements in AI and ML Technology
5.4 Future Trends
5.4.1 Blockchain Technology in Smart Ticketing
5.5 Impact of Drivers and Restraints:
6. Smart Ticketing Market – North America Market Analysis
6.1 Overview
6.2 Smart Ticketing Market Revenue (US$ Million), 2021–2031
6.3 Smart Ticketing Market Forecast Analysis
7. North America Smart Ticketing Market Analysis – by Component
7.1 Hardware
7.1.1 Overview
7.1.2 Hardware: Smart Ticketing Market – Revenue and Forecast to 2031 (US$ Million)
7.2 Software
7.2.1 Overview
7.2.2 Software: Smart Ticketing Market – Revenue and Forecast to 2031 (US$ Million)
7.3 Services
7.3.1 Overview
7.3.2 Services: Smart Ticketing Market – Revenue and Forecast to 2031 (US$ Million)
8. North America Smart Ticketing Market Analysis – by Payment System
8.1 Open Payment System
8.1.1 Overview
8.1.2 Open Payment System: Smart Ticketing Market – Revenue and Forecast to 2031 (US$ Million)
8.2 Smart Card
8.2.1 Overview
8.2.2 Smart Card: Smart Ticketing Market – Revenue and Forecast to 2031 (US$ Million)
8.3 NFC
8.3.1 Overview
8.3.2 NFC: Smart Ticketing Market – Revenue and Forecast to 2031 (US$ Million)
9. North America Smart Ticketing Market Analysis – by End User
9.1 Transportation
9.1.1 Overview
9.1.2 Transportation: Smart Ticketing Market – Revenue and Forecast to 2031 (US$ Million)
9.2 Sport and Entertainment
9.2.1 Overview
9.2.2 Sport and Entertainment: Smart Ticketing Market – Revenue and Forecast to 2031 (US$ Million)
9.3 Parking
9.3.1 Overview
9.3.2 Parking: Smart Ticketing Market – Revenue and Forecast to 2031 (US$ Million)
9.4 Others
9.4.1 Overview
9.4.2 Others: Smart Ticketing Market – Revenue and Forecast to 2031 (US$ Million)
10. North America Smart Ticketing Market – Country Analysis
10.1 North America
10.1.1 North America: Smart Ticketing Market – Revenue and Forecast Analysis – by Country
10.1.1.1 North America: Smart Ticketing Market – Revenue and Forecast Analysis – by Country
10.1.1.2 United States: Smart Ticketing Market – Revenue and Forecast to 2031 (US$ Million)
10.1.1.2.1 United States: Smart Ticketing Market Breakdown, by Component
10.1.1.2.2 United States: Smart Ticketing Market Breakdown, by Payment System
10.1.1.2.3 United States: Smart Ticketing Market Breakdown, by End User
10.1.1.3 Canada: Smart Ticketing Market – Revenue and Forecast to 2031 (US$ Million)
10.1.1.3.1 Canada: Smart Ticketing Market Breakdown, by Component
10.1.1.3.2 Canada: Smart Ticketing Market Breakdown, by Payment System
10.1.1.3.3 Canada: Smart Ticketing Market Breakdown, by End User
10.1.1.4 Mexico: Smart Ticketing Market – Revenue and Forecast to 2031 (US$ Million)
10.1.1.4.1 Mexico: Smart Ticketing Market Breakdown, by Component
10.1.1.4.2 Mexico: Smart Ticketing Market Breakdown, by Payment System
10.1.1.4.3 Mexico: Smart Ticketing Market Breakdown, by End User
11. Competitive Landscape
11.1 Heat Map Analysis by Key Players
11.2 Company Positioning & Concentration
12. Industry Landscape
12.1 Overview
12.2 Market Initiative
13. Company Profiles
13.1 Infineon Technologies AG
13.1.1 Key Facts
13.1.2 Business Description
13.1.3 Products and Services
13.1.4 Financial Overview
13.1.5 SWOT Analysis
13.1.6 Key Developments
13.2 NXP Semiconductors NV
13.2.1 Key Facts
13.2.2 Business Description
13.2.3 Products and Services
13.2.4 Financial Overview
13.2.5 SWOT Analysis
13.2.6 Key Developments
13.3 Xerox Holdings Corp
13.3.1 Key Facts
13.3.2 Business Description
13.3.3 Products and Services
13.3.4 Financial Overview
13.3.5 SWOT Analysis
13.3.6 Key Developments
13.4 Cubic Corp
13.4.1 Key Facts
13.4.2 Business Description
13.4.3 Products and Services
13.4.4 Financial Overview
13.4.5 SWOT Analysis
13.4.6 Key Developments
13.5 IDEMIA France SAS
13.5.1 Key Facts
13.5.2 Business Description
13.5.3 Products and Services
13.5.4 Financial Overview
13.5.5 SWOT Analysis
13.5.6 Key Developments
13.6 Thales SA
13.6.1 Key Facts
13.6.2 Business Description
13.6.3 Products and Services
13.6.4 Financial Overview
13.6.5 SWOT Analysis
13.6.6 Key Developments
13.7 Confidex
13.7.1 Key Facts
13.7.2 Business Description
13.7.3 Products and Services
13.7.4 Financial Overview
13.7.5 SWOT Analysis
13.7.6 Key Developments
13.8 HID Global Corp
13.8.1 Key Facts
13.8.2 Business Description
13.8.3 Products and Services
13.8.4 Financial Overview
13.8.5 SWOT Analysis
13.8.6 Key Developments
13.9 Siemens Energy AG
13.9.1 Key Facts
13.9.2 Business Description
13.9.3 Products and Services
13.9.4 Financial Overview
13.9.5 SWOT Analysis
13.9.6 Key Developments
14. Appendix
14.1 About The Insight Partners
14.2 Word Index
List of Tables
Table 1. North America Smart Ticketing Market Segmentation
Table 2. Smart Ticketing Market – Revenue and Forecast to 2031 (US$ Million)
Table 3. Smart Ticketing Market – Revenue and Forecast to 2031 (US$ Million) – by Component
Table 4. Smart Ticketing Market – Revenue and Forecast to 2031 (US$ Million) – by Payment System
Table 5. Smart Ticketing Market – Revenue and Forecast to 2031 (US$ Million) – by End User
Table 6. North America: Smart Ticketing Market – Revenue and Forecast to 2031(US$ Million) – by Country
Table 7. United States: Smart Ticketing Market – Revenue and Forecast to 2031(US$ Million) – by Component
Table 8. United States: Smart Ticketing Market – Revenue and Forecast to 2031(US$ Million) – by Payment System
Table 9. United States: Smart Ticketing Market – Revenue and Forecast to 2031(US$ Million) – by End User
Table 10. Canada: Smart Ticketing Market – Revenue and Forecast to 2031(US$ Million) – by Component
Table 11. Canada: Smart Ticketing Market – Revenue and Forecast to 2031(US$ Million) – by Payment System
Table 12. Canada: Smart Ticketing Market – Revenue and Forecast to 2031(US$ Million) – by End User
Table 13. Mexico: Smart Ticketing Market – Revenue and Forecast to 2031(US$ Million) – by Component
Table 14. Mexico: Smart Ticketing Market – Revenue and Forecast to 2031(US$ Million) – by Payment System
Table 15. Mexico: Smart Ticketing Market – Revenue and Forecast to 2031(US$ Million) – by End User
Table 16. List of Abbreviation
List of Figures
Figure 1. North America Smart Ticketing Market Segmentation, by Country
Figure 2. Ecosystem: Smart Ticketing Market
Figure 3. Smart Ticketing Market – Key Market Dynamics
Figure 4. Impact Analysis of Drivers and Restraints
Figure 5. Smart Ticketing Market Revenue (US$ Million), 2021–2031
Figure 6. Smart Ticketing Market Share (%) – by Component (2023 and 2031)
Figure 7. Hardware: Smart Ticketing Market – Revenue and Forecast to 2031 (US$ Million)
Figure 8. Software: Smart Ticketing Market – Revenue and Forecast to 2031 (US$ Million)
Figure 9. Services: Smart Ticketing Market – Revenue and Forecast to 2031 (US$ Million)
Figure 10. Smart Ticketing Market Share (%) – by Payment System (2023 and 2031)
Figure 11. Open Payment System: Smart Ticketing Market – Revenue and Forecast to 2031 (US$ Million)
Figure 12. Smart Card: Smart Ticketing Market – Revenue and Forecast to 2031 (US$ Million)
Figure 13. NFC: Smart Ticketing Market – Revenue and Forecast to 2031 (US$ Million)
Figure 14. Smart Ticketing Market Share (%) – by End User (2023 and 2031)
Figure 15. Transportation: Smart Ticketing Market – Revenue and Forecast to 2031 (US$ Million)
Figure 16. Sport and Entertainment: Smart Ticketing Market – Revenue and Forecast to 2031 (US$ Million)
Figure 17. Parking: Smart Ticketing Market – Revenue and Forecast to 2031 (US$ Million)
Figure 18. Others: Smart Ticketing Market – Revenue and Forecast to 2031 (US$ Million)
Figure 19. North America Smart Ticketing Market, by Key Countries - Revenue (2023) (US$ Million)
Figure 20. North America: Smart Ticketing Market Breakdown, by Key Countries, 2023 and 2031 (%)
Figure 21. United States: Smart Ticketing Market – Revenue and Forecast to 2031(US$ Million)
Figure 22. Canada: Smart Ticketing Market – Revenue and Forecast to 2031(US$ Million)
Figure 23. Mexico: Smart Ticketing Market – Revenue and Forecast to 2031(US$ Million)
Figure 24. Heat Map Analysis by Key Players
Figure 25. Company Positioning & Concentration
- Infineon Technologies AG.
- NXP Semiconductors NV.
- Xerox Holdings Corp.
- Cubic Corp.
- IDEMIA France SAS.
- Thales SA.
- Confidex.
- HID Global Corp.
- Siemens Energy AG.
- Save and reduce time carrying out entry-level research by identifying the growth, size, leading players, and segments in the North America smart ticketing market.
- Highlights key business priorities in order to assist companies to realign their business strategies.
- The key findings and recommendations highlight crucial progressive industry trends in the North America smart ticketing market, thereby allowing players across the value chain to develop effective long-term strategies.
- Develop/modify business expansion plans by using substantial growth offering developed and emerging markets
- Scrutinize in-depth North America market trends and outlook coupled with the factors driving the North America smart ticketing market, as well as those hindering it.
- Enhance the decision-making process by understanding the strategies that underpin commercial interest with respect to client products, segmentation, pricing, and distribution.