中东和非洲茶提取物市场预测至 2031 年 – 区域分析 – 按类型(绿茶、红茶、乌龙茶等)、类别(传统和有机)、形式(粉末和液体)和应用(食品和饮料、烘焙和糖果、乳制品和冷冻甜点、饮料、其他食品和饮料、膳食补充剂、个人护理和化妆品等)

BMIRE00031067 | Pages: 142 | Consumer Goods | Dec 2024 | Status: Published
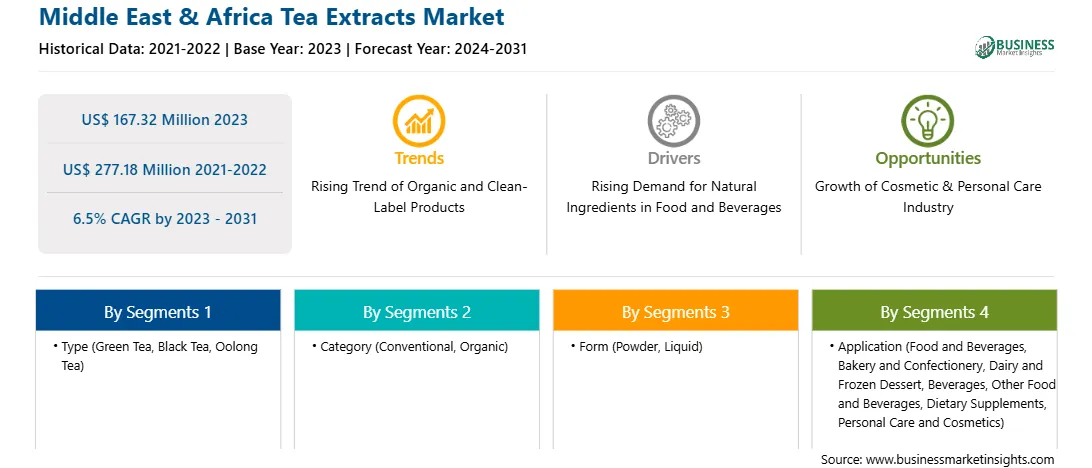
2023 年,中东和非洲茶提取物市场价值为 1.6732 亿美元,预计到 2031 年将达到 2.7718 亿美元;预计 2023 年至 2031 年的复合年增长率为 6.5%。

有机和清洁标签产品的上升趋势推动了中东和非洲茶提取物市场的发展

全球消费者都倾向于采用更健康的生活方式。天然风味可以满足消费者的饮食要求。菜单上的描述和食品包装上的标签对消费者的偏好有很大影响。清晰易懂且包含详尽成分信息的标签会吸引消费者购买产品。公司在包装正面声称产品中含有天然成分可能会吸引大量消费者。随着消费者越来越喜欢不含防腐剂、人工色素、香精等合成成分的 100% 天然产品,清洁标签产品正变得越来越受欢迎。Virginia Dare Extract Co 和 Florida Food Products, Inc 是提供清洁标签茶提取物的公司之一。

有机产品是用粪肥或堆肥自然种植的,不使用化学肥料和杀虫剂。有机产品不含生长激素、转基因成分 (GMI) 和抗生素残留物。由于人们越来越意识到有机茶的好处,有机产品(如有机茶)在注重健康的消费者中的受欢迎程度有所提高。有机茶种植包括环保的农业实践,可提高作物产量。亚洲国家和其他茶叶种植经济体的许多有机茶种植社区都遵循有机农业实践来生产增值有机产品。因此,制造商正在推出有机茶提取物以满足日益增长的需求。例如,2022 年 11 月,植物提取物成分制造商 Layn Natural Ingredients 推出了有机形式的茶提取物。

个人护理、食品和饮料以及营养保健品等一些终端使用行业使用有机茶提取物来确保提供不含转基因生物 (GMO) 或任何其他可疑成分的可持续产品。有机产品为茶提取物制造商提供了显着的竞争优势,提高了他们的品牌知名度和盈利能力。

因此,预计在预测期内,对有机和清洁标签产品的需求不断增长将在茶提取物市场中创造新的趋势。

中东和非洲茶提取物市场概览

就价值而言,中东和非洲其他地区的茶提取物市场在 2023 年的价值为 9487 万美元,预计到 2031 年将达到 1.4961 亿美元;预计 2023 年至 2031 年的复合年增长率为 5.9%。

土耳其、科威特、卡塔尔、巴林、阿曼和肯尼亚是中东和非洲其他地区茶提取物市场的主要国家。日益增强的健康意识、茶的文化意义以及各个行业的产品创新推动了茶提取物市场的发展。海湾国家可支配收入的增加刺激了对优质茶提取物产品的需求,而旅游业则让消费者接触到多样化的茶文化。肯尼亚等茶叶生产能力强大的国家正在探索茶提取物市场的机会,既可用于国内使用,也可用于出口。这些因素共同塑造了茶提取物市场的动态格局。

中东和非洲茶提取物市场收入及预测至 2031 年(百万美元)

中东和非洲茶提取物市场细分

中东和非洲茶提取物市场分为类型、类别、形式、应用和国家。

根据类型,中东和非洲茶提取物市场细分为绿茶、红茶、乌龙茶等。绿茶部分在 2023 年占据最大市场份额。

就形式而言,中东和非洲茶提取物市场分为粉末和液体。液体部分在 2023 年占据更大的市场份额。

按应用,中东和非洲茶提取物市场细分为食品和饮料、烘焙和糖果、乳制品和冷冻甜点、饮料、其他食品和饮料、膳食补充剂、个人护理和化妆品等。 2023 年,食品和饮料部门占据了最大的市场份额。

按类别划分,中东和非洲茶提取物市场分为传统和有机。2023 年,传统部门占据了更大的市场份额。

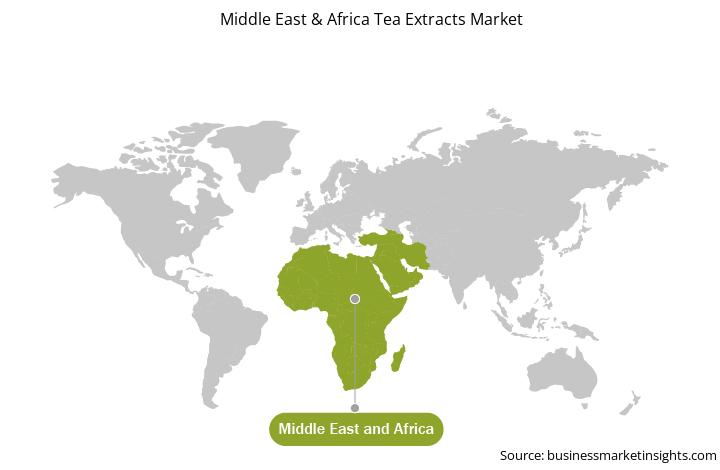
按国家划分,中东和非洲茶提取物市场分为阿联酋、南非、沙特阿拉伯和中东及非洲其他地区。 2023 年,中东和非洲其他地区占据了中东和非洲茶提取物市场的主导份额。

Finlays、Botanic Healthcare Group、Martin Bauer GmbH & Co KG、Firmenich International SA、Givaudan SA、International Flavors & Fragrances Inc、Kerry Group Plc、Archer Daniels Midland Company、Sensient Technologies Corp、Kemin Industries Inc、Medikonda Nutrients、Virginia Dare Extract Co Inc、Lipoid-Kosmetik、Florida Food Products 和 Dohler GmbH 是中东和非洲茶提取物市场的一些领先公司。

1.           Introduction

1.1       Report Guidance

1.2       Market Segmentation

2.           Executive Summary

2.1       Key Insights

2.2       Market Attractiveness

3.           Research Methodology

3.1       Secondary Research

3.2       Primary Research

3.2.1         Hypothesis formulation:

3.2.2         Macroeconomic factor analysis:

3.2.3         Developing base number:

3.2.4         Data Triangulation:

3.2.5         Country-level data:

3.3       Assumptions and Limitations

4.           Middle East & Africa Tea Extracts Market Landscape

4.1       Overview

4.2       Porter's Five Forces Analysis

4.3       Ecosystem Analysis

4.4       List of Vendors in the Value Chain

5.           Middle East & Africa Tea Extracts Market – Key Market Dynamics

5.1       Market Drivers

5.2       Market Restraints

5.3       Market Opportunities

5.4       Future Trends

5.5        Impact of Drivers and Restraints:

6.           Middle East & Africa Tea Extracts Market – Analysis

6.1       Middle East & Africa Tea Extracts Market Revenue (US$ Million), 2021–2031

6.2       Middle East & Africa Tea Extracts Market Forecast Analysis

7.           Middle East & Africa Tea Extracts Market Analysis – by Type

7.1       Green Tea

7.1.1         Overview

7.1.2         Green Tea: Middle East & Africa Tea Extracts Market – Revenue and Forecast, 2021–2031 (US$ Million)

7.2       Black Tea

7.2.1         Overview

7.2.2         Black Tea: Middle East & Africa Tea Extracts Market – Revenue and Forecast, 2021–2031 (US$ Million)

7.3       Oolong Tea

7.3.1         Overview

7.3.2         Oolong Tea: Middle East & Africa Tea Extracts Market – Revenue and Forecast, 2021–2031 (US$ Million)

7.4       Others

7.4.1         Overview

7.4.2         Others: Middle East & Africa Tea Extracts Market – Revenue and Forecast, 2021–2031 (US$ Million)

8.           Middle East & Africa Tea Extracts Market Analysis – by Category

8.1       Conventional

8.1.1         Overview

8.1.2         Conventional: Middle East & Africa Tea Extracts Market – Revenue and Forecast, 2021–2031 (US$ Million)

8.2       Organic

8.2.1         Overview

8.2.2         Organic: Middle East & Africa Tea Extracts Market – Revenue and Forecast, 2021–2031 (US$ Million)

9.           Middle East & Africa Tea Extracts Market Analysis – by Form

9.1       Powder

9.1.1         Overview

9.1.2         Powder: Middle East & Africa Tea Extracts Market – Revenue and Forecast, 2021–2031 (US$ Million)

9.2       Liquid

9.2.1         Overview

9.2.2         Liquid: Middle East & Africa Tea Extracts Market – Revenue and Forecast, 2021–2031 (US$ Million)

10.       Middle East & Africa Tea Extracts Market Analysis – by Application

10.1     Food and Beverages

10.1.1       Overview

10.1.2       Food and Beverages: Middle East & Africa Tea Extracts Market – Revenue and Forecast, 2021–2031 (US$ Million)

10.2     Bakery and Confectionery

10.2.1       Overview

10.2.2       Bakery and Confectionery: Middle East & Africa Tea Extracts Market – Revenue and Forecast, 2021–2031 (US$ Million)

10.3     Dairy and Frozen Dessert

10.3.1       Overview

10.3.2       Dairy and Frozen Dessert: Middle East & Africa Tea Extracts Market – Revenue and Forecast, 2021–2031 (US$ Million)

10.4     Beverages

10.4.1       Overview

10.4.2       Beverages: Middle East & Africa Tea Extracts Market – Revenue and Forecast, 2021–2031 (US$ Million)

10.5     Other Food and Beverages

10.5.1       Overview

10.5.2       Other Food and Beverages: Middle East & Africa Tea Extracts Market – Revenue and Forecast, 2021–2031 (US$ Million)

10.6     Dietary Supplements

10.6.1       Overview

10.6.2       Dietary Supplements: Middle East & Africa Tea Extracts Market – Revenue and Forecast, 2021–2031 (US$ Million)

10.7     Personal Care and Cosmetics

10.7.1       Overview

10.7.2       Personal Care and Cosmetics: Middle East & Africa Tea Extracts Market – Revenue and Forecast, 2021–2031 (US$ Million)

10.8     Others

10.8.1       Overview

10.8.2       Others: Middle East & Africa Tea Extracts Market – Revenue and Forecast, 2021–2031 (US$ Million)

11.       Middle East & Africa Tea Extracts Market – Country Analysis

11.1     Middle East & Africa

11.1.1       Middle East & Africa Tea Extracts Market – Revenue and Forecast Analysis – by Country

11.1.1.1          Middle East & Africa Tea Extracts Market – Revenue and Forecast Analysis – by Country

11.1.1.2          United Arab Emirates: Middle East & Africa Tea Extracts Market – Revenue and Forecast, 2021–2031 (US$ Million)

11.1.1.2.1        United Arab Emirates: Middle East & Africa Tea Extracts Market Share – by Type

11.1.1.2.2        United Arab Emirates: Middle East & Africa Tea Extracts Market Share – by Category

11.1.1.2.3        United Arab Emirates: Middle East & Africa Tea Extracts Market Share – by Form

11.1.1.2.4        United Arab Emirates: Middle East & Africa Tea Extracts Market Share – by Application

11.1.1.3          South Africa: Middle East & Africa Tea Extracts Market – Revenue and Forecast, 2021–2031 (US$ Million)

11.1.1.3.1        South Africa: Middle East & Africa Tea Extracts Market Share – by Type

11.1.1.3.2        South Africa: Middle East & Africa Tea Extracts Market Share – by Category

11.1.1.3.3        South Africa: Middle East & Africa Tea Extracts Market Share – by Form

11.1.1.3.4        South Africa: Middle East & Africa Tea Extracts Market Share – by Application

11.1.1.4          Saudi Arabia: Middle East & Africa Tea Extracts Market – Revenue and Forecast, 2021–2031 (US$ Million)

11.1.1.4.1        Saudi Arabia: Middle East & Africa Tea Extracts Market Share – by Type

11.1.1.4.2        Saudi Arabia: Middle East & Africa Tea Extracts Market Share – by Category

11.1.1.4.3        Saudi Arabia: Middle East & Africa Tea Extracts Market Share – by Form

11.1.1.4.4        Saudi Arabia: Middle East & Africa Tea Extracts Market Share – by Application

11.1.1.5          Rest of Middle East & Africa : Middle East & Africa Tea Extracts Market – Revenue and Forecast, 2021–2031 (US$ Million)

11.1.1.5.1        Rest of Middle East & Africa : Middle East & Africa Tea Extracts Market Share – by Type

11.1.1.5.2        Rest of Middle East & Africa : Middle East & Africa Tea Extracts Market Share – by Category

11.1.1.5.3        Rest of Middle East & Africa : Middle East & Africa Tea Extracts Market Share – by Form

11.1.1.5.4        Rest of Middle East & Africa : Middle East & Africa Tea Extracts Market Share – by Application

12.       Competitive Landscape

12.1     Heat Map Analysis by Key Players

12.2     Company Positioning and Concentration

13.       Industry Landscape

13.1     Overview

13.2     Market Initiative

13.3     Partnerships and Collaborations

13.4     Other Developments

14.       Company Profiles

14.1     Finlays

14.1.1       Key Facts

14.1.2       Business Description

14.1.3       Products and Services

14.1.4       Financial Overview

14.1.5       SWOT Analysis

14.1.6       Key Developments

14.2     MartinBauer

14.2.1       Key Facts

14.2.2       Business Description

14.2.3       Products and Services

14.2.4       Financial Overview

14.2.5       SWOT Analysis

14.2.6       Key Developments

14.3     Dohler GmbH

14.3.1       Key Facts

14.3.2       Business Description

14.3.3       Products and Services

14.3.4       Financial Overview

14.3.5       SWOT Analysis

14.3.6       Key Developments

14.4     Firmenich International SA

14.4.1       Key Facts

14.4.2       Business Description

14.4.3       Products and Services

14.4.4       Financial Overview

14.4.5       SWOT Analysis

14.4.6       Key Developments

14.5     Givaudan SA

14.5.1       Key Facts

14.5.2       Business Description

14.5.3       Products and Services

14.5.4       Financial Overview

14.5.5       SWOT Analysis

14.5.6       Key Developments

14.6     International Flavors & Fragrances Inc

14.6.1       Key Facts

14.6.2       Business Description

14.6.3       Products and Services

14.6.4       Financial Overview

14.6.5       SWOT Analysis

14.6.6       Key Developments

14.7     Kerry Group Plc

14.7.1       Key Facts

14.7.2       Business Description

14.7.3       Products and Services

14.7.4       Financial Overview

14.7.5       SWOT Analysis

14.7.6       Key Developments

14.8     Archer Daniels Midland Company

14.8.1       Key Facts

14.8.2       Business Description

14.8.3       Products and Services

14.8.4       Financial Overview

14.8.5       SWOT Analysis

14.8.6       Key Developments

14.9     Sensient Technologies Corp

14.9.1       Key Facts

14.9.2       Business Description

14.9.3       Products and Services

14.9.4       Financial Overview

14.9.5       SWOT Analysis

14.9.6       Key Developments

14.10  Kemin Industries Inc

14.10.1    Key Facts

14.10.2    Business Description

14.10.3    Products and Services

14.10.4    Financial Overview

14.10.5    SWOT Analysis

14.10.6    Key Developments

14.11  Botanic Healthcare Pvt Ltd

14.11.1    Key Facts

14.11.2    Business Description

14.11.3    Products and Services

14.11.4    Financial Overview

14.11.5    SWOT Analysis

14.11.6    Key Developments

14.12  Medikonda Nutrients

14.12.1    Key Facts

14.12.2    Business Description

14.12.3    Products and Services

14.12.4    Financial Overview

14.12.5    SWOT Analysis

14.12.6    Key Developments

14.13  Virginia Dare Extract Co Inc

14.13.1    Key Facts

14.13.2    Business Description

14.13.3    Products and Services

14.13.4    Financial Overview

14.13.5    SWOT Analysis

14.13.6    Key Developments

14.14  Lipoid-Kosmetik

14.14.1    Key Facts

14.14.2    Business Description

14.14.3    Products and Services

14.14.4    Financial Overview

14.14.5    SWOT Analysis

14.14.6    Key Developments

14.15  Florida Food Products

14.15.1    Key Facts

14.15.2    Business Description

14.15.3    Products and Services

14.15.4    Financial Overview

14.15.5    SWOT Analysis

14.15.6    Key Developments

15.       Appendix

15.1     About Us

15.2     List of Abbreviations


List of Tables

Table 1.             Middle East & Africa Tea Extracts Market Segmentation

Table 2.             List of Vendors

Table 3.             Middle East & Africa Tea Extracts Market – Revenue and Forecast, 2021–2031 (US$ Million)

Table 4.             Middle East & Africa Tea Extracts Market – Revenue and Forecast, 2021–2031 (US$ Million) – by Type

Table 5.             Middle East & Africa Tea Extracts Market – Revenue and Forecast, 2021–2031 (US$ Million) – by Category

Table 6.             Middle East & Africa Tea Extracts Market – Revenue and Forecast, 2021–2031 (US$ Million) – by Form

Table 7.             Middle East & Africa Tea Extracts Market – Revenue and Forecast, 2021–2031 (US$ Million) – by Application

Table 8.             Middle East & Africa Tea Extracts Market – Revenue and Forecast, 2021–2031 (US$ Million) – by Country

Table 9.             United Arab Emirates: Middle East & Africa Tea Extracts Market – Revenue and Forecast, 2021 – 2031(US$ Million) – by Type

Table 10.          United Arab Emirates: Middle East & Africa Tea Extracts Market – Revenue and Forecast, 2021 – 2031(US$ Million) – by Category

Table 11.          United Arab Emirates: Middle East & Africa Tea Extracts Market – Revenue and Forecast, 2021 – 2031(US$ Million) – by Form

Table 12.          United Arab Emirates: Middle East & Africa Tea Extracts Market – Revenue and Forecast, 2021 – 2031(US$ Million) – by Application

Table 13.          South Africa: Middle East & Africa Tea Extracts Market – Revenue and Forecast, 2021 – 2031(US$ Million) – by Type

Table 14.          South Africa: Middle East & Africa Tea Extracts Market – Revenue and Forecast, 2021 – 2031(US$ Million) – by Category

Table 15.          South Africa: Middle East & Africa Tea Extracts Market – Revenue and Forecast, 2021 – 2031(US$ Million) – by Form

Table 16.          South Africa: Middle East & Africa Tea Extracts Market – Revenue and Forecast, 2021 – 2031(US$ Million) – by Application

Table 17.          Saudi Arabia: Middle East & Africa Tea Extracts Market – Revenue and Forecast, 2021 – 2031(US$ Million) – by Type

Table 18.          Saudi Arabia: Middle East & Africa Tea Extracts Market – Revenue and Forecast, 2021 – 2031(US$ Million) – by Category

Table 19.          Saudi Arabia: Middle East & Africa Tea Extracts Market – Revenue and Forecast, 2021 – 2031(US$ Million) – by Form

Table 20.          Saudi Arabia: Middle East & Africa Tea Extracts Market – Revenue and Forecast, 2021 – 2031(US$ Million) – by Application

Table 21.          Rest of Middle East & Africa : Middle East & Africa Tea Extracts Market – Revenue and Forecast, 2021 – 2031(US$ Million) – by Type

Table 22.          Rest of Middle East & Africa : Middle East & Africa Tea Extracts Market – Revenue and Forecast, 2021 – 2031(US$ Million) – by Category

Table 23.          Rest of Middle East & Africa : Middle East & Africa Tea Extracts Market – Revenue and Forecast, 2021 – 2031(US$ Million) – by Form

Table 24.          Rest of Middle East & Africa : Middle East & Africa Tea Extracts Market – Revenue and Forecast, 2021 – 2031(US$ Million) – by Application

Table 25.          List of Abbreviations


List of Figures

Figure 1.           Middle East & Africa Tea Extracts Market Segmentation – Country

Figure 2.           Porter's Five Forces Analysis

Figure 3.           Impact Analysis of Drivers and Restraints

Figure 4.           Middle East & Africa Tea Extracts Market Revenue (US$ Million), 2021–2031

Figure 5.           Middle East & Africa Tea Extracts Market Share (%) – by Type (2023 and 2031)

Figure 6.           Green Tea: Middle East & Africa Tea Extracts Market – Revenue and Forecast, 2021–2031 (US$ Million)

Figure 7.           Black Tea: Middle East & Africa Tea Extracts Market – Revenue and Forecast, 2021–2031 (US$ Million)

Figure 8.           Oolong Tea: Middle East & Africa Tea Extracts Market – Revenue and Forecast, 2021–2031 (US$ Million)

Figure 9.           Others: Middle East & Africa Tea Extracts Market – Revenue and Forecast, 2021–2031 (US$ Million)

Figure 10.        Middle East & Africa Tea Extracts Market Share (%) – by Category (2023 and 2031)

Figure 11.        Conventional: Middle East & Africa Tea Extracts Market – Revenue and Forecast, 2021–2031 (US$ Million)

Figure 12.        Organic: Middle East & Africa Tea Extracts Market – Revenue and Forecast, 2021–2031 (US$ Million)

Figure 13.        Middle East & Africa Tea Extracts Market Share (%) – by Form (2023 and 2031)

Figure 14.        Powder: Middle East & Africa Tea Extracts Market – Revenue and Forecast, 2021–2031 (US$ Million)

Figure 15.        Liquid: Middle East & Africa Tea Extracts Market – Revenue and Forecast, 2021–2031 (US$ Million)

Figure 16.        Middle East & Africa Tea Extracts Market Share (%) – by Application (2023 and 2031)

Figure 17.        Food and Beverages: Middle East & Africa Tea Extracts Market – Revenue and Forecast, 2021–2031 (US$ Million)

Figure 18.        Bakery and Confectionery: Middle East & Africa Tea Extracts Market – Revenue and Forecast, 2021–2031 (US$ Million)

Figure 19.        Dairy and Frozen Dessert: Middle East & Africa Tea Extracts Market – Revenue and Forecast, 2021–2031 (US$ Million)

Figure 20.        Beverages: Middle East & Africa Tea Extracts Market – Revenue and Forecast, 2021–2031 (US$ Million)

Figure 21.        Other Food and Beverages: Middle East & Africa Tea Extracts Market – Revenue and Forecast, 2021–2031 (US$ Million)

Figure 22.        Dietary Supplements: Middle East & Africa Tea Extracts Market – Revenue and Forecast, 2021–2031 (US$ Million)

Figure 23.        Personal Care and Cosmetics: Middle East & Africa Tea Extracts Market – Revenue and Forecast, 2021–2031 (US$ Million)

Figure 24.        Others: Middle East & Africa Tea Extracts Market – Revenue and Forecast, 2021–2031 (US$ Million)

Figure 25.        Middle East & Africa Tea Extracts Market Breakdown, by Key Countries, 2023 and 2031 (%)

Figure 26.        United Arab Emirates: Middle East & Africa Tea Extracts Market – Revenue and Forecast, 2021– 2031 (US$ Million)

Figure 27.        South Africa: Middle East & Africa Tea Extracts Market – Revenue and Forecast, 2021– 2031 (US$ Million)

Figure 28.        Saudi Arabia: Middle East & Africa Tea Extracts Market – Revenue and Forecast, 2021– 2031 (US$ Million)

Figure 29.        Rest of Middle East & Africa : Middle East & Africa Tea Extracts Market – Revenue and Forecast, 2021– 2031 (US$ Million)

Figure 30.        Heat Map Analysis by Key Players

Figure 31.        Company Positioning and Concentration

  • Finlays
  • Botanic Healthcare Group
  • Martin Bauer GmbH & Co KG
  • Firmenich International SA
  • Givaudan SA
  • International Flavors & Fragrances Inc
  • Kerry Group Plc
  • Archer Daniels Midland Company
  • Sensient Technologies Corp
  • Kemin Industries Inc
  • Medikonda Nutrients
  • Virginia Dare Extract Co Inc
  • Lipoid-Kosmetik
  • Florida Food Products
  • Dohler GmbH
  • Save and reduce time carrying out entry-level research by identifying the growth, size, leading players, and segments in the Middle East & Africa tea extracts market.    
  • Highlights key business priorities in order to assist companies to realign their business strategies.
  • The key findings and recommendations highlight crucial progressive industry trends in the Middle East & Africa tea extracts market, thereby allowing players across the value chain to develop effective long-term strategies.
  • Develop/modify business expansion plans by using substantial growth offering developed and emerging markets.
  • Scrutinize in-depth Middle East & Africa market trends and outlook coupled with the factors driving the Middle East & Africa tea extracts market, as well as those hindering it.
  • Enhance the decision-making process by understanding the strategies that underpin commercial interest with respect to client products, segmentation, pricing, and distribution.
Report Code
Full Name
Country Name
Email Id
Phone Number
Job Title
Company
Requirement

Note : Your data will never be shared with third parties, however, we may send you information from time to time about our products that may be of interest to you. By submitting your details, you agree to be contacted by us. You may contact us at any time to opt-out.


Purchase Options
Single User License
$3550
$2840
Site License
$4550
$3640
Enterprise License
$5550
$4440