中东和非洲交互式显示器市场预测至 2031 年 - 区域分析 - 按产品(交互式信息亭、交互式白板、交互式桌子、交互式视频墙和交互式显示器)、面板尺寸(17-32 英寸、32-65 英寸和 65 英寸以上)、面板类型(平面、柔性和透明)和垂直行业(零售和酒店、医疗保健、BFSI、教育、娱乐等)

BMIRE00030768 | Pages: 115 | Electronics and Semiconductor | Sep 2024 | Type: Regional | Status: Published

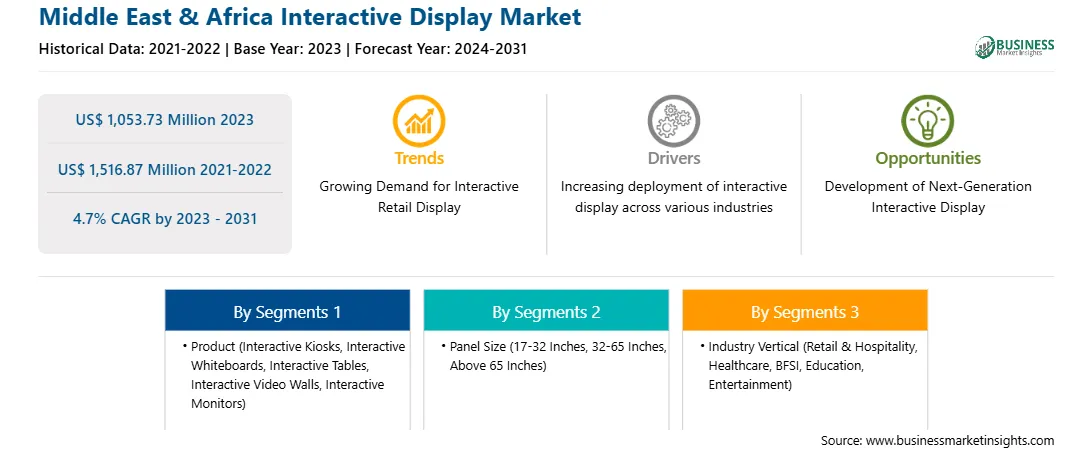
2023 年,中东和非洲交互式显示器市场价值为 10.5373 亿美元,预计到 2031 年将达到 15.1687 亿美元;预计 2023 年至 2031 年的复合年增长率为 4.7%。

智能学习需求不断增长,推动中东和非洲交互式显示器市场发展

一些国家的政府正在加大对交互式显示器的投资,以支持智能教育框架并为数字教室开发合适的基础设施。各国政府纷纷推动交互式显示器在教育系统中的应用,因为它可以帮助用户通过智能观看改善内容的可视化,并允许他们在同一屏幕上同时显示两种或更多种材料。教育行业的扩张进一步鼓励市场参与者开发创新解决方案,以简化教学和学习过程。例如,2023 年 5 月,LG 电子公司推出了用于虚拟教室的 LG Create Board 交互式白板解决方案。这种交互式显示器使教师和学生都可以查看或访问并提供流畅的书写和素描体验。因此,对智能学习的不断增长的需求推动了交互式显示器市场的增长。

中东和非洲交互式显示器市场概览

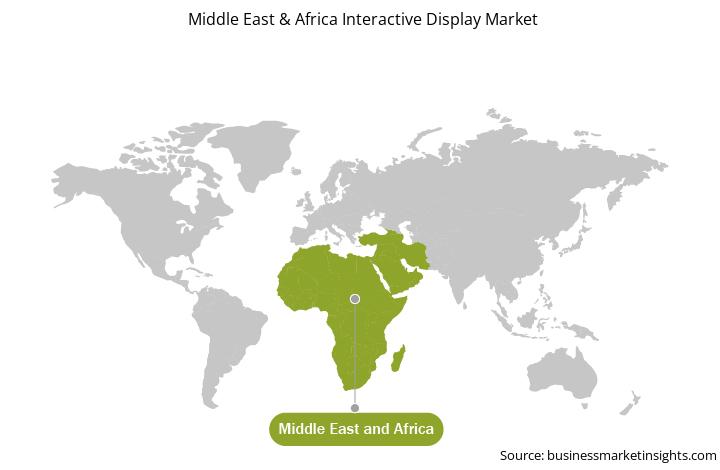
中东和非洲 (MEA) 的交互式显示器市场细分为南非、沙特阿拉伯、阿联酋和 MEA 其他地区。该地区的市场增长归因于南 MEA 远程工作的日益增长的趋势。上述国家的政府正在采取各种措施来促进远程工作文化。例如,2023 年 3 月,阿联酋政府启动了一项新的人力资源计划,通过允许政府雇员在公共图书馆工作来扩展远程工作的概念。该计划旨在让工人在工作时间上有更大的灵活性,并鼓励远程工作文化。

该地区的医疗保健行业也正在经历巨大的增长。沙特阿拉伯占海湾合作委员会 (GCC) 国家医疗保健总支出的约 60%。根据美国商务部国际贸易管理局的数据,沙特阿拉伯宣布将在 2022 年向医疗保健和社会发展投资 368 亿美元,占其 2022 年预算的 14.4%。此外,沙特阿拉伯政府计划到 2030 年投资约 650 亿美元建设完善的医疗保健基础设施。因此,政府鼓励采用远程工作和增加对医疗保健领域的投资等举措预计将推动 MEA 交互式显示器市场的增长。

中东和非洲交互式显示器市场收入和预测到 2031 年(百万美元)

中东和非洲交互式显示器市场细分

中东和非洲交互式显示器市场分为产品、面板尺寸、面板类型、行业垂直和国家。

根据产品,中东和非洲交互式显示器市场分为交互式信息亭、交互式白板、交互式桌子、交互式视频墙和交互式显示器。 2023 年,交互式信息亭部分占据了中东和非洲交互式显示器市场的最大份额。

就面板尺寸而言,中东和非洲交互式显示器市场细分为 17-32 英寸、32-65 英寸和 65 英寸以上。2023 年,65 英寸以上部分占据了中东和非洲交互式显示器市场的最大份额。

按面板类型,中东和非洲交互式显示器市场分为平板、柔性和透明。2023 年,平板部分占据了中东和非洲交互式显示器市场的最大份额。

根据行业垂直,中东和非洲交互式显示器市场分为零售和酒店、医疗保健、BFSI、教育、娱乐等。 2023 年,教育部门占据了中东和非洲交互式显示器市场的最大份额。

按国家/地区划分,中东和非洲交互式显示器市场分为南非、沙特阿拉伯、阿联酋和中东及非洲其他地区。阿联酋在 2023 年占据了阿联酋交互式显示器市场份额的主导地位。

三星电子有限公司、PROMETHEAN LIMITED、LG 电子公司、京东方科技集团有限公司、松下控股公司、夏普电子公司、日立有限公司、明基电通公司、SMART TECHNOLOGIES ULC 和优派公司是中东和非洲交互式显示器市场的一些领先公司。

TABLE OF CONTENTS


1. Introduction

1.1 The Insight Partners Research Report Guidance

1.2 Market Segmentation

2. Executive Summary

2.1 Key Insights

2.2 Market Attractiveness

3. Research Methodology

3.1 Secondary Research

3.2 Primary Research

3.2.1 Hypothesis formulation:

3.2.2 Macro-economic factor analysis:

3.2.3 Developing base number:

3.2.4 Data Triangulation:

3.2.5 Country level data:

4. Interactive Display Market Landscape

4.1 Overview

4.2 Ecosystem Analysis

5. Middle East & Africa Interactive Display Market - Key Market Dynamics

5.1 Market Drivers

5.1.1 Rising Demand for Smart Learning

5.1.2 Increasing Need for Effective Collaboration

5.2 Market Restraints

5.2.1 High Initial and Maintenance Cost

5.3 Market Opportunities

5.3.1 Development of Next-Generation Interactive Display

5.3.2 Increasing Adoption of Touchscreen Tables

5.4 Future Trends

5.4.1 Growing Demand for Interactive Retail Display

5.5 Impact of Drivers and Restraints:

6. Interactive Display Market - Middle East & Africa Analysis

6.1 Overview

6.2 Interactive Display Market Revenue (US$ Million), 2021-2031

6.3 Interactive Display Market Forecast Analysis

7. Middle East & Africa Interactive Display Market Analysis - by Product

7.1 Interactive Kiosks

7.1.1 Overview

7.1.2 Interactive Kiosks: Interactive Display Market - Revenue and Forecast to 2031 (US$ Million)

7.2 Interactive Whiteboards

7.2.1 Overview

7.2.2 Interactive Whiteboards: Interactive Display Market - Revenue and Forecast to 2031 (US$ Million)

7.3 Interactive Tables

7.3.1 Overview

7.3.2 Interactive Tables: Interactive Display Market - Revenue and Forecast to 2031 (US$ Million)

7.4 Interactive Video Walls

7.4.1 Overview

7.4.2 Interactive Video Walls: Interactive Display Market - Revenue and Forecast to 2031 (US$ Million)

7.5 Interactive Monitors

7.5.1 Overview

7.5.2 Interactive Monitors: Interactive Display Market - Revenue and Forecast to 2031 (US$ Million)

8. Middle East & Africa Interactive Display Market Analysis - by Panel Size

8.1 17-32 Inches

8.1.1 Overview

8.1.2 17-32 Inches: Interactive Display Market - Revenue and Forecast to 2031 (US$ Million)

8.2 32-65 Inches

8.2.1 Overview

8.2.2 32-65 Inches: Interactive Display Market - Revenue and Forecast to 2031 (US$ Million)

8.3 Above 65 Inches

8.3.1 Overview

8.3.2 Above 65 Inches: Interactive Display Market - Revenue and Forecast to 2031 (US$ Million)

9. Middle East & Africa Interactive Display Market Analysis - by Panel Type

9.1 Flat

9.1.1 Overview

9.1.2 Flat: Interactive Display Market - Revenue and Forecast to 2031 (US$ Million)

9.2 Flexible

9.2.1 Overview

9.2.2 Flexible: Interactive Display Market - Revenue and Forecast to 2031 (US$ Million)

9.3 Transparent

9.3.1 Overview

9.3.2 Transparent: Interactive Display Market - Revenue and Forecast to 2031 (US$ Million)

10. Middle East & Africa Interactive Display Market Analysis - by Industry Vertical

10.1 Retail and Hospitality

10.1.1 Overview

10.1.2 Retail and Hospitality: Interactive Display Market - Revenue and Forecast to 2031 (US$ Million)

10.2 Healthcare

10.2.1 Overview

10.2.2 Healthcare: Interactive Display Market - Revenue and Forecast to 2031 (US$ Million)

10.3 BFSI

10.3.1 Overview

10.3.2 BFSI: Interactive Display Market - Revenue and Forecast to 2031 (US$ Million)

10.4 Education

10.4.1 Overview

10.4.2 Education: Interactive Display Market - Revenue and Forecast to 2031 (US$ Million)

10.5 Entertainment

10.5.1 Overview

10.5.2 Entertainment: Interactive Display Market - Revenue and Forecast to 2031 (US$ Million)

10.6 Others

10.6.1 Overview

10.6.2 Others: Interactive Display Market - Revenue and Forecast to 2031 (US$ Million)

11. Middle East & Africa Interactive Display Market - Country Analysis

11.1 Middle East & Africa Market Overview

11.1.1 Middle East & Africa: Interactive Display Market, By Key Country - Revenue 2023 (US$ Million)

11.1.2 Middle East & Africa: Interactive Display Market - Revenue and Forecast Analysis - by Country

11.1.2.1 Middle East & Africa: Interactive Display Market - Revenue and Forecast Analysis - by Country

11.1.2.2 South Africa: Interactive Display Market - Revenue and Forecast to 2031 (US$ Million)

11.1.2.2.1 South Africa: Interactive Display Market Breakdown by Product

11.1.2.2.2 South Africa: Interactive Display Market Breakdown by Panel Size

11.1.2.2.3 South Africa: Interactive Display Market Breakdown by Panel Type

11.1.2.2.4 South Africa: Interactive Display Market Breakdown by Industry Vertical

11.1.2.3 Saudi Arabia: Interactive Display Market - Revenue and Forecast to 2031 (US$ Million)

11.1.2.3.1 Saudi Arabia: Interactive Display Market Breakdown by Product

11.1.2.3.2 Saudi Arabia: Interactive Display Market Breakdown by Panel Size

11.1.2.3.3 Saudi Arabia: Interactive Display Market Breakdown by Panel Type

11.1.2.3.4 Saudi Arabia: Interactive Display Market Breakdown by Industry Vertical

11.1.2.4 United Arab Emirates: Interactive Display Market - Revenue and Forecast to 2031 (US$ Million)

11.1.2.4.1 United Arab Emirates: Interactive Display Market Breakdown by Product

11.1.2.4.2 United Arab Emirates: Interactive Display Market Breakdown by Panel Size

11.1.2.4.3 United Arab Emirates: Interactive Display Market Breakdown by Panel Type

11.1.2.4.4 United Arab Emirates: Interactive Display Market Breakdown, by Industry Vertical

11.1.2.5 Rest of Middle East & Africa: Interactive Display Market - Revenue and Forecast to 2031 (US$ Million)

11.1.2.5.1 Rest of Middle East & Africa: Interactive Display Market Breakdown by Product

11.1.2.5.2 Rest of Middle East & Africa: Interactive Display Market Breakdown, by Panel Size

11.1.2.5.3 Rest of Middle East & Africa: Interactive Display Market Breakdown, by Panel Type

11.1.2.5.4 Rest of Middle East & Africa: Interactive Display Market Breakdown, by Industry Vertical

12. Competitive Landscape

12.1 Company Positioning & Concentration

13. Industry Landscape

13.1 Overview

13.2 Market Initiative

13.3 Product Development

14. Company Profiles

14.1 Samsung Electronics Co Ltd

14.1.1 Key Facts

14.1.2 Business Description

14.1.3 Products and Services

14.1.4 Financial Overview

14.1.5 SWOT Analysis

14.1.6 Key Developments

14.2 PROMETHEAN LIMITED

14.2.1 Key Facts

14.2.2 Business Description

14.2.3 Products and Services

14.2.4 Financial Overview

14.2.5 SWOT Analysis

14.2.6 Key Developments

14.3 LG Electronics Inc

14.3.1 Key Facts

14.3.2 Business Description

14.3.3 Products and Services

14.3.4 Financial Overview

14.3.5 SWOT Analysis

14.3.6 Key Developments

14.4 BOE Technology Group Co Ltd

14.4.1 Key Facts

14.4.2 Business Description

14.4.3 Products and Services

14.4.4 Financial Overview

14.4.5 SWOT Analysis

14.4.6 Key Developments

14.5 Panasonic Holdings Corp

14.5.1 Key Facts

14.5.2 Business Description

14.5.3 Products and Services

14.5.4 Financial Overview

14.5.5 SWOT Analysis

14.5.6 Key Developments

14.6 Sharp Electronics Corp

14.6.1 Key Facts

14.6.2 Business Description

14.6.3 Products and Services

14.6.4 Financial Overview

14.6.5 SWOT Analysis

14.6.6 Key Developments

14.7 Hitachi Ltd

14.7.1 Key Facts

14.7.2 Business Description

14.7.3 Products and Services

14.7.4 Financial Overview

14.7.5 SWOT Analysis

14.7.6 Key Developments

14.8 BenQ Corporation

14.8.1 Key Facts

14.8.2 Business Description

14.8.3 Products and Services

14.8.4 Financial Overview

14.8.5 SWOT Analysis

14.8.6 Key Developments

14.9 SMART TECHNOLOGIES ULC

14.9.1 Key Facts

14.9.2 Business Description

14.9.3 Products and Services

14.9.4 Financial Overview

14.9.5 SWOT Analysis

14.9.6 Key Developments

14.10 ViewSonic Corporation

14.10.1 Key Facts

14.10.2 Business Description

14.10.3 Products and Services

14.10.4 Financial Overview

14.10.5 SWOT Analysis

14.10.6 Key Developments

15. Appendix

15.1 Word Index

15.2 About the Insight Partners


List of Tables

Table 1. Interactive Display Market Segmentation

Table 2. List of Vendors in the Value Chain:

Table 3. Interactive Display Market - Revenue and Forecast to 2031 (US$ Million)

Table 4. Interactive Display Market - Revenue and Forecast to 2031 (US$ Million) - by Product

Table 5. Interactive Display Market - Revenue and Forecast to 2031 (US$ Million) - by Panel Size

Table 6. Interactive Display Market - Revenue and Forecast to 2031 (US$ Million) - by Panel Type

Table 7. Interactive Display Market - Revenue and Forecast to 2031 (US$ Million) - by Industry Vertical

Table 8. Middle East & Africa: Interactive Display Market - Revenue and Forecast to 2031 (US$ Million) - by Country

Table 9. South Africa: Interactive Display Market - Revenue and Forecast to 2031 (US$ Million) - by Product

Table 10. South Africa: Interactive Display Market - Revenue and Forecast to 2031 (US$ Million) - by Panel Size

Table 11. South Africa: Interactive Display Market - Revenue and Forecast to 2031 (US$ Million) - by Panel Type

Table 12. South Africa: Interactive Display Market - Revenue and Forecast to 2031 (US$ Million) - by Industry Vertical

Table 13. Saudi Arabia: Interactive Display Market - Revenue and Forecast to 2031 (US$ Million) - by Product

Table 14. Saudi Arabia: Interactive Display Market - Revenue and Forecast to 2031 (US$ Million) - by Panel Size

Table 15. Saudi Arabia: Interactive Display Market - Revenue and Forecast to 2031 (US$ Million) - by Panel Type

Table 16. Saudi Arabia: Interactive Display Market - Revenue and Forecast to 2031 (US$ Million) - by Industry Vertical

Table 17. United Arab Emirates: Interactive Display Market - Revenue and Forecast to 2031 (US$ Million) - by Product

Table 18. United Arab Emirates: Interactive Display Market - Revenue and Forecast to 2031 (US$ Million) - by Panel Size

Table 19. United Arab Emirates: Interactive Display Market - Revenue and Forecast to 2031 (US$ Million) - by Panel Type

Table 20. United Arab Emirates: Interactive Display Market - Revenue and Forecast to 2031 (US$ Million) - by Industry Vertical

Table 21. Rest of Middle East & Africa: Interactive Display Market - Revenue and Forecast to 2031 (US$ Million) - by Product

Table 22. Rest of Middle East & Africa: Interactive Display Market - Revenue and Forecast to 2031 (US$ Million) - by Panel Size

Table 23. Rest of Middle East & Africa: Interactive Display Market - Revenue and Forecast to 2031 (US$ Million) - by Panel Type

Table 24. Rest of Middle East & Africa: Interactive Display Market - Revenue and Forecast to 2031 (US$ Million) - by Industry Vertical

Table 25. List of Abbreviation


List of Figures

Figure 1. Interactive Display Market Segmentation, by Country

Figure 2. Interactive Display Market - Key Market Dynamics

Figure 3. Impact Analysis of Drivers and Restraints

Figure 4. Interactive Display Market Revenue (US$ Million), 2021-2031

Figure 5. Interactive Display Market Share (%) - by Product (2023 and 2031)

Figure 6. Interactive Kiosks: Interactive Display Market - Revenue and Forecast to 2031 (US$ Million)

Figure 7. Interactive Whiteboards: Interactive Display Market - Revenue and Forecast to 2031 (US$ Million)

Figure 8. Interactive Tables: Interactive Display Market - Revenue and Forecast to 2031 (US$ Million)

Figure 9. Interactive Video Walls: Interactive Display Market - Revenue and Forecast to 2031 (US$ Million)

Figure 10. Interactive Monitors: Interactive Display Market - Revenue and Forecast to 2031 (US$ Million)

Figure 11. Interactive Display Market Share (%) - by Panel Size (2023 and 2031)

Figure 12. 17-32 Inches: Interactive Display Market - Revenue and Forecast to 2031 (US$ Million)

Figure 13. 32-65 Inches: Interactive Display Market - Revenue and Forecast to 2031 (US$ Million)

Figure 14. Above 65 Inches: Interactive Display Market - Revenue and Forecast to 2031 (US$ Million)

Figure 15. Interactive Display Market Share (%) - by Panel Type (2023 and 2031)

Figure 16. Flat: Interactive Display Market - Revenue and Forecast to 2031 (US$ Million)

Figure 17. Flexible: Interactive Display Market - Revenue and Forecast to 2031 (US$ Million)

Figure 18. Transparent: Interactive Display Market - Revenue and Forecast to 2031 (US$ Million)

Figure 19. Interactive Display Market Share (%) - by Industry Vertical (2023 and 2031)

Figure 20. Retail and Hospitality: Interactive Display Market - Revenue and Forecast to 2031 (US$ Million)

Figure 21. Healthcare: Interactive Display Market - Revenue and Forecast to 2031 (US$ Million)

Figure 22. BFSI: Interactive Display Market - Revenue and Forecast to 2031 (US$ Million)

Figure 23. Education: Interactive Display Market - Revenue and Forecast to 2031 (US$ Million)

Figure 24. Entertainment: Interactive Display Market - Revenue and Forecast to 2031 (US$ Million)

Figure 25. Others: Interactive Display Market - Revenue and Forecast to 2031 (US$ Million)

Figure 26. Middle East & Africa: Interactive Display Market, By Key Country - Revenue 2023 (US$ Million)

Figure 27. Middle East & Africa: Interactive Display Market Breakdown, by Key Countries, 2023 and 2031 (%)

Figure 28. South Africa: Interactive Display Market - Revenue and Forecast to 2031 (US$ Million)

Figure 29. Saudi Arabia: Interactive Display Market - Revenue and Forecast to 2031 (US$ Million)

Figure 30. United Arab Emirates: Interactive Display Market - Revenue and Forecast to 2031 (US$ Million)

Figure 31. Rest of Middle East & Africa: Interactive Display Market - Revenue and Forecast to 2031 (US$ Million)

Figure 32. Company Positioning & Concentration


  1. Samsung Electronics Co Ltd
  2. PROMETHEAN LIMITED
  3. LG Electronics Inc
  4. BOE Technology Group Co Ltd
  5. Panasonic Holdings Corp
  6. Sharp Electronics Corp
  7. Hitachi Ltd
  8. BenQ Corporation
  9. SMART TECHNOLOGIES ULC
  10. ViewSonic Corporation
  • Save and reduce time carrying out entry-level research by identifying the growth, size, leading players, and segments in the Middle East & Africa interactive display market.
  • Highlights key business priorities to assist companies to realign their business strategies.
  • The key findings and recommendations highlight crucial progressive industry trends in the Middle East & Africa interactive display market, thereby allowing players across the value chain to develop effective long-term strategies.
  • Develop/modify business expansion plans by using substantial growth offering developed and emerging markets.
  • Scrutinize in-depth Middle East & Africa market trends and outlook coupled with the factors driving the Middle East & Africa interactive display market, as well as those hindering it.
  • Enhance the decision-making process by understanding the strategies that underpin commercial interest with respect to client products, segmentation, pricing, and distribution.
Report Code
Full Name
Country Name
Email Id
Phone Number
Job Title
Company
Requirement

Note : Your data will never be shared with third parties, however, we may send you information from time to time about our products that may be of interest to you. By submitting your details, you agree to be contacted by us. You may contact us at any time to opt-out.


Purchase Options
Single User License
$3550
$2485
Site License
$4550
$3185
Enterprise License
$5550
$3885