澳大利亚和新西兰碳会计软件市场规模和预测(2021 - 2031 年)、区域份额、趋势和增长机会分析报告范围:按部署(云和本地)、最终用途行业(建筑和基础设施、制造业、运输和物流、零售贸易和批发贸易)和国家

BMIRE00031039 | Pages: 130 | Technology, Media and Telecommunications | Nov 2024 | Status: Published

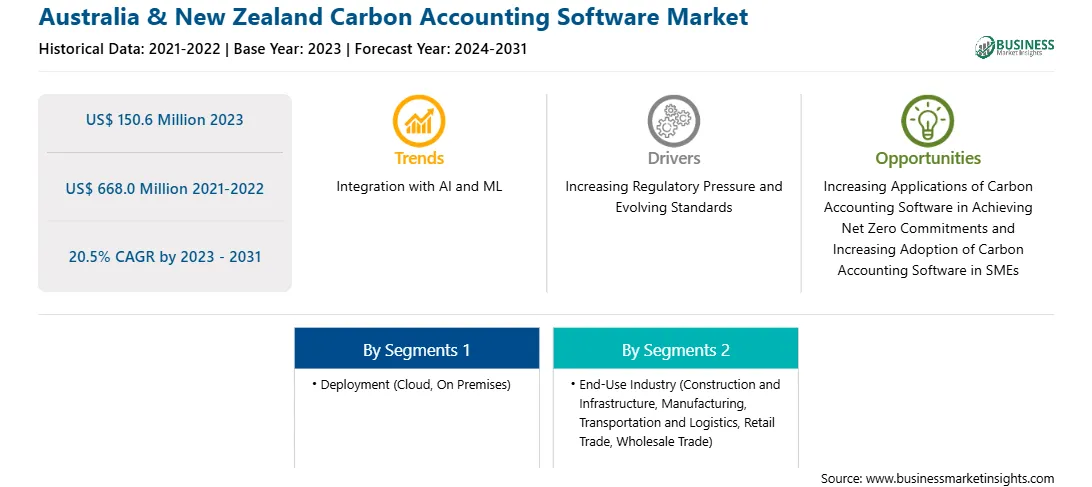
2023 年澳大利亚和新西兰碳核算软件市场规模为 1.506 亿美元,预计到 2031 年将达到 6.68 亿美元;预计 2023 年至 2031 年的复合年增长率为 20.5%。

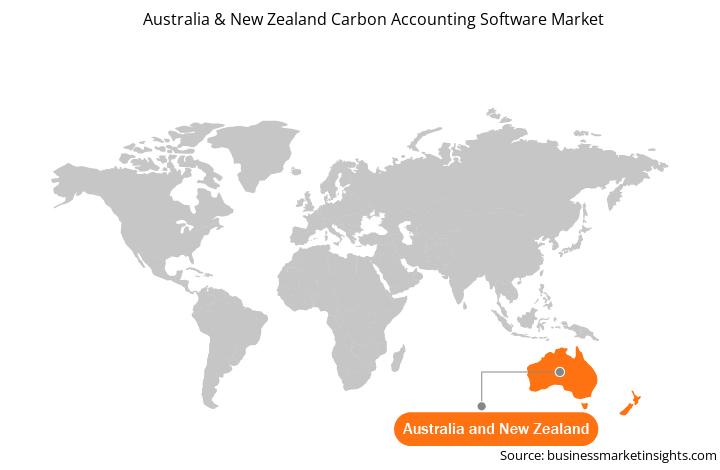
澳大利亚和新西兰碳核算软件市场分为澳大利亚和新西兰。2022 年,澳大利亚各个部门的二氧化碳排放量为 3.559 亿公吨。澳大利亚的可燃燃料使用量占世界二氧化碳总排放量的 1%。根据国际能源署 (IEA) 的数据,工业和运输部门的二氧化碳排放量占澳大利亚二氧化碳总排放量的 35% 以上。此外,2022 年制造业的排放量为 5334 万公吨。相比之下,该国的运输、邮政和仓储部门报告的碳排放量为 2850 万公吨。

澳大利亚已设定了雄心勃勃的目标,通过改造能源部门和实现运输脱碳来实现净零排放。尽管各州政府的行动水平存在很大差异,但该国正在采取措施解决联邦政策的缺陷。根据其现行政策,如果所有其他国家都追求类似的雄心壮志,二氧化碳排放量预计将继续上升,并与 3°C 以上的变暖保持一致。因此,澳大利亚政府有义务设定更雄心勃勃的 2030 年碳减排目标,制定实现其目标的政策,并提供资金支持其他实体提高其可持续性评级。碳核算软件使公司更容易报告环境情况、实现可持续发展目标并遵守排放法规。

根据新西兰环境部的数据,2022 年新西兰的温室气体排放量为 7112 万公吨二氧化碳当量。农业和能源部门占 2022 年总排放量的 85% 以上。二氧化碳占温室气体总排放量的 40%。交通运输、石油精炼、农业和能源等行业的二氧化碳排放量从 2021 年到 2022 年有所下降。作为《巴黎协定》的一部分,新西兰设定了到 2030 年将净排放量减少到 2005 年总排放量的 50% 以下的目标。它还设定了国内减排目标。该国预计将在首份两年期透明度报告中披露其基于《巴黎协定》的目标信息,该报告将于 2024 年 12 月 31 日发布。为了减少碳排放,越来越需要碳核算软件来有效监测、跟踪、分析和报告不同行业公司产生的碳排放量。新西兰政府一直将排放交易体系 (ETS) 作为减少碳排放的主要工具。

根据部署情况,澳大利亚和新西兰的碳核算软件市场分为云和本地。碳核算是准确测量、报告和减少企业温室气体排放的第一步。传统的碳排放测量方法既费力又往往不准确。然而,碳核算软件等新工具和新方法使企业能够比以前更快、更准确地了解、报告和减少排放。基于云的碳核算软件正越来越多地被所有行业采用,因为人们越来越意识到它的好处,并且它易于管理日常运营产生的大量数据。除了提供广泛的存储容量和互联网访问外,基于云的解决方案还具有强大的处理能力,可以快速跟踪碳排放数据。由于各行各业对基于云的解决方案的需求不断增加,碳核算软件供应商也在专注于开发新的和先进的解决方案。在澳大利亚和新西兰,提供基于云的碳核算软件的主要公司包括 Net0、IBM、Pangolin Associates、Avarni、NetNada、CarbonetiX 和 BDO。

Workiva;Avarni;Terrascope;Sumday;ClimateClever;CarbonetiX;GreenHalo;NedNada;Trace;Energy Solution Providers Limited;Opportune;IBM Corporation;SAP SE;Salesforce, Inc.;Microsoft;Diligent Corporation;Cogo;和 Carbon Trail 是本市场研究中介绍的澳大利亚和新西兰碳核算软件市场的主要参与者。

澳大利亚和新西兰的整体碳核算软件市场规模是通过一手资料和二手资料得出的。我们利用内部和外部来源进行了详尽的二手资料研究,以获得与澳大利亚和新西兰碳核算软件市场规模相关的定性和定量信息。该过程还有助于获得有关所有细分市场的市场概况和预测。此外,我们还对行业参与者进行了多次一手资料访谈,以验证数据并获得分析见解。这一流程包括副总裁、业务发展经理、市场情报经理和国家销售经理等行业专家,以及估值专家、研究分析师和关键意见领袖等外部顾问,专门研究澳大利亚和新西兰碳核算软件市场。

1.        Introduction

1.1      The Insight Partners Research Report Guidance

1.2      Market Segmentation

2.        Executive Summary

2.1      Key Insights

3.        Research Methodology

3.1      Secondary Research

3.2      Primary Research

3.2.1       Hypothesis formulation:

3.2.2       Macro-economic factor analysis:

3.2.3       Developing base number:

3.2.4       Data Triangulation:

3.2.5       Country level data:

4.        Australia and New Zealand Carbon Accounting Software Market Landscape

4.1      Overview

4.2      PEST Analysis

4.3      Ecosystem Analysis

4.3.1       Software/Service Providers:

4.3.2       System Integrators:

4.3.3       End Users:

4.3.4       List of Vendors in the Value Chain

5.        Australia and New Zealand Carbon Accounting Software Market – Key Market Dynamics

5.1      Australia and New Zealand Carbon Accounting Software Market – Key Market Dynamics

5.2      Market Drivers

5.2.1       Increasing Regulatory Pressure and Evolving Standards

5.2.2       Rising Focus on Controlling Scope 3 Greenhouse Gas Emissions

5.2.3       Gap Between Stakeholders' Expectations and Companies' Reporting Practices

5.3      Market Restraints

5.3.1       High Implementation Cost:

5.4      Market Opportunities

5.4.1       Increasing Applications of Carbon Accounting Software in Achieving Net Zero Commitments:

5.4.2       Increasing Adoption of Carbon Accounting Software in SMEs:

5.5      Future Trends

5.5.1       Integration with AI and ML:

5.6      Impact of Drivers and Restraints:

6.        Australia and New Zealand Carbon Accounting Software Market Analysis

6.1      Australia and New Zealand Carbon Accounting Software Market Revenue (US$ Million), 2021–2031

6.2      Australia and New Zealand Carbon Accounting Software Market Forecast and Analysis

7.        Australia and New Zealand Carbon Accounting Software Market Analysis – by Deployment

7.1      Cloud

7.1.1       Overview

7.1.2       Cloud: Australia and New Zealand Carbon Accounting Software Market – Revenue and Forecast to 2031 (US$ Million)

7.2      On Premises

7.2.1       Overview

7.2.2       On Premises: Australia and New Zealand Carbon Accounting Software Market – Revenue and Forecast to 2031 (US$ Million)

8.        Australia and New Zealand Carbon Accounting Software Market Analysis – by End Use Industry

8.1      Construction and Infrastructure

8.1.1       Overview

8.1.2       Construction and Infrastructure: Australia and New Zealand Carbon Accounting Software Market – Revenue and Forecast to 2031 (US$ Million)

8.2      Manufacturing

8.2.1       Overview

8.2.2       Manufacturing: Australia and New Zealand Carbon Accounting Software Market – Revenue and Forecast to 2031 (US$ Million)

8.3      Transportation and Logistics

8.3.1       Overview

8.3.2       Transportation and Logistics: Australia and New Zealand Carbon Accounting Software Market – Revenue and Forecast to 2031 (US$ Million)

8.4      Retail Trade

8.4.1       Overview

8.4.2       Retail Trade: Australia and New Zealand Carbon Accounting Software Market – Revenue and Forecast to 2031 (US$ Million)

8.5      Wholesale Trade

8.5.1       Overview

8.5.2       Wholesale Trade: Australia and New Zealand Carbon Accounting Software Market – Revenue and Forecast to 2031 (US$ Million)

9.        Australia and New Zealand Carbon Accounting Software Market – Country Analysis

9.1      Asia Pacific

9.1.1       Australia and New Zealand Carbon Accounting Software Market Revenue and Forecast and Analysis – by Country

9.1.1.1         Australia and New Zealand Carbon Accounting Software Market Revenue and Forecast and Analysis – by Country

9.1.1.2         Australia: Carbon Accounting Software Market – Revenue and Forecast to 2031 (US$ Million)

9.1.1.2.1        Australia: Carbon Accounting Software Market Breakdown by Deployment

9.1.1.2.2        Australia: Carbon Accounting Software Market Breakdown by End Use Industry

9.1.1.3         New Zealand: Carbon Accounting Software Market – Revenue and Forecast to 2031 (US$ Million)

9.1.1.3.1        New Zealand: Carbon Accounting Software Market Breakdown by Deployment

9.1.1.3.2        New Zealand: Carbon Accounting Software Market Breakdown by End Use Industry

10.      Competitive Landscape

10.1    Heat Map Analysis by Key Players

10.2    Company Positioning & Concentration

11.      Industry Landscape

11.1    Overview

11.2    Market Initiative

11.3    Product Development

11.4    Merger and Acquisition

12.      Company Profiles

12.1    NetNada

12.1.1     Key Facts

12.1.2     Business Description

12.1.3     Products and Services

12.1.4     Financial Overview

12.1.5     SWOT Analysis

12.1.6     Key Developments

12.2    Trace

12.2.1     Key Facts

12.2.2     Business Description

12.2.3     Products and Services

12.2.4     Financial Overview

12.2.5     SWOT Analysis

12.2.6     Key Developments

12.3    Workiva, Inc.

12.3.1     Key Facts

12.3.2     Business Description

12.3.3     Products and Services

12.3.4     Financial Overview

12.3.5     SWOT Analysis

12.3.6     Key Developments

12.4    Avarni Pty Ltd

12.4.1     Key Facts

12.4.2     Business Description

12.4.3     Products and Services

12.4.4     Financial Overview

12.4.5     SWOT Analysis

12.4.6     Key Developments

12.5    Terrascope

12.5.1     Key Facts

12.5.2     Business Description

12.5.3     Products and Services

12.5.4     Financial Overview

12.5.5     SWOT Analysis

12.5.6     Key Developments

12.6    CarbonetiX

12.6.1     Key Facts

12.6.2     Business Description

12.6.3     Products and Services

12.6.4     Financial Overview

12.6.5     SWOT Analysis

12.6.6     Key Developments

12.7    GreenHalo

12.7.1     Key Facts

12.7.2     Business Description

12.7.3     Products and Services

12.7.4     Financial Overview

12.7.5     SWOT Analysis

12.7.6     Key Developments

12.8    Energy Solution Providers Limited

12.8.1     Key Facts

12.8.2     Business Description

12.8.3     Products and Services

12.8.4     Financial Overview

12.8.5     SWOT Analysis

12.8.6     Key Developments

12.9    Cogo

12.9.1     Key Facts

12.9.2     Business Description

12.9.3     Products and Services

12.9.4     Financial Overview

12.9.5     SWOT Analysis

12.9.6     Key Developments

12.10  CarbonTrail Limited

12.10.1   Key Facts

12.10.2   Business Description

12.10.3   Products and Services

12.10.4   Financial Overview

12.10.5   SWOT Analysis

12.10.6   Key Developments

12.11  Opportune

12.11.1   Key Facts

12.11.2   Business Description

12.11.3   Products and Services

12.11.4   Financial Overview

12.11.5   SWOT Analysis

12.11.6   Key Developments

12.12  Sumday

12.12.1   Key Facts

12.12.2   Business Description

12.12.3   Products and Services

12.12.4   Financial Overview

12.12.5   SWOT Analysis

12.12.6   Key Developments

12.13  ClimateClever PTY LTD

12.13.1   Key Facts

12.13.2   Business Description

12.13.3   Products and Services

12.13.4   Financial Overview

12.13.5   SWOT Analysis

12.13.6   Key Developments

12.14  International Business Machines Corp

12.14.1   Key Facts

12.14.2   Business Description

12.14.3   Products and Services

12.14.4   Financial Overview

12.14.5   SWOT Analysis

12.14.6   Key Developments

12.15  SAP SE

12.15.1   Key Facts

12.15.2   Business Description

12.15.3   Products and Services

12.15.4   Financial Overview

12.15.5   SWOT Analysis

12.15.6   Key Developments

12.16  Salesforce Inc

12.16.1   Key Facts

12.16.2   Business Description

12.16.3   Products and Services

12.16.4   Financial Overview

12.16.5   SWOT Analysis

12.16.6   Key Developments

12.17  Microsoft Corp

12.17.1   Key Facts

12.17.2   Business Description

12.17.3   Products and Services

12.17.4   Financial Overview

12.17.5   SWOT Analysis

12.17.6   Key Developments

12.18  Diligent Corporation.

12.18.1   Key Facts

12.18.2   Business Description

12.18.3   Products and Services

12.18.4   Financial Overview

12.18.5   SWOT Analysis

12.18.6   Key Developments

13.      Appendix

13.1    Word Index

13.2    About The Insight Partners

List of Tables

Table 1.          Australia and New Zealand Carbon Accounting Software Market Segmentation

Table 2.          List of Vendors

Table 3.          Australia and New Zealand Carbon Accounting Software Market – Revenue and Forecast to 2031 (US$ Million)

Table 4.          Australia and New Zealand Carbon Accounting Software Market – Revenue and Forecast to 2031 (US$ Million) – by Deployment

Table 5.          Australia and New Zealand Carbon Accounting Software Market – Revenue and Forecast to 2031 (US$ Million) – by End Use Industry

Table 6.          Australia and New Zealand Carbon Accounting Software Market – Revenue and Forecast to 2031 (US$ Million) – by Country

Table 7.          Australia: Carbon Accounting Software Market – Revenue and Forecast to 2031 (US$ Million) – by Deployment

Table 8.          Australia: Carbon Accounting Software Market – Revenue and Forecast to 2031 (US$ Million) – by End Use Industry

Table 9.          New Zealand: Carbon Accounting Software Market – Revenue and Forecast to 2031 (US$ Million) – by Deployment

Table 10.        New Zealand: Carbon Accounting Software Market – Revenue and Forecast to 2031 (US$ Million) – by End Use Industry

Table 11.        Company Positioning & Concentration

Table 12.        List of Abbreviation

List of Figures

Figure 1.         Australia and New Zealand Carbon Accounting Software Market Segmentation, by Country

Figure 2.         PEST Analysis

Figure 3.         Impact Analysis of Drivers and Restraints

Figure 4.         Australia and New Zealand Carbon Accounting Software Market Revenue (US$ Million), 2021–2031

Figure 5.         Australia and New Zealand Carbon Accounting Software Market Share (%) – by Deployment, 2023 and 2031

Figure 6.         Cloud: Australia and New Zealand Carbon Accounting Software Market – Revenue and Forecast to 2031  (US$ Million)

Figure 7.         On Premises: Australia and New Zealand Carbon Accounting Software Market – Revenue and Forecast to 2031 (US$ Million)

Figure 8.         Australia and New Zealand Carbon Accounting Software Market Share (%) – by End Use Industry, 2023 and 2031

Figure 9.         Construction and Infrastructure: Australia and New Zealand Carbon Accounting Software Market – Revenue and Forecast to 2031 (US$ Million)

Figure 10.      Manufacturing: Australia and New Zealand Carbon Accounting Software Market – Revenue and Forecast to 2031 (US$ Million)

Figure 11.      Transportation and Logistics: Australia and New Zealand Carbon Accounting Software Market – Revenue and Forecast to 2031 (US$ Million)

Figure 12.      Retail Trade: Australia and New Zealand Carbon Accounting Software Market – Revenue and Forecast to 2031 (US$ Million)

Figure 13.      Wholesale Trade: Australia and New Zealand Carbon Accounting Software Market – Revenue and Forecast to 2031 (US$ Million)

Figure 14.      Australia and New Zealand Carbon Accounting Software Market Breakdown by Key Countries, 2023 and 2031 (%)

Figure 15.      Australia: Carbon Accounting Software Market – Revenue and Forecast to 2031 (US$ Million)

Figure 16.      New Zealand: Carbon Accounting Software Market – Revenue and Forecast to 2031 (US$ Million)

Figure 17.      Heat Map Analysis by Key Players

  • Workiva
  • Avarni
  • Terrascope
  • Sumday
  • ClimateClever
  • CarbonetiX
  • GreenHalo
  • NedNada
  • Trace
  • Energy Solution Providers Limite
  • Opportune
  • IBM Corporation
  • SAP SE
  • Salesforce, Inc.
  • Microsoft
  • Diligent Corporation
  • Cogo
  • Carbon Trail
  • Save and reduce time carrying out entry-level research by identifying the growth, size, leading players, and segments in the Australia and New Zealand carbon accounting software market
  • Highlights key business priorities in order to assist companies to realign their business strategies
  • The key findings and recommendations such as specific country and segmental insight highlights crucial progressive industry trends in the Australia and New Zealand carbon accounting software market, thereby allowing players across the value chain to develop effective long-term strategies
  • Develop/modify business expansion plans by using substantial growth offering developed and emerging markets
  • Scrutinize in-depth market trends and outlook coupled with the factors driving the market, as well as those hindering it
  • Enhance the decision-making process by understanding the strategies that underpin commercial interest with respect to client products, segmentation, pricing, and distribution
Report Code
Full Name
Country Name
Email Id
Phone Number
Job Title
Company
Requirement

Note : Your data will never be shared with third parties, however, we may send you information from time to time about our products that may be of interest to you. By submitting your details, you agree to be contacted by us. You may contact us at any time to opt-out.


Purchase Options
Single User License
$3550
$2485
Site License
$4550
$3185
Enterprise License
$5550
$3885