亚太香草精市场预测至 2030 年 - 区域分析 - 按形式(粉末和液体)、类别(有机和传统)和应用(食品和饮料 [烘焙和糖果、乳制品和冷冻甜点、饮料、甜味和咸味小吃等]、个人护理等)

BMIRE00030149 | Pages: 75 | Food and Beverages | May 2024 | Type: Regional | Status: Published
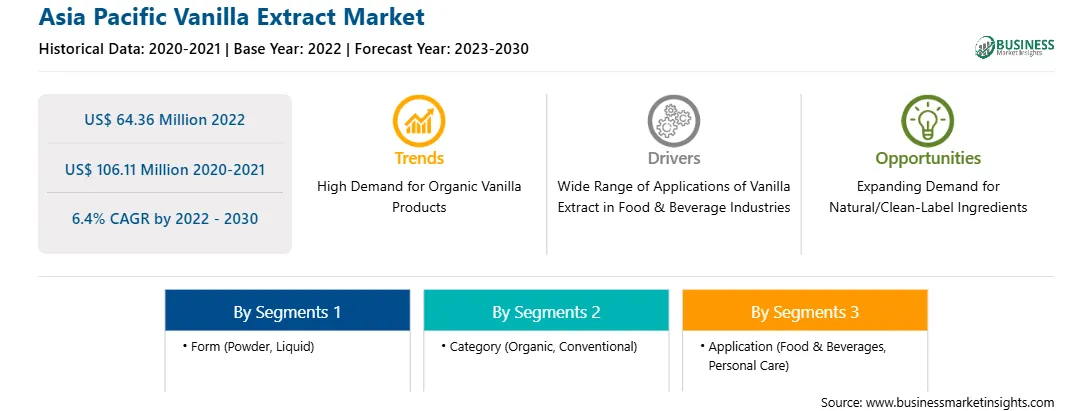
2022 年亚太香草精市场价值为 6436 万美元,预计到 2030 年将达到 1.0611 亿美元;预计 2022 年至 2030 年的复合年增长率为 6.4%。

对天然/清洁标签成分的需求不断扩大,推动亚太香草精市场发展

世界各地的消费者都倾向于采用更健康的生活方式。天然香料可以满足消费者的饮食要求。菜单上的说明和食品包装上的标签对消费者的偏好有很大影响。清洁标签产品越来越受欢迎,因为消费者更喜欢 100% 天然产品,不含防腐剂、人工色素、香料等合成成分。

消费者需求和国际法规促使各种应用行业寻求来自天然来源的活性成分,以生产安全和可持续的产品。因此,香草精制造商扩大了其产品组合,以满足对天然和清洁标签成分日益增长的需求。

因此,对天然和清洁标签成分的需求不断增长,预计将在预测期内为亚太香草精市场提供丰厚的机会。

亚太香草精市场概览

亚太其他地区的香草精市场分为新加坡、印度尼西亚、泰国、马来西亚和新西兰等。由于消费者对天然和有机食品的日益普及,预计这些国家的香草精市场将显著增长。新加坡、印度尼西亚、泰国和马来西亚是少数以芳香疗法闻名的国家。这些国家的许多水疗中心、美容诊所、按摩中心和芳香疗法中心都使用含有香草精的精油,具有治疗、保湿和舒缓的功效。此外,天然排毒清洁剂和消毒剂的日益普及预计将加速对香草精的需求。

亚太香草精市场收入及预测至 2030 年(百万美元)

亚太香草精市场细分

亚太香草精市场根据形式、类别、应用和国家进行细分。根据形式,亚太香草精市场分为粉末和液体。液体部分在 2022 年占据了更大的市场份额。

就类别而言,亚太香草精市场分为有机和传统。传统部分在 2022 年占据了更大的市场份额。

按应用,亚太香草精市场分为食品和饮料、个人护理和其他。食品和饮料部分在 2022 年占据了最大的市场份额。此外,食品和饮料部分分为烘焙和糖果、乳制品和冷冻甜点、饮料、甜味和咸味小吃等。

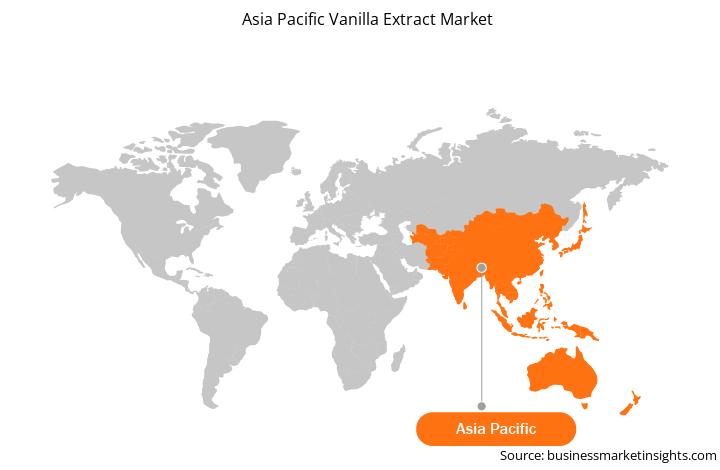
根据国家/地区,亚太香草精市场分为中国、日本、印度、澳大利亚、韩国、东南亚和亚太其他地区。2022 年,亚太其他地区占据了亚太香草精市场份额的主导地位。

Prova SAS、Tharakan and Co、Natural Vanilla Pty Ltd、Kerry Group Plc、Archer-Daniels-Midland Co 和 Synergy Flavors Inc 是亚太香草精市场的一些领先企业。

1.           Introduction

1.1       The Insight Partners Research Report Guidance

1.2       Market Segmentation

2.           Executive Summary

2.1       Key Market Insights

2.2       Market Attractiveness

3.           Research Methodology

3.1       Coverage

3.2       Secondary Research

3.3       Primary Research

4.           Asia Pacific Vanilla Extract Market Landscape

4.1       Overview

4.2       Porter's Five Forces Analysis

4.2.1         Bargaining Power of Suppliers

4.2.2         Bargaining Power of Buyers

4.2.3         Threat of New Entrants

4.2.4         Competitive Rivalry

4.2.5         Threat of Substitutes

4.3       Ecosystem Analysis

4.3.1         Raw Material Suppliers

4.3.2         Manufacturing Process

4.3.3         Distributors or Suppliers

4.3.4         Application

5.           Asia Pacific Vanilla Extract Market - Key Industry Dynamics

5.1       Market Drivers

5.1.1         Wide Range of Applications of Vanilla Extract in Food & Beverage Industries

5.1.2         Rising Adoption of Vanilla Extract in Personal Care

5.2       Market Restraints

5.2.1         Price Volatility and Supply Shortage

5.3       Market Opportunities

5.3.1         Expanding Demand for Natural/Clean-Label Ingredients

5.4       Future Trends

5.4.1         High Demand for Organic Vanilla Products

5.5       Impact Analysis of Drivers and Restraints

6.           Vanilla Extract Market - Asia Pacific Market Analysis

6.1       Asia Pacific Vanilla Extract Market Overview

6.2       Asia Pacific Vanilla Extract Market Revenue (US$ Thousand), 2020 – 2030

6.3       Vanilla Extract Market Forecast and Analysis

7.           Asia Pacific Vanilla Extract Market Analysis – Form

7.1       Liquid

7.1.1         Overview

7.1.2         Liquid Market Revenue and Forecast to 2030 (US$ Thousand)

7.2       Powder

7.2.1         Overview

7.2.2         Powder Market Revenue and Forecast to 2030 (US$ Thousand)

8.           Asia Pacific Vanilla Extract Market Analysis – Category

8.1       Organic

8.1.1         Overview

8.1.2         Organic Market Revenue and Forecast to 2030 (US$ Thousand)

8.2       Conventional

8.2.1         Overview

8.2.2         Conventional Market Revenue and Forecast to 2030 (US$ Thousand)

9.           Asia Pacific Vanilla Extract Market Analysis – Application

9.1       Food & Beverages

9.1.1         Overview

9.1.2         Food & Beverages Market Revenue and Forecast to 2030 (US$ Thousand)

9.1.2.1            Bakery & Confectionery

9.1.2.1.1           Overview

9.1.2.1.2           Bakery & Confectionery Market Revenue and Forecast to 2030 (US$ Thousand)

9.1.2.2            Dairy & Frozen Desserts

9.1.2.2.1           Overview

9.1.2.2.2           Dairy & Frozen Desserts Market Revenue and Forecast to 2030 (US$ Thousand)

9.1.2.3            Beverages

9.1.2.3.1           Overview

9.1.2.3.2           Beverages Market Revenue and Forecast to 2030 (US$ Thousand)

9.1.2.4            Sweet & Savory Snacks

9.1.2.4.1           Overview

9.1.2.4.2           Sweet & Savory Snacks Market Revenue and Forecast to 2030 (US$ Thousand)

9.1.2.5            Others

9.1.2.5.1           Overview

9.1.2.5.2           Others Market Revenue and Forecast to 2030 (US$ Thousand)

9.2       Personal Care

9.2.1         Overview

9.2.2         Personal Care Market Revenue and Forecast to 2030 (US$ Thousand)

9.3       Others

9.3.1         Overview

9.3.2         Others Market Revenue and Forecast to 2030 (US$ Thousand)

10.        Asia Pacific Vanilla Extract Market - Country Analysis

10.1     Asia Pacific

10.1.1       Asia Pacific Vanilla Extract Market Revenue and Forecasts and Analysis - By Countries

10.1.1.1          Asia Pacific Vanilla Extract Market Breakdown by Country

10.1.1.2          China Vanilla Extract Market Revenue and Forecasts to 2030 (US$ Thousand)

10.1.1.2.1        China Vanilla Extract Market Breakdown by Form

10.1.1.2.2        China Vanilla Extract Market Breakdown by Category

10.1.1.2.3        China Vanilla Extract Market Breakdown by Application

10.1.1.3          India Vanilla Extract Market Revenue and Forecasts to 2030 (US$ Thousand)

10.1.1.3.1        India Vanilla Extract Market Breakdown by Form

10.1.1.3.2        India Vanilla Extract Market Breakdown by Category

10.1.1.3.3        India Vanilla Extract Market Breakdown by Application

10.1.1.4          Japan Vanilla Extract Market Revenue and Forecasts to 2030 (US$ Thousand)

10.1.1.4.1        Japan Vanilla Extract Market Breakdown by Form

10.1.1.4.2        Japan Vanilla Extract Market Breakdown by Category

10.1.1.4.3        Japan Vanilla Extract Market Breakdown by Application

10.1.1.5          Australia Vanilla Extract Market Revenue and Forecasts to 2030 (US$ Thousand)

10.1.1.5.1        Australia Vanilla Extract Market Breakdown by Form

10.1.1.5.2        Australia Vanilla Extract Market Breakdown by Category

10.1.1.5.3        Australia Vanilla Extract Market Breakdown by Application

10.1.1.6          South Korea Vanilla Extract Market Revenue and Forecasts to 2030 (US$ Thousand)

10.1.1.6.1        South Korea Vanilla Extract Market Breakdown by Form

10.1.1.6.2        South Korea Vanilla Extract Market Breakdown by Category

10.1.1.6.3        South Korea Vanilla Extract Market Breakdown by Application

10.1.1.7          Southeast Asia Vanilla Extract Market Revenue and Forecasts to 2030 (US$ Thousand)

10.1.1.7.1        Southeast Asia Vanilla Extract Market Breakdown by Form

10.1.1.7.2        Southeast Asia Vanilla Extract Market Breakdown by Category

10.1.1.7.3        Southeast Asia Vanilla Extract Market Breakdown by Application

10.1.1.8          Rest of Asia Pacific Vanilla Extract Market Revenue and Forecasts to 2030 (US$ Thousand)

10.1.1.8.1        Rest of Asia Pacific Vanilla Extract Market Breakdown by Form

10.1.1.8.2        Rest of Asia Pacific Vanilla Extract Market Breakdown by Category

10.1.1.8.3        Rest of Asia Pacific Vanilla Extract Market Breakdown by Application

11.        Company Profiles

11.1     Prova SAS

11.1.1       Key Facts

11.1.2       Business Description

11.1.3       Products and Services

11.1.4       Financial Overview

11.1.5       SWOT Analysis

11.1.6       Key Developments

11.2     Tharakan and Co

11.2.1       Key Facts

11.2.2       Business Description

11.2.3       Products and Services

11.2.4       Financial Overview

11.2.5       SWOT Analysis

11.2.6       Key Developments

11.3     Natural Vanilla Pty Ltd

11.3.1       Key Facts

11.3.2       Business Description

11.3.3       Products and Services

11.3.4       Financial Overview

11.3.5       SWOT Analysis

11.3.6       Key Developments

11.4     Kerry Group Plc

11.4.1       Key Facts

11.4.2       Business Description

11.4.3       Products and Services

11.4.4       Financial Overview

11.4.5       SWOT Analysis

11.4.6       Key Developments

11.5     Archer-Daniels-Midland Co

11.5.1       Key Facts

11.5.2       Business Description

11.5.3       Products and Services

11.5.4       Financial Overview

11.5.5       SWOT Analysis

11.5.6       Key Developments

11.6     Synergy Flavors Inc

11.6.1       Key Facts

11.6.2       Business Description

11.6.3       Products and Services

11.6.4       Financial Overview

11.6.5       SWOT Analysis

11.6.6       Key Developments

12.        Appendix


List of Tables

Table 1.             Vanilla Extract Market Segmentation

Table 2.             Vanilla Extract Market Revenue and Forecasts to 2030 (US$ Thousand)

Table 3.             Asia Pacific Vanilla Extract Market Revenue and Forecasts to 2030 (US$ Thousand) – Form

Table 4.             Asia Pacific Vanilla Extract Market Revenue and Forecasts to 2030 (US$ Thousand) – Category

Table 5.             Asia Pacific Vanilla Extract Market Revenue and Forecasts to 2030 (US$ Thousand) – Application

Table 6.             China Vanilla Extract Market Revenue and Forecasts to 2030 (US$ Thousand) – By Form

Table 7.             China Vanilla Extract Market Revenue and Forecasts to 2030 (US$ Thousand) – By Category

Table 8.             China Vanilla Extract Market Revenue and Forecasts to 2030 (US$ Thousand) – By Application

Table 9.             India Vanilla Extract Market Revenue and Forecasts to 2030 (US$ Thousand) – By Form

Table 10.          India Vanilla Extract Market Revenue and Forecasts to 2030 (US$ Thousand) – By Category

Table 11.          India Vanilla Extract Market Revenue and Forecasts to 2030 (US$ Thousand) – By Application

Table 12.          Japan Vanilla Extract Market Revenue and Forecasts to 2030 (US$ Thousand) – By Form

Table 13.          Japan Vanilla Extract Market Revenue and Forecasts to 2030 (US$ Thousand) – By Category

Table 14.          Japan Vanilla Extract Market Revenue and Forecasts to 2030 (US$ Thousand) – By Application

Table 15.          Australia Vanilla Extract Market Revenue and Forecasts to 2030 (US$ Thousand) – By Form

Table 16.          Australia Vanilla Extract Market Revenue and Forecasts to 2030 (US$ Thousand) – By Category

Table 17.          Australia Vanilla Extract Market Revenue and Forecasts to 2030 (US$ Thousand) – By Application

Table 18.          South Korea Vanilla Extract Market Revenue and Forecasts to 2030 (US$ Thousand) – By Form

Table 19.          South Korea Vanilla Extract Market Revenue and Forecasts to 2030 (US$ Thousand) – By Category

Table 20.          South Korea Vanilla Extract Market Revenue and Forecasts to 2030 (US$ Thousand) – By Application

Table 21.          Southeast Asia Vanilla Extract Market Revenue and Forecasts to 2030 (US$ Thousand) – By Form

Table 22.          Southeast Asia Vanilla Extract Market Revenue and Forecasts to 2030 (US$ Thousand) – By Category

Table 23.          Southeast Asia Vanilla Extract Market Revenue and Forecasts to 2030 (US$ Thousand) – By Application

Table 24.          Rest of Asia Pacific Vanilla Extract Market Revenue and Forecasts to 2030 (US$ Thousand) – By Form

Table 25.          Rest of Asia Pacific Vanilla Extract Market Revenue and Forecasts to 2030 (US$ Thousand) – By Category

Table 26.          Rest of Asia Pacific Vanilla Extract Market Revenue and Forecasts to 2030 (US$ Thousand) – By Application


List of Figures

Figure 1.           Vanilla Extract Market Segmentation, By Country

Figure 2.           Porter's Five Forces Analysis

Figure 3.           Ecosystem: Vanilla Extract Market

Figure 4.           Vanilla Extract Market - Key Industry Dynamics

Figure 5.           Asia Pacific Vanilla Extract Market Impact Analysis of Drivers and Restraints

Figure 6.           Asia Pacific Vanilla Extract Market Revenue (US$ Thousand), 2020 – 2030

Figure 7.           Asia Pacific Vanilla Extract Market Share (%) – Form, 2022 and 2030

Figure 8.           Liquid Market Revenue and Forecasts to 2030 (US$ Thousand)

Figure 9.           Powder Market Revenue and Forecasts to 2030 (US$ Thousand)

Figure 10.        Asia Pacific Vanilla Extract Market Share (%) –Category, 2022 and 2030

Figure 11.        Organic Market Revenue and Forecasts to 2030 (US$ Thousand)

Figure 12.        Conventional Market Revenue and Forecasts to 2030 (US$ Thousand)

Figure 13.        Asia Pacific Vanilla Extract Market Share (%) –Application, 2022 and 2030

Figure 14.        Food & Beverages Market Revenue and Forecasts to 2030 (US$ Thousand)

Figure 15.        Bakery & Confectionery Market Revenue and Forecasts to 2030 (US$ Thousand)

Figure 16.        Dairy & Frozen Desserts Market Revenue and Forecasts to 2030 (US$ Thousand)

Figure 17.        Beverages Market Revenue and Forecasts to 2030 (US$ Thousand)

Figure 18.        Sweet & Savory Snacks Market Revenue and Forecasts to 2030 (US$ Thousand)

Figure 19.        Others Market Revenue and Forecasts to 2030 (US$ Thousand)

Figure 20.        Personal Care Market Revenue and Forecasts to 2030 (US$ Thousand)

Figure 21.        Others Market Revenue and Forecasts to 2030 (US$ Thousand)

Figure 22.        Asia Pacific Vanilla Extract Market, by Key Countries – Revenue (2022) (US$ Thousand)

Figure 23.        Asia Pacific Vanilla Extract Market Breakdown by Key Countries, 2022 and 2030 (%)

Figure 24.        China Vanilla Extract Market Revenue and Forecasts to 2030 (US$ Thousand)

Figure 25.        India Vanilla Extract Market Revenue and Forecasts to 2030 (US$ Thousand)

Figure 26.        Japan Vanilla Extract Market Revenue and Forecasts to 2030 (US$ Thousand)

Figure 27.        Australia Vanilla Extract Market Revenue and Forecasts to 2030 (US$ Thousand)

Figure 28.        South Korea Vanilla Extract Market Revenue and Forecasts to 2030 (US$ Thousand)

Figure 29.        Southeast Asia Vanilla Extract Market Revenue and Forecasts to 2030 (US$ Thousand)

Figure 30.        Rest of Asia Pacific Vanilla Extract Market Revenue and Forecasts to 2030 (US$ Thousand)

1. Prova SAS

2. Tharakan and Co

3. Natural Vanilla Pty Ltd

4. Kerry Group Plc

5. Archer-Daniels-Midland Co

6. Synergy Flavors Inc


  • Save and reduce time carrying out entry-level research by identifying the growth, size, leading players, and segments in the Asia Pacific vanilla extract market.
  • Highlights key business priorities in order to assist companies to realign their business strategies.
  • The key findings and recommendations highlight crucial progressive industry trends in the Asia Pacific vanilla extract market, thereby allowing players across the value chain to develop effective long-term strategies.
  • Develop/modify business expansion plans by using substantial growth offering developed and emerging markets.
  • Scrutinize in-depth Asia Pacific market trends and outlook coupled with the factors driving the Asia Pacific vanilla extract market, as well as those hindering it.
  • Enhance the decision-making process by understanding the strategies that underpin commercial interest with respect to client products, segmentation, pricing, and distribution.
Report Code
Full Name
Country Name
Email Id
Phone Number
Job Title
Company
Requirement

Note : Your data will never be shared with third parties, however, we may send you information from time to time about our products that may be of interest to you. By submitting your details, you agree to be contacted by us. You may contact us at any time to opt-out.


Purchase Options
Single User License
$3550
$2840
Site License
$4550
$3640
Enterprise License
$5550
$4440