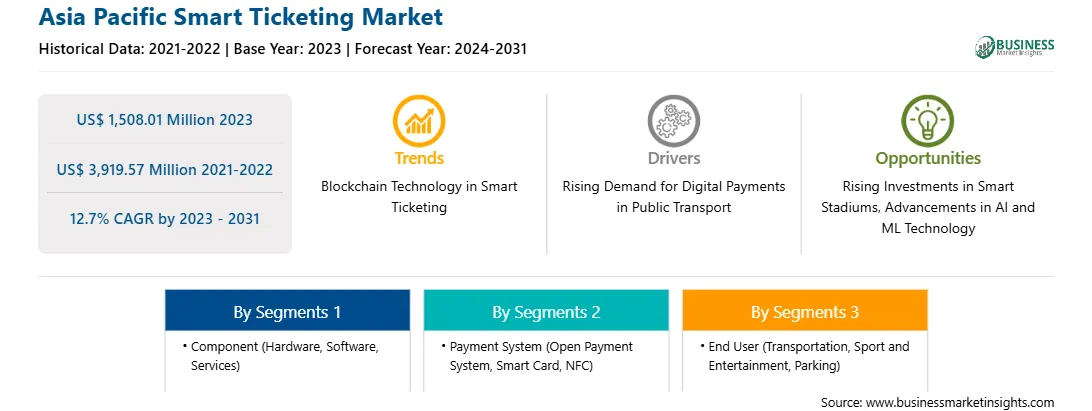
2031 年亚太地区智能票务市场预测 – 区域分析 – 按组件(硬件、软件和服务)、支付系统(开放支付系统、智能卡和 NFC)和最终用户(交通、体育和娱乐、停车等)划分
No. of Pages: 98 | Report Code: BMIRE00031058 | Category: Electronics and Semiconductor
No. of Pages: 98 | Report Code: BMIRE00031058 | Category: Electronics and Semiconductor
Strategic insights for Asia Pacific Smart Ticketing involve closely monitoring industry trends, consumer behaviours, and competitor actions to identify opportunities for growth. By leveraging data analytics, businesses can anticipate market shifts and make informed decisions that align with evolving customer needs. Understanding these dynamics helps companies adjust their strategies proactively, enhance customer engagement, and strengthen their competitive edge. Building strong relationships with stakeholders and staying agile in response to changes ensures long-term success in any market.
| Report Attribute | Details |
|---|---|
| Market size in 2023 | US$ 1,508.01 Million |
| Market Size by 2031 | US$ 3,919.57 Million |
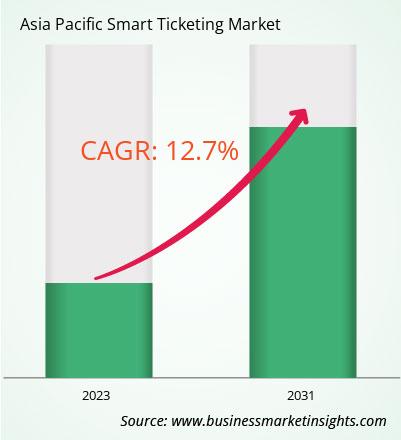
| Global CAGR (2023 - 2031) | 12.7% |
| Historical Data | 2021-2022 |
| Forecast period | 2024-2031 |
| Segments Covered |
By 组件
|
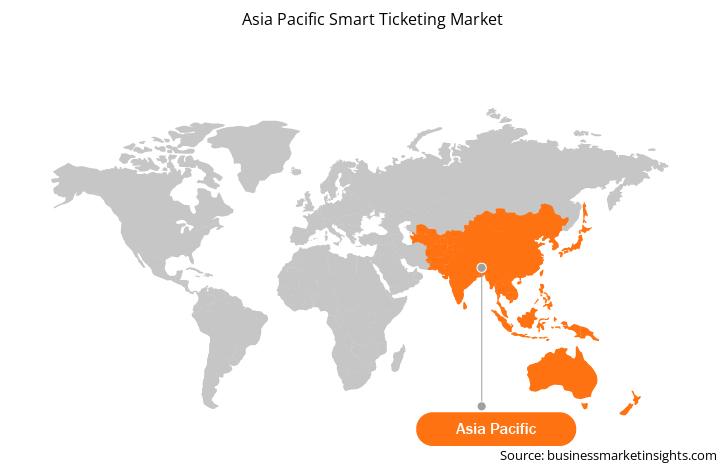
| Regions and Countries Covered | 亚太地区
|
| Market leaders and key company profiles |
The regional scope of Asia Pacific Smart Ticketing refers to the geographical area in which a business operates and competes. Understanding regional nuances, such as local consumer preferences, economic conditions, and regulatory environments, is crucial for tailoring strategies to specific markets. Businesses can expand their reach by identifying underserved regions or adapting their offerings to meet regional demands. A clear regional focus allows for more effective resource allocation, targeted marketing, and better positioning against local competitors, ultimately driving growth in those specific areas.
The Asia Pacific Smart Ticketing Market is valued at US$ 1,508.01 Million in 2023, it is projected to reach US$ 3,919.57 Million by 2031.
As per our report Asia Pacific Smart Ticketing Market, the market size is valued at US$ 1,508.01 Million in 2023, projecting it to reach US$ 3,919.57 Million by 2031. This translates to a CAGR of approximately 12.7% during the forecast period.
The Asia Pacific Smart Ticketing Market report typically cover these key segments-
The historic period, base year, and forecast period can vary slightly depending on the specific market research report. However, for the Asia Pacific Smart Ticketing Market report:
The Asia Pacific Smart Ticketing Market is populated by several key players, each contributing to its growth and innovation. Some of the major players include:
The Asia Pacific Smart Ticketing Market report is valuable for diverse stakeholders, including:
Essentially, anyone involved in or considering involvement in the Asia Pacific Smart Ticketing Market value chain can benefit from the information contained in a comprehensive market report.
Office No. 1011, First floor, Farena Corporate Park, Magarpatta-Mundhwa road, Pune - 411028, Maharashtra, India
US:+16467917070
sales@businessmarketinsights.com


 Get Free Sample For Asia Pacific Smart Ticketing Market
