亚太地区钪市场预测至 2031 年 - 区域分析 - 按衍生物(氧化物、碘化物、合金、氧化锆等)和应用(航空航天和国防、固体氧化物燃料电池、电子、陶瓷、照明、核应用、3D 打印等)

BMIRE00030890 | Pages: 93 | Chemicals and Materials | Oct 2024 | Type: Regional | Status: Published

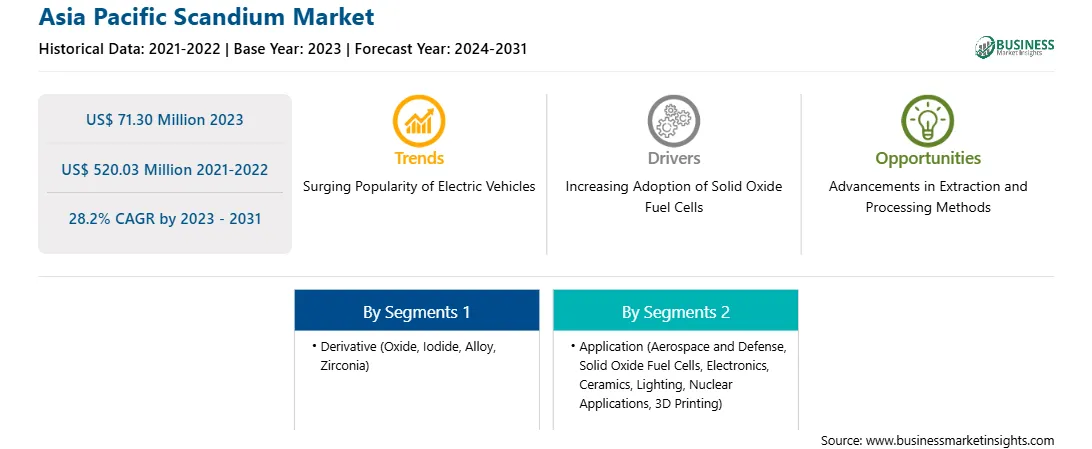
2023 年亚太地区钪市场价值为 7130 万美元,预计到 2031 年将达到 5.2003 亿美元;预计 2023 年至 2031 年的复合年增长率为 28.2%。

提取和加工方法的进步燃料电池促进了亚太地区钪市场的发展

钪提取的有限供应和高成本对其大规模商业化构成了挑战。然而,正在进行的提取技术研究和开发正在为更高效、更具成本效益的生产方法铺平道路。正在开发新型提取技术,例如溶剂萃取、离子交换和创新浸出工艺,以提高从各种来源(包括矿石、工业废物流和其他采矿作业的副产品)中回收钪的能力。这些进步提高了钪的产量,同时降低了生产过程中的能源消耗、环境影响和成本。色谱法和结晶法等创新精炼技术能够生产出具有精确规格和定制特性的钪化合物。因此,加工技术的进步使钪产品的纯度和质量得到提高,有可能扩大其在航空航天、国防、电子和清洁能源等高科技行业的应用范围。

对钪替代来源的研究,例如回收报废产品和二次材料(如钨或钒钛提取工艺),为钪市场提供了额外的增长途径。回收计划有助于节约资源和减少浪费。它们提供了可持续和可靠的钪供应,从而减轻了对主要来源的依赖以及市场波动对钪生产和使用的影响。此外,行业参与者、研究机构和政府机构之间的战略合作和伙伴关系对于推动创新和促进先进钪技术的商业化至关重要。通过汇集资源、专业知识和基础设施,利益相关者可以加速提取和加工解决方案的开发和部署。因此,提取和加工方法的进步为钪市场带来了巨大的增长机会。

亚太地区钪市场概览

亚太地区快速的经济发展和工业化推动了对高性能材料的需求,以支持基础设施发展、城市化和其他技术进步。亚太地区拥有世界上一些最大和增长最快的航空航天和汽车工业,这两个行业都是含钪轻质高强度合金的主要消费者。这些合金在飞机部件、汽车零件和结构材料等应用中特别有价值,在这些应用中,减轻重量同时保持性能对于提高最终产品的燃油效率、续航里程和安全标准至关重要。此外,亚太地区的电子行业对高性能半导体的需求巨大。根据半导体行业协会的一项研究,全球约 75% 的半导体产能位于东亚。在该地区建设制造工厂可能会使半导体公司受益,成本节省高达 25-50%。钪的独特性质使其成为生产高速节能电子设备(如计算机、智能手机和数据中心)的理想材料。

此外,由于消费者对智能手机、平板电脑、笔记本电脑和其他电子设备的需求不断增长,亚太地区的电子行业正在经历指数级增长。含钪材料在电子制造中起着至关重要的作用,特别是在半导体生产中,氧化钪被用作掺杂剂来提高半导体器件的性能和可靠性。此外,钪基材料还用于先进的显示技术,例如 OLED 和 LED 显示器,它们广泛用于电视、智能手机和汽车显示器。此外,中国、日本和韩国等国的政府正在积极支持新技术的研究和开发,特别是那些以绿色能源和航空航天为中心的技术。钪的独特性质使其成为这些行业的主要材料,从而导致需求增加。

亚太地区钪市场收入及预测至 2031 年(百万美元)

亚太地区钪市场细分

亚太地区钪市场分为类型、应用和国家。

根据类型,亚太地区钪市场分为氧化物、碘化物、合金、氧化锆等。氧化物部分在 2023 年占据最大市场份额。

按应用,亚太地区钪市场分为航空航天和国防、固体氧化物燃料电池、电子、陶瓷、照明、核应用、3D 打印等。其他部分在 2023 年占据最大市场份额。

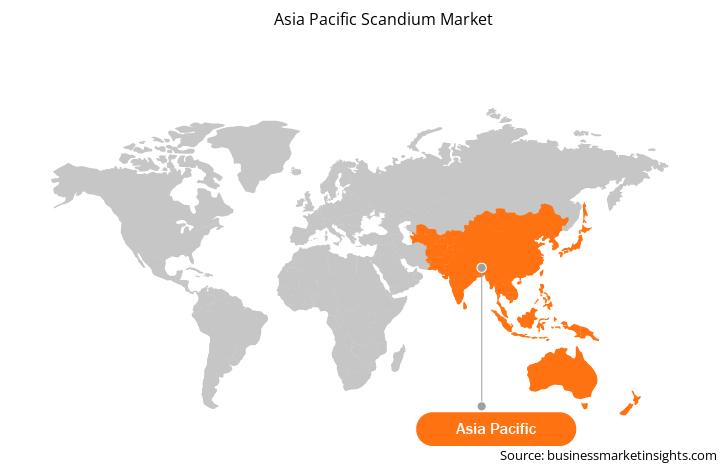
按国家/地区,亚太地区钪市场分为澳大利亚、中国、印度、日本、韩国和亚太地区其他地区。 2023 年,中国占据了亚太地区钪市场的主导份额。

American Elements Inc、Strategic Metal Investments Ltd、Rio Tinto Ltd、Scandium International Mining Corporation、Otto Chemie Pvt. Ltd 和湖南东方钪有限公司是亚太地区钪市场的一些领先公司。

TABLE OF CONTENTS


1. Introduction

1.1 The Insight Partners Research Report Guidance

1.2 Asia Pacific Market Segmentation

2. Executive Summary

2.1 Key Insights

2.2 Market Attractiveness

3. Research Methodology

3.1 Coverage

3.2 Secondary Research

3.3 Primary Research

4. Asia Pacific Scandium Market Landscape

4.1 Overview

4.2 Porter's Five Forces Analysis

4.2.1 Bargaining Power of Buyers

4.2.2 Bargaining Power of Suppliers

4.2.3 Threat of New Entrants

4.2.4 Threat of Substitutes

4.2.5 Intensity of Competitive Rivalry

4.3 Ecosystem Analysis

4.3.1 Mining

4.3.2 Manufacturers

4.3.3 Distributors/Suppliers

4.3.4 End Users

4.3.5 List of Vendors in the Value Chain

5. Asia Pacific Scandium Market - Key Market Dynamics

5.1 Market Drivers

5.1.1 Increasing Adoption of Solid Oxide Fuel Cells

5.1.2 Burgeoning Demand for Aluminum-Scandium Alloys in Aerospace & Defense Sector

5.1.3 Rising Demand from 3D Printing Industry

5.2 Market Restraints

5.2.1 High Cost

5.3 Market Opportunities

5.3.1 Advancements in Extraction and Processing Methods

5.4 Future Trends

5.4.1 Surging Popularity of Electric Vehicles

5.5 Impact of Drivers and Restraints:

6. Scandium Market - Asia Pacific Market Analysis

6.1 Asia Pacific Scandium Market Volume (Tons), 2020-2031

6.2 Scandium Market Volume Forecast and Analysis (Tons)

6.3 Scandium Market Revenue (US$ Million), 2020-2031

6.4 Scandium Market Revenue Forecast and Analysis (U$ Million)

7. Asia Pacific Scandium Market Volume and Revenue Analysis - by Derivative

7.1 Oxide

7.1.1 Overview

7.1.2 Oxide: Scandium Market - Volume and Forecast to 2031 (Tons)

7.1.3 Oxide: Scandium Market - Revenue and Forecast to 2031 (US$ Million)

7.2 Iodide

7.2.1 Overview

7.2.2 Iodide: Scandium Market - Volume and Forecast to 2031 (Tons)

7.2.3 Iodide: Scandium Market - Revenue and Forecast to 2031 (US$ Million)

7.3 Alloy

7.3.1 Overview

7.3.2 Alloy: Scandium Market - Volume and Forecast to 2031 (Tons)

7.3.3 Alloy: Scandium Market - Revenue and Forecast to 2031 (US$ Million)

7.4 Zirconia

7.4.1 Overview

7.4.2 Zirconia: Scandium Market - Volume and Forecast to 2031 (Tons)

7.4.3 Zirconia: Scandium Market - Revenue and Forecast to 2031 (US$ Million)

7.5 Others

7.5.1 Overview

7.5.2 Others: Scandium Market - Volume and Forecast to 2031 (Tons)

7.5.3 Others: Scandium Market - Revenue and Forecast to 2031 (US$ Million)

8. Asia Pacific Scandium Market Revenue Analysis - by Application

8.1 Aerospace and Defense

8.1.1 Overview

8.1.2 Aerospace and Defense: Scandium Market - Revenue and Forecast to 2031 (US$ Million)

8.2 Solid Oxide Fuel Cells

8.2.1 Overview

8.2.2 Solid Oxide Fuel Cells: Scandium Market - Revenue and Forecast to 2031 (US$ Million)

8.3 Electronics

8.3.1 Overview

8.3.2 Electronics: Scandium Market - Revenue and Forecast to 2031 (US$ Million)

8.4 Ceramics

8.4.1 Overview

8.4.2 Ceramics: Scandium Market - Revenue and Forecast to 2031 (US$ Million)

8.5 Lighting

8.5.1 Overview

8.5.2 Lighting: Scandium Market - Revenue and Forecast to 2031 (US$ Million)

8.6 Nuclear Applications

8.6.1 Overview

8.6.2 Nuclear Applications: Scandium Market - Revenue and Forecast to 2031 (US$ Million)

8.7 3D Printing

8.7.1 Overview

8.7.2 3D Printing: Scandium Market - Revenue and Forecast to 2031 (US$ Million)

8.8 Others

8.8.1 Overview

8.8.2 Others: Scandium Market - Revenue and Forecast to 2031 (US$ Million)

9. Asia Pacific Scandium Market - Country Analysis

9.1 Asia Pacific Market Overview

9.1.1 Asia Pacific Scandium Market Revenue and Forecast and Analysis - by Country

9.1.1.1 Asia Pacific Scandium Market Volume and Forecast and Analysis - by Country

9.1.1.2 Asia Pacific Scandium Market Revenue and Forecast and Analysis -by Country

9.1.1.3 Australia Scandium Market - Revenue and Forecast to 2031 (US$ Million)

9.1.1.3.1 Australia Scandium Market Breakdown by Derivative

9.1.1.4 China Scandium Market - Revenue and Forecast to 2031 (US$ Million)

9.1.1.4.1 China Scandium Market Breakdown by Derivative

9.1.1.5 India Scandium Market - Revenue and Forecast to 2031 (US$ Million)

9.1.1.5.1 India Scandium Market Breakdown by Derivative

9.1.1.6 Japan Scandium Market - Revenue and Forecast to 2031 (US$ Million)

9.1.1.6.1 Japan Scandium Market Breakdown by Derivative

9.1.1.7 South Korea Scandium Market - Revenue and Forecast to 2031 (US$ Million)

9.1.1.7.1 South Korea Scandium Market Breakdown by Derivative

9.1.1.8 Rest of Asia Pacific Scandium Market - Revenue and Forecast to 2031 (US$ Million)

9.1.1.8.1 Rest of Asia Pacific Scandium Market Breakdown by Derivative

10. Competitive Landscape

10.1 Heat Map Analysis by Key Players

10.2 Company Positioning & Concentration

11. Company Profiles

11.1 American Elements Inc

11.1.1 Key Facts

11.1.2 Business Description

11.1.3 Products and Services

11.1.4 Financial Overview

11.1.5 SWOT Analysis

11.1.6 Key Developments

11.2 Strategic Metal Investments Ltd

11.2.1 Key Facts

11.2.2 Business Description

11.2.3 Products and Services

11.2.4 Financial Overview

11.2.5 SWOT Analysis

11.2.6 Key Developments

11.3 Rio Tinto Ltd

11.3.1 Key Facts

11.3.2 Business Description

11.3.3 Products and Services

11.3.4 Financial Overview

11.3.5 SWOT Analysis

11.3.6 Key Developments

11.4 Scandium International Mining Corporation

11.4.1 Key Facts

11.4.2 Business Description

11.4.3 Products and Services

11.4.4 Financial Overview

11.4.5 SWOT Analysis

11.4.6 Key Developments

11.5 Otto Chemie Pvt. Ltd.

11.5.1 Key Facts

11.5.2 Business Description

11.5.3 Products and Services

11.5.4 Financial Overview

11.5.5 SWOT Analysis

11.5.6 Key Developments

11.6 Hunan Oriental Scandium Co Ltd

11.6.1 Key Facts

11.6.2 Business Description

11.6.3 Products and Services

11.6.4 Financial Overview

11.6.5 SWOT Analysis

11.6.6 Key Developments

12. Appendix

12.1 About The Insight Partners


List of Tables

Table 1. Scandium Market Segmentation

Table 2. List of Vendors

Table 3. Scandium Market - Volume and Forecast to 2031 (Tons)

Table 4. Scandium Market - Revenue and Forecast to 2031 (US$ Million)

Table 5. Scandium Market - Volume and Forecast to 2031 (Tons) - by Derivative

Table 6. Scandium Market - Revenue and Forecast to 2031 (US$ Million) - by Derivative

Table 7. Scandium Market - Revenue and Forecast to 2031 (US$ Million) - by Application

Table 8. Asia Pacific Scandium Market - Volume and Forecast to 2031 (Tons) - by Country

Table 9. Asia Pacific Scandium Market - Revenue and Forecast to 2031 (US$ Million) - by Country

Table 10. Australia Scandium Market -Volume and Forecast to 2031 (Tons) - by Derivative

Table 11. Australia Scandium Market - Revenue and Forecast to 2031 (US$ Million) - by Derivative

Table 12. Australia Scandium Market - Revenue and Forecast to 2031 (US$ Million) - by Application

Table 13. China Scandium Market -Volume and Forecast to 2031 (Tons) - by Derivative

Table 14. China Scandium Market - Revenue and Forecast to 2031 (US$ Million) - by Derivative

Table 15. China Scandium Market - Revenue and Forecast to 2031 (US$ Million) - by Application

Table 16. India Scandium Market -Volume and Forecast to 2031 (Tons) - by Derivative

Table 17. India Scandium Market - Revenue and Forecast to 2031 (US$ Million) - by Derivative

Table 18. India Scandium Market - Revenue and Forecast to 2031 (US$ Million) - by Application

Table 19. Japan Scandium Market -Volume and Forecast to 2031 (Tons) - by Derivative

Table 20. Japan Scandium Market - Revenue and Forecast to 2031 (US$ Million) - by Derivative

Table 21. Japan Scandium Market - Revenue and Forecast to 2031 (US$ Million) - by Application

Table 22. South Korea Scandium Market -Volume and Forecast to 2031 (Tons) - by Derivative

Table 23. South Korea Scandium Market - Revenue and Forecast to 2031 (US$ Million) - by Derivative

Table 24. South Korea Scandium Market - Revenue and Forecast to 2031 (US$ Million) - by Application

Table 25. Rest of Asia Pacific Scandium Market -Volume and Forecast to 2031 (Tons) - by Derivative

Table 26. Rest of Asia Pacific Scandium Market - Revenue and Forecast to 2031 (US$ Million) - by Derivative

Table 27. Rest of Asia Pacific Scandium Market - Revenue and Forecast to 2031 (US$ Million) - by Application


List of Figures

Figure 1. Asia Pacific Scandium Market Segmentation, by Country

Figure 2. Porter's Five Forces Analysis

Figure 3. Ecosystem Analysis: Scandium Market

Figure 4. Scandium Market - Key Market Dynamics

Figure 5. Impact Analysis of Drivers and Restraints

Figure 6. Scandium Market Volume (Tons), 2020-2031

Figure 7. Scandium Market Revenue (US$ Million), 2020-2031

Figure 8. Scandium Market Share (%) - Derivative, 2023 and 2031

Figure 9. Oxide: Scandium Market - Volume and Forecast to 2031 (Tons)

Figure 10. Oxide: Scandium Market - Revenue and Forecast to 2031 (US$ Million)

Figure 11. Iodide: Scandium Market - Volume and Forecast to 2031 (Tons)

Figure 12. Iodide: Scandium Market - Revenue and Forecast to 2031 (US$ Million)

Figure 13. Alloy: Scandium Market - Volume and Forecast to 2031 (Tons)

Figure 14. Alloy: Scandium Market - Revenue and Forecast to 2031 (US$ Million)

Figure 15. Zirconia: Scandium Market - Volume and Forecast to 2031 (Tons)

Figure 16. Zirconia: Scandium Market - Revenue and Forecast to 2031 (US$ Million)

Figure 17. Others: Scandium Market - Volume and Forecast to 2031 (Tons)

Figure 18. Others: Scandium Market - Revenue and Forecast to 2031 (US$ Million)

Figure 19. Scandium Market Share (%) - Application, 2023 and 2031

Figure 20. Aerospace and Defense: Scandium Market - Revenue and Forecast to 2031 (US$ Million)

Figure 21. Solid Oxide Fuel Cells: Scandium Market - Revenue and Forecast to 2031 (US$ Million)

Figure 22. Electronics: Scandium Market - Revenue and Forecast to 2031 (US$ Million)

Figure 23. Ceramics: Scandium Market - Revenue and Forecast to 2031 (US$ Million)

Figure 24. Lighting: Scandium Market - Revenue and Forecast to 2031 (US$ Million)

Figure 25. Nuclear Applications: Scandium Market - Revenue and Forecast to 2031 (US$ Million)

Figure 26. 3D Printing: Scandium Market - Revenue and Forecast to 2031 (US$ Million)

Figure 27. Others: Scandium Market - Revenue and Forecast to 2031 (US$ Million)

Figure 28. Market, by Key Countries - Revenue (2023) (US$ Million)

Figure 29. Asia Pacific Scandium Market Breakdown by Key Countries, 2023 and 2031 (%)

Figure 30. Australia Scandium Market - Revenue and Forecast to 2031 (US$ Million)

Figure 31. China Scandium Market - Revenue and Forecast to 2031 (US$ Million)

Figure 32. India Scandium Market - Revenue and Forecast to 2031 (US$ Million)

Figure 33. Japan Scandium Market - Revenue and Forecast to 2031 (US$ Million)

Figure 34. South Korea Scandium Market - Revenue and Forecast to 2031 (US$ Million)

Figure 35. Rest of Asia Pacific Scandium Market - Revenue and Forecast to 2031 (US$ Million)

Figure 36. Heat Map Analysis by Key Players

Figure 37. Company Positioning & Concentration

  1. American Elements Inc.
  2. Strategic Metal Investments Ltd.
  3. Rio Tinto Ltd.
  4. Scandium International Mining Corporation.
  5. Otto Chemie Pvt. Ltd.
  6. Hunan Oriental Scandium Co Ltd.
  • Save and reduce time carrying out entry-level research by identifying the growth, size, leading players, and segments in the Asia Pacific scandium market.
  • Highlights key business priorities in order to assist companies to realign their business strategies.
  • The key findings and recommendations highlight crucial progressive industry trends in the Asia Pacific scandium market, thereby allowing players across the value chain to develop effective long-term strategies.
  • Develop/modify business expansion plans by using substantial growth offering developed and emerging markets.
  • Scrutinize in-depth Asia Pacific market trends and outlook coupled with the factors driving the Asia Pacific scandium market, as well as those hindering it.
  • Enhance the decision-making process by understanding the strategies that underpin commercial interest with respect to client products, segmentation, pricing, and distribution.
Report Code
Full Name
Country Name
Email Id
Phone Number
Job Title
Company
Requirement

Note : Your data will never be shared with third parties, however, we may send you information from time to time about our products that may be of interest to you. By submitting your details, you agree to be contacted by us. You may contact us at any time to opt-out.


Purchase Options
Single User License
$3550
$2485
Site License
$4550
$3185
Enterprise License
$5550
$3885