亚太地区到 2028 年的回收炭黑市场预测 - COVID-19 影响和按应用划分的区域分析(轮胎、非轮胎橡胶、塑料等)

TIPRE00025893 | Pages: 75 | Chemicals and Materials | Nov 2021 | Type: Regional | Status: Published

市场介绍

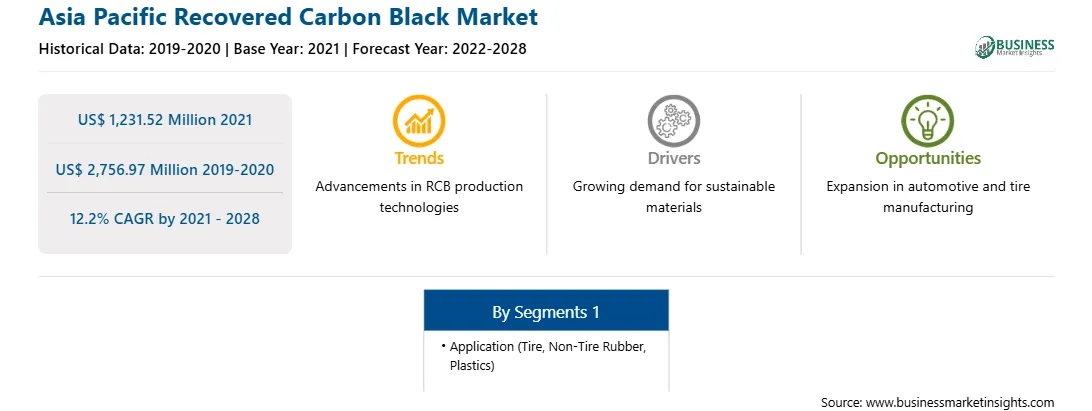
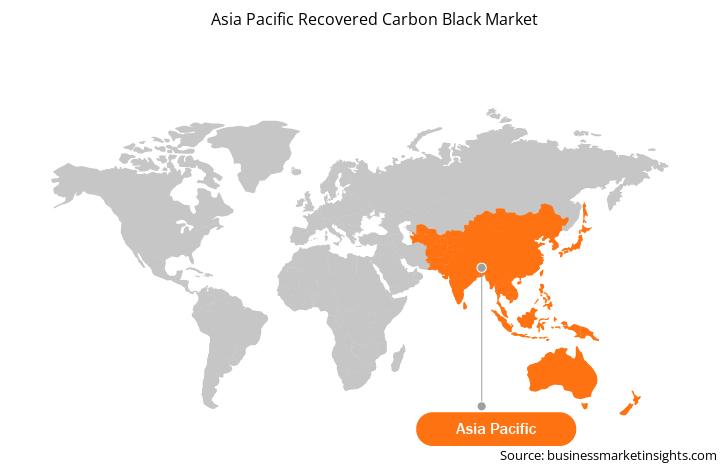
亚太地区的回收炭黑市场包括中国、印度、日本、韩国、澳大利亚、以及亚太地区其他地区。亚太地区 (APAC) 包括澳大利亚、中国、印度、日本、韩国和其他亚洲国家。印度和中国等国家每年产生大量废轮胎,这是支持该地区回收炭黑市场增长的关键因素。亚太地区的特点是汽车产量高,轮胎需求旺盛。中国和印度等国政府正在重点鼓励电动汽车的销售。在印度,国家电动汽车任务计划旨在加速电动汽车的制造和采用。此外,对非轮胎橡胶产品的需求不断增长预计将推动该地区炭黑市场的恢复增长。原材料采购和回收是注重减少其运营对环境影响的行业的关键活动。然而,缺乏生产回收炭黑所需的技术基础设施在一定程度上限制了亚太地区的市场增长。随着向可持续发展的转变,对绿色替代品的需求增加是推动亚太地区回收炭黑市场增长的主要因素。

预计 COVID-19 将在亚太地区造成重大经济损失。后果和影响可能会更严重,完全取决于病毒的传播。受疫情影响,亚洲经济遭受重创。印度、泰国和其他亚洲经济体出现新一波的 COVID-19 疫情,延长了疫情对 GDP 的影响。持续的 COVID-19 大流行预计将对亚太地区各行业的增长造成巨大干扰。然而,未来疫情爆发的不确定性,特别是在印度和其他少数亚洲国家,已经改变了该行业的状况。亚太各经济体政府正在采取可能的措施,通过宣布全国封锁来限制病毒的传播,这对工业部门的增长产生了直接影响。这可能会影响回收炭黑的需求。然而,预计市场将见证现有参与者的投资增加以及新参与者的渗透,以抓住当前的机会并满足疫情后飙升的需求。


市场概况和动态

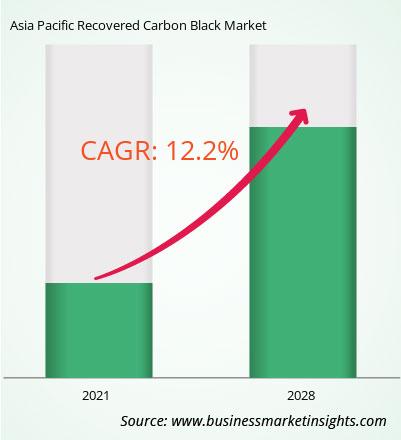
亚太地区回收的炭黑市场预计将从 2021 年的 12.3152 亿美元增长到美国到 2028 年将达到 27.5697 亿美元;预计 2021 年至 2028 年复合年增长率为 12.2%。从橡胶制品(特别是轮胎)产生的废物中生产回收炭黑是一个对生态有益的过程。此外,其结果也比原始炭黑更好,可以更好地切割成品。生产 1 公斤原生炭黑需要约 1.5-2 公斤原油。此外,回收炭黑还需要重复利用有价值的原材料,从而推动回收体系的升级。因此,用回收炭黑代替传统熔炉工艺生产的原始炭黑可大大减少碳足迹。仅使用回收炭黑 (rCB) 就可以减少 80% 的碳足迹,这就是为什么许多大型轮胎制造商正在尝试使用更多的回收炭黑。因此,与回收炭黑相关的成本和环境优势正在推动市场增长。

主要细分市场

基于从应用上看,亚太地区回收炭黑市场分为轮胎、非轮胎橡胶、塑料等。轮胎细分市场在2020年占据市场主导地位,非轮胎橡胶细分市场预计将在预测期内增长最快。

主要来源和上市公司

准备本亚太地区回收炭黑市场报告时参考的一些主要一手和二手来源包括公司网站、年度报告、财务报告、国家政府文件和统计数据库等。报告中列出的主要公司有Bolder Industries;恩瑞斯泰克; Pyrolyx 股份公司;拉德能源集团;斯堪的纳维亚环境系统公司;和 SR2O Holdings, LLC 等

购买报告的理由

  • 了解亚太地区复苏的炭黑市场格局,并确定最有可能保证强劲回报的细分市场
  • 通过以下方式保持领先地位了解亚太地区再生炭黑市场不断变化的竞争格局
  • 通过识别最有可能销售前景的细分市场,有效规划亚太地区再生炭黑市场的并购和合作交易
  • 通过对亚太地区回收炭黑市场各个细分市场的市场表现进行敏锐而全面的分析,有助于做出明智的业务决策
  • 获取亚太地区各个细分市场 2021-2028 年的市场收入预测 .

亚太地区回收炭黑市场细分

亚太地区回收炭黑市场 - 按应用

  • 轮胎
  • 非-轮胎橡胶
  • 塑料
  • 其他

亚太地区回收炭黑市场 - 按国家/地区

  • 澳大利亚
  • 中国
  • 印度
  • 日本
  • 韩国
  • 亚太地区其他地区

亚太地区回收炭黑市场 -公司简介

  • Bolder Industries
  • ENRESTEC
  • Pyrolyx AG
  • Radhe 能源集团
  • 斯堪的纳维亚环境系统公司
  • SR2O Holdings, LLC

TABLE OF CONTENTS

1.           Introduction

1.1         Study Scope

1.2         The Insight Partners Research Report Guidance

1.3         Market Segmentation

2.           Key Takeaways

3.           Research Methodology

3.1         Scope of the Study

3.2         Research Methodology

3.2.1        Data Collection:

3.2.2        Primary Interviews:

3.2.3        Hypothesis formulation:

3.2.4        Macro-economic factor analysis:

3.2.5        Developing base number:

3.2.6        Data Triangulation:

4.           APAC Recovered Carbon Black Market Landscape

4.1         Market Overview

4.2         Porter’s Five Forces Analysis

4.2.1        Bargaining Power of Suppliers

4.2.2        Bargaining Power of Buyers

4.2.3        Threat of Substitutes

4.2.4        Threat of New Entrants

4.2.5        Intensity of Competitive Rivalry

4.3         Ecosystem Analysis

4.4         Expert Opinion

5.           APAC Recovered Carbon Black Market – Key Market Dynamics

5.1         Market Drivers

5.1.1        Ecological Advantages of Recovered Carbon Black

5.1.2        Expanding Application Range of Recovered Carbon Black

5.2         Market Restraints

5.2.1        Limited Availability of Recovery Infrastructure and Increasing Production of Crude Oil

5.3         Market Opportunities

5.3.1        Rise in Need for Green Alternatives with Shift Towards Sustainability

5.4         Future Trends

5.4.1        Emphasis on Waste Tire Management

5.5         Impact Analysis

6.           Recovered Carbon Black – APAC Market Analysis

6.1         APAC Recovered Carbon Black Market Overview

6.2         APAC Recovered Carbon Black Market –Revenue and Forecast to 2028 (US$ Million)

7.           APAC Recovered Carbon Black Market Analysis – By Application

7.1         Overview

7.2         APAC Recovered Carbon Black Market Breakdown, by Application, 2020 & 2028

7.3         Tire

7.3.1        Overview

7.3.2        Tire: Recovered Carbon Black Market – Revenue and Forecast to 2028 (US$ Million)

7.4         Non-Tire Rubber

7.4.1        Overview

7.4.2        Non-Tire Rubber: Recovered Carbon Black Market – Revenue and Forecast to 2028 (US$ Million)

7.5         Plastics

7.5.1        Overview

7.5.2        Plastics: Recovered Carbon Black Market – Revenue and Forecast to 2028 (US$ Million)

7.6         Others

7.6.1        Overview

7.6.2        Others: Recovered Carbon Black Market – Revenue and Forecast to 2028 (US$ Million)

8.           APAC Recovered Carbon Black Market – Country Analysis

8.1         Overview

8.1.1        Asia Pacific: Recovered Carbon Black Market, by Key Country

8.1.1.1          Australia: Recovered Carbon Black Market –Revenue and Forecast to 2028 (USD Million)

8.1.1.1.1          Australia: Recovered Carbon Black Market, by Application

8.1.1.2          China: Recovered Carbon Black Market –Revenue and Forecast to 2028 (USD Million)

8.1.1.2.1          China: Recovered Carbon Black Market, by Application

8.1.1.3          Japan: Recovered Carbon Black Market –Revenue and Forecast to 2028 (USD Million)

8.1.1.3.1          Japan: Recovered Carbon Black Market, by Application

8.1.1.4          India: Recovered Carbon Black Market –Revenue and Forecast to 2028 (USD Million)

8.1.1.4.1          India: Recovered Carbon Black Market, by Application

8.1.1.5          South Korea: Recovered Carbon Black Market –Revenue and Forecast to 2028 (USD Million)

8.1.1.5.1          South Korea: Recovered Carbon Black Market, by Application

8.1.1.6          Rest of Asia Pacific: Recovered Carbon Black Market –Revenue and Forecast to 2028 (USD Million)

8.1.1.6.1          Rest of Asia Pacific: Recovered Carbon Black Market, by Application

9.           Impact of COVID-19 on APAC Recovered Carbon Black Market

9.1         Overview

10.        Company Profiles

10.1      Bolder Industries

10.1.1     Key Facts

10.1.2     Business Description

10.1.3     Products and Services

10.1.4     Financial Overview

10.1.5     SWOT Analysis

10.1.6     Key Developments

10.2      ENRESTEC

10.2.1     Key Facts

10.2.2     Business Description

10.2.3     Products and Services

10.2.4     Financial Overview

10.2.5     SWOT Analysis

10.2.6     Key Developments

10.3      Klean Carbon

10.3.1     Key Facts

10.3.2     Business Description

10.3.3     Products and Services

10.3.4     Financial Overview

10.3.5     SWOT Analysis

10.3.6     Key Developments

10.4      Radhe Group Of Energy

10.4.1     Key Facts

10.4.2     Business Description

10.4.3     Products and Services

10.4.4     Financial Overview

10.4.5     SWOT Analysis

10.4.6     Key Developments

10.5      SR2O Holdings, LLC

10.5.1     Key Facts

10.5.2     Business Description

10.5.3     Products and Services

10.5.4     Financial Overview

10.5.5     SWOT Analysis

10.5.6     Key Developments

10.6      Pyrolyx AG

10.6.1     Key Facts

10.6.2     Business Description

10.6.3     Products and Services

10.6.4     Financial Overview

10.6.5     SWOT Analysis

10.6.6     Key Developments

11.        Appendix

11.1      About The Insight Partners

11.2      Glossary of Terms

LIST OF TABLES

Table 1.             APAC Recovered Carbon Black Market –Revenue and Forecast to 2028 (US$ Million)

Table 2.             Australia Recovered Carbon Black Market, by Application – Revenue and Forecast to 2028 (USD Million)

Table 3.             China Recovered Carbon Black Market, by Application – Revenue and Forecast to 2028 (USD Million)

Table 4.             Japan Recovered Carbon Black Market, by Application – Revenue and Forecast to 2028 (USD Million)

Table 5.             India Recovered Carbon Black Market, by Application – Revenue and Forecast to 2028 (USD Million)

Table 6.             South Korea Recovered Carbon Black Market, by Application – Revenue and Forecast to 2028 (USD Million)

Table 7.             Rest of Asia Pacific Recovered Carbon Black Market, by Application – Revenue and Forecast to 2028 (USD Million)

Table 8.             Glossary of Terms, Recovered Carbon Black Market

LIST OF FIGURES

Figure 1.           APAC Recovered Carbon Black Market Segmentation

Figure 2.           APAC Recovered Carbon Black Market Segmentation – By Country

Figure 3.           APAC Recovered Carbon Black Market Overview

Figure 4.           Tire Segment Held Largest Share of APAC Recovered Carbon Black Market

Figure 5.           Japan Held Largest Share of APAC Recovered Carbon Black Market

Figure 6.           APAC Recovered Carbon Black Market, Industry Landscape

Figure 7.           Porter ‘s Five Forces Analysis for Recovered Carbon Black Market

Figure 8.           Recovered Carbon Black Market– Ecosystem Analysis

Figure 9.           Expert Opinion

Figure 10.        APAC Recovered Carbon Black Market Impact Analysis of Drivers and Restraints

Figure 11.        APAC: Recovered Carbon Black Market – Revenue and Forecast to 2028 (US$ Million)

Figure 12.        APAC Recovered Carbon Black Market Breakdown, by Application, 2020 & 2028

Figure 13.        APAC Tire: Recovered Carbon Black Market – Revenue and Forecast to 2028 (US$ Million)

Figure 14.        APAC Non-Tire Rubber: Recovered Carbon Black Market – Revenue and Forecast to 2028 (US$ Million)

Figure 15.        APAC Plastics: Recovered Carbon Black Market – Revenue and Forecast to 2028 (US$ Million)

Figure 16.        APAC Others: Recovered Carbon Black Market – Revenue and Forecast to 2028 (US$ Million)

Figure 17.        Asia Pacific: Recovered Carbon Black, by Key Country-Revenue 2020 (US$ Million)

Figure 18.        Asia Pacific: Recovered Carbon Black Market Revenue Share, by Key Country (2020 & 2028)

Figure 19.        Australia: Recovered Carbon Black Market –Revenue and Forecast to 2028 (USD Million)

Figure 20.        China: Recovered Carbon Black Market –Revenue and Forecast to 2028 (USD Million)

Figure 21.        Japan: Recovered Carbon Black Market –Revenue and Forecast to 2028 (USD Million)

Figure 22.        India: Recovered Carbon Black Market –Revenue and Forecast to 2028 (USD Million)

Figure 23.        South Korea: Recovered Carbon Black Market –Revenue and Forecast to 2028 (USD Million)

Figure 24.        Rest of Asia Pacific: Recovered Carbon Black Market –Revenue and Forecast to 2028 (USD Million)

Figure 25.        Impact of COVID-19 Pandemic in Asia Pacific


  1. Bolder Industries
  2. ENRESTEC
  3. Pyrolyx AG
  4. Radhe Group Of Energy
  5. Scandinavian Enviro Systems AB
  6. SR2O Holdings, LLC
  • Save and reduce time carrying out entry-level research by identifying the growth, size, leading players and segments in the APAC Recovered Carbon Black market.
  • Highlights key business priorities in order to assist companies to realign their business strategies
  • The key findings and recommendations highlight crucial progressive industry trends in the APAC Recovered Carbon Black market, thereby allowing players across the value chain to develop effective long-term strategies
  • Develop/modify business expansion plans by using substantial growth offering developed and emerging markets
  • Scrutinize in-depth APAC market trends and outlook coupled with the factors driving the Recovered Carbon Black market, as well as those hindering it
  • Enhance the decision-making process by understanding the strategies that underpin commercial interest with respect to client products, segmentation, pricing and distribution
Report Code
Full Name
Country Name
Email Id
Phone Number
Job Title
Company
Requirement

Note : Your data will never be shared with third parties, however, we may send you information from time to time about our products that may be of interest to you. By submitting your details, you agree to be contacted by us. You may contact us at any time to opt-out.


Purchase Options
Single User License
$3000
$1800
Site License
$4000
$2400
Enterprise License
$5000
$3000