亚太地区电力和控制电缆市场预测至 2030 年 - 区域分析 - 按类型(电力电缆和控制电缆)、电压(高压、中压和低压)和应用(公用事业和工业)

BMIRE00029671 | Pages: 78 | Electronics and Semiconductor | Feb 2024 | Type: Regional | Status: Published
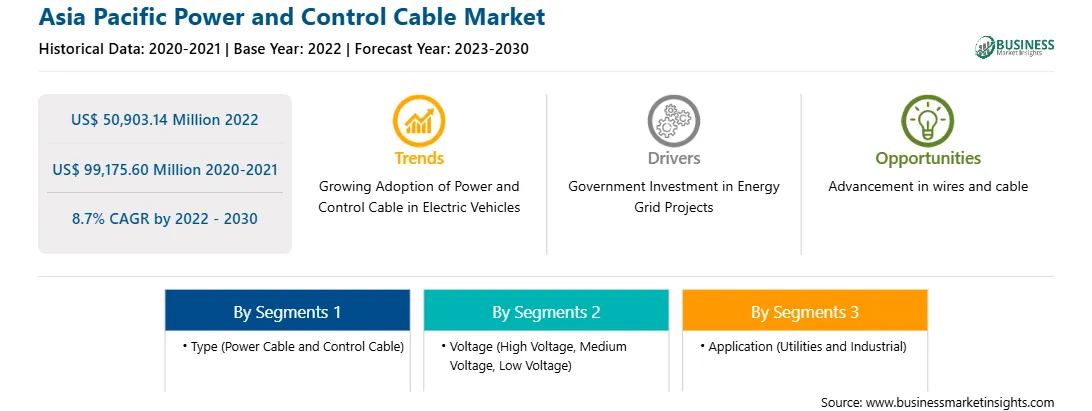
2022年亚太电力和控制电缆市场价值为509.0314亿美元,预计到2030年将达到991.756亿美元;预计 2022 年至 2030 年复合年增长率为 8.7%。

政府关于发展输配电行业的规范推动亚太电力和控制电缆市场

世界各地政府正在采取有关输配电部门发展的举措。例如,2023年,澳大利亚联邦政府和州政府宣布了一项53亿美元的合作协议,以支持八个重要的输电系统和可再生能源区项目。这项投资是该国“重新布线国家”政策的一部分,该政策的重点是花费 110 亿美元来实现该国电网和基础设施的现代化。此外,印度还于 2022 年宣布,计划在 2026 年至 2027 年之前斥资 171 亿美元建立州际输电网络 (ISTS),以疏散可再生能源,并在 2030 年之前再斥资 28 亿美元。 政府有关输配电行业的举措推动电力和控制电缆市场的增长。

亚太地区电力和控制电缆市场概览

根据 IEA 的数据,亚太地区是最大的电力生产国和消费国。该地区拥有多个世界上最大的制造中心和工业基地。中国和印度等国家是世界上人口最多的两个国家,因此消耗的电力比较小的国家多得多。过去二十年来,中国的发电能力支撑了中国的工业和整体增长。 2000年至2021年间,电力消耗增长了6倍多,使该国的发电能力成为世界上最大的,约占世界发电量的三分之一。 2021年,中国开工建设煤电装机33吉瓦,2022年批准新增燃煤电厂8.63吉瓦。然而,中国的零新冠政策严重影响了2022年的经济活动,电力需求增长速度仍存在不确定性。 IEA预计2022年电力需求将增长2.6%,远低于2015年至2019年疫情前5%以上的平均水平。虽然这些因素阻碍了电力电缆的需求,但工业部门的持续增长为国家电力做出了贡献和控制电缆市场。

在印度,输电系统多年来不断扩展,通过州内和州际输电系统将电力从发电站分配到负荷中心。输电系统连接配电系统和发电站,因此在向消费者供电方面发挥着关键作用。 2023 年 4 月,印度政府宣布计划到 2024 年至 2025 年将电路公里数 (ckm) 从 4,25,500 个电路公里 (ckm)(截至 2020 年 5 月 31 日已有)扩大到 4,54,200 个电路公里,从而在 2024 年至 2025 年期间增加约 28,700 个电路公里。加蒂沙克蒂总体规划。提议在州际输电系统 (ISTS) 网络和 220kV 及以上电压等级中增加这一设施。同样,2023年2月,国有电网公司通过基于电价的竞争性招标途径获得了五个州际输电项目,这些项目将在建设、拥有、运营和转让(BOOT)的基础上完成。 2022年12月,该国宣布了价值296亿美元的计划,用于建设输电线路和连接可再生能源发电,目标是到2030年将可再生能源发电能力增加两倍。所有这些因素预计将增加该国对各种电力和控制电缆的需求在预测期内。

日本和韩国是汽车制造领域的两个领先国家。汽车制造业占日本制造业的89%。此外,两国都在迅速采用电动汽车,从而带动了相关产业和基础设施的增长。例如,2022年8月,日本经济产业省估计需要投资超过240亿美元来开发具有竞争力的电动汽车(EV)和能源电池制造基地存储系统。在韩国,为了促进电动汽车的采用,政府向公民购买电动汽车提供补贴。 2023年2月,政府宣布计划将补贴电动汽车数量增加34%,从2022年的16万辆增加到2023年的21.5万辆。此外,根据环境产业部的统计,将为电动汽车提供全额补贴支持韩国售价低于 46,462 美元的车辆。电动汽车需求的增长鼓励两国建立充电基础设施,从而促进对电力电缆的需求。因此,汽车行业的扩张正在推动对电力和控制电缆的需求。

亚太地区电力和控制电缆市场收入及预测至 2030 年(百万美元)

亚太地区电力和控制电缆市场细分

亚太地区电力和控制电缆市场根据类型、电压、应用和国家进行细分。

根据类型,亚太地区电力和控制电缆市场分为电力电缆和控制电缆。到 2022 年,电力电缆细分市场将占据更大份额。

按电压划分,亚太地区电力和控制电缆市场分为高压、中压和低压。到 2022 年,低压细分市场将占据最大份额。

按应用划分,亚太地区电力和控制电缆市场分为公用事业和工业。到 2022 年,公用事业领域将占据更大的份额。

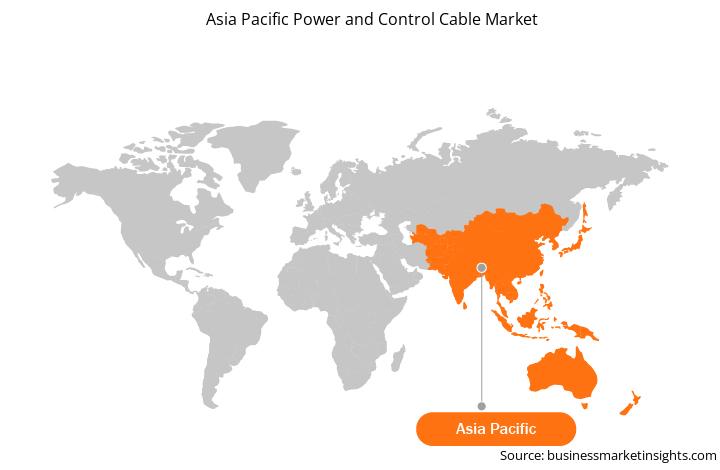
按国家/地区划分,亚太地区电力和控制电缆市场分为中国、日本、印度、韩国、澳大利亚和亚太地区其他地区。 2022 年,中国将主导亚太地区电力和控制电缆市场。

Belden Inc;古河电气有限公司;亨通集团有限公司;莱尼股份公司、耐克森股份公司;普睿司曼公司;和住友电气工业有限公司是亚太电力和控制电缆市场上的一些领先公司。

Table of Content
1. Introduction
1.1 The Insight Partners Research Report Guidance
1.2 Market Segmentation
2. Executive Summary
2.1 Key Insights
2.2 Market Attractiveness
3. Research Methodology
3.1 Coverage
3.2 Secondary Research
3.3 Primary Research
4. Asia Pacific Power and Control Market Landscape
4.1 Overview
4.2 Asia Pacific PEST Analysis
4.3 Ecosystem Analysis
4.3.1 Raw Material Providers:
4.3.2 Power and Control Cable Manufacturers:
4.3.3 Distributors:
4.3.4 End-Users:
4.3.5 Regulatory Bodies:
4.3.6 List of Vendors in the Value Chain:
5. Asia Pacific Power and Control Market - Key Industry Dynamics
5.1 Asia Pacific Power and Control Market - Key Industry Dynamics
5.2 Market Drivers
5.2.1 Rising Demand for Reliable Electricity
5.2.2 Government Norms on Developing Transmission & Distribution Sector
5.3 Market Restraints
5.3.1 Availability of Alternative Technologies
5.4 Market Opportunities
5.4.1 Increasing Demand for Data Center and Cloud Computing
5.4.2 Technological Advancements in Wires and Cables
5.5 Future Trends
5.5.1 Expansion of Smart Grid
5.6 Impact of Drivers and Restraints:
6. Power and Control Market - Asia Pacific Market Analysis
6.1 Asia Pacific Power and Control Market Revenue (US$ Million), 2022 - 2030
6.2 Asia Pacific Power and Control Market Forecast and Analysis
7. Asia Pacific Power and Control Market Analysis - Type
7.1 Power Cable
7.1.1 Overview
7.1.2 Power Cable Market Revenue, and Forecast to 2030 (US$ Million)
7.2 Control Cable
7.2.1 Overview
7.2.2 Control Cable Market Revenue, and Forecast to 2030 (US$ Million)
8. Asia Pacific Power and Control Market Analysis - Voltage
8.1 Low Voltage
8.1.1 Overview
8.1.2 Low Voltage Market Revenue, and Forecast to 2030 (US$ Million)
8.2 Medium Voltage
8.2.1 Overview
8.2.2 Medium Voltage Market Revenue, and Forecast to 2030 (US$ Million)
8.3 High Voltage
8.3.1 Overview
8.3.2 High Voltage Market Revenue, and Forecast to 2030 (US$ Million)
9. Asia Pacific Power and Control Market Analysis - Application
9.1 Utilities
9.1.1 Overview
9.1.2 Utilities Market Revenue, and Forecast to 2030 (US$ Million)
9.2 Industrial
9.2.1 Overview
9.2.2 Industrial Market Revenue, and Forecast to 2030 (US$ Million)
10. Asia Pacific Power and Control Market - Geographical Analysis
10.1 Overview
10.1.1 Asia Pacific: Asia Pacific Power and Control Market, by Key Country
10.1.1.1 Australia: Asia Pacific Power and Control Market - Revenue, and Forecast to 2030 (US$ Million)
10.1.1.1.1 Australia: Asia Pacific Power and Control Market, by Type
10.1.1.1.2 Australia: Asia Pacific Power and Control Market, by Voltage
10.1.1.1.3 Australia: Asia Pacific Power and Control Market, by Application
10.1.1.2 China: Asia Pacific Power and Control Market - Revenue, and Forecast to 2030 (US$ Million)
10.1.1.2.1 China: Asia Pacific Power and Control Market, by Type
10.1.1.2.2 China: Asia Pacific Power and Control Market, by Voltage
10.1.1.2.3 China: Asia Pacific Power and Control Market, by Application
10.1.1.3 India: Asia Pacific Power and Control Market - Revenue, and Forecast to 2030 (US$ Million)
10.1.1.3.1 India: Asia Pacific Power and Control Market, by Type
10.1.1.3.2 India: Asia Pacific Power and Control Market, by Voltage
10.1.1.3.3 India: Asia Pacific Power and Control Market, by Application
10.1.1.4 Japan: Asia Pacific Power and Control Market - Revenue, and Forecast to 2030 (US$ Million)
10.1.1.4.1 Japan: Asia Pacific Power and Control Market, by Type
10.1.1.4.2 Japan: Asia Pacific Power and Control Market, by Voltage
10.1.1.4.3 Japan: Asia Pacific Power and Control Market, by Application
10.1.1.5 South Korea: Asia Pacific Power and Control Market - Revenue, and Forecast to 2030 (US$ Million)
10.1.1.5.1 South Korea: Asia Pacific Power and Control Market, by Type
10.1.1.5.2 South Korea: Asia Pacific Power and Control Market, by Voltage
10.1.1.5.3 South Korea: Asia Pacific Power and Control Market, by Application
10.1.1.6 Rest of Asia Pacific: Asia Pacific Power and Control Market - Revenue, and Forecast to 2030 (US$ Million)
10.1.1.6.1 Rest of Asia Pacific: Asia Pacific Power and Control Market, by Type
10.1.1.6.2 Rest of Asia Pacific: Asia Pacific Power and Control Market, by Voltage
10.1.1.6.3 Rest of Asia Pacific: Asia Pacific Power and Control Market, by Application
11. Competitive Landscape
11.1 Heat Map Analysis By Key Players
11.2 Company Positioning & Concentration
12. Industry Landscape
12.1 Overview
12.2 Market Initiative
13. Company Profiles
13.1 Belden Inc
13.1.1 Key Facts
13.1.2 Business Description
13.1.3 Products and Services
13.1.4 Financial Overview
13.1.5 SWOT Analysis
13.1.6 Key Developments
13.2 Furukawa Electric Co Ltd
13.2.1 Key Facts
13.2.2 Business Description
13.2.3 Products and Services
13.2.4 Financial Overview
13.2.5 SWOT Analysis
13.2.6 Key Developments
13.3 HENGTONG GROUP CO.,LTD.
13.3.1 Key Facts
13.3.2 Business Description
13.3.3 Products and Services
13.3.4 Financial Overview
13.3.5 SWOT Analysis
13.3.6 Key Developments
13.4 LEONI AG
13.4.1 Key Facts
13.4.2 Business Description
13.4.3 Products and Services
13.4.4 Financial Overview
13.4.5 SWOT Analysis
13.4.6 Key Developments
13.5 Nexans SA
13.5.1 Key Facts
13.5.2 Business Description
13.5.3 Products and Services
13.5.4 Financial Overview
13.5.5 SWOT Analysis
13.5.6 Key Developments
13.6 Prysmian SpA
13.6.1 Key Facts
13.6.2 Business Description
13.6.3 Products and Services
13.6.4 Financial Overview
13.6.5 SWOT Analysis
13.6.6 Key Developments
13.7 Sumitomo Electric Industries Ltd
13.7.1 Key Facts
13.7.2 Business Description
13.7.3 Products and Services
13.7.4 Financial Overview
13.7.5 SWOT Analysis
13.7.6 Key Developments
14. Appendix
14.1 About The Insight Partners
14.2 Word Index


List of Tables
Table 1. Asia Pacific Power and Control Market Segmentation
Table 2. Asia Pacific Power and Control Market Revenue and Forecasts To 2030 (US$ Million)
Table 3. Asia Pacific Power and Control Market Revenue and Forecasts To 2030 (US$ Million) -Type
Table 4. Asia Pacific Power and Control Market Revenue and Forecasts To 2030 (US$ Million) - Voltage
Table 5. Asia Pacific Power and Control Market Revenue and Forecasts To 2030 (US$ Million) - Application
Table 6. Australia: Asia Pacific Power and Control Market, by Type -Revenue and Forecast to 2030 (US$ Million)
Table 7. Australia: Asia Pacific Power and Control Market, by Voltage -Revenue and Forecast to 2030 (US$ Million)
Table 8. Australia: Asia Pacific Power and Control Market, by Application -Revenue and Forecast to 2030 (US$ Million)
Table 9. China: Asia Pacific Power and Control Market, by Type -Revenue and Forecast to 2030 (US$ Million)
Table 10. China: Asia Pacific Power and Control Market, by Voltage -Revenue and Forecast to 2030 (US$ Million)
Table 11. China: Asia Pacific Power and Control Market, by Application -Revenue and Forecast to 2030 (US$ Million)
Table 12. India: Asia Pacific Power and Control Market, by Type -Revenue and Forecast to 2030 (US$ Million)
Table 13. India: Asia Pacific Power and Control Market, by Voltage -Revenue and Forecast to 2030 (US$ Million)
Table 14. India: Asia Pacific Power and Control Market, by Application -Revenue and Forecast to 2030 (US$ Million)
Table 15. Japan: Asia Pacific Power and Control Market, by Type -Revenue and Forecast to 2030 (US$ Million)
Table 16. Japan: Asia Pacific Power and Control Market, by Voltage -Revenue and Forecast to 2030 (US$ Million)
Table 17. Japan: Asia Pacific Power and Control Market, by Application -Revenue and Forecast to 2030 (US$ Million)
Table 18. South Korea: Asia Pacific Power and Control Market, by Type -Revenue and Forecast to 2030 (US$ Million)
Table 19. South Korea: Asia Pacific Power and Control Market, by Voltage -Revenue and Forecast to 2030 (US$ Million)
Table 20. South Korea: Asia Pacific Power and Control Market, by Application -Revenue and Forecast to 2030 (US$ Million)
Table 21. Rest of Asia Pacific: Asia Pacific Power and Control Market, by Type -Revenue and Forecast to 2030 (US$ Million)
Table 22. Rest of Asia Pacific: Asia Pacific Power and Control Market, by Voltage -Revenue and Forecast to 2030 (US$ Million)
Table 23. Rest of Asia Pacific: Asia Pacific Power and Control Market, by Application -Revenue and Forecast to 2030 (US$ Million)
Table 24. Heat Map Analysis By Key Players
Table 25. List of Abbreviation

List of Figures
Figure 1. Asia Pacific Power and Control Market Segmentation, By Country
Figure 2. Asia Pacific PEST Analysis
Figure 3. Ecosystem: Asia Pacific Power and Control Cable Market
Figure 4. Impact Analysis of Drivers and Restraints
Figure 5. Asia Pacific Power and Control Market Revenue (US$ Million), 2022 - 2030
Figure 6. Asia Pacific Power and Control Market Share (%) -Type, 2022 and 2030
Figure 7. Power Cable Market Revenue and Forecasts To 2030 (US$ Million)
Figure 8. Control Cable Market Revenue and Forecasts To 2030 (US$ Million)
Figure 9. Asia Pacific Power and Control Market Share (%) - Voltage, 2022 and 2030
Figure 10. Low Voltage Market Revenue and Forecasts To 2030 (US$ Million)
Figure 11. Medium Voltage Market Revenue and Forecasts To 2030 (US$ Million)
Figure 12. High Voltage Market Revenue and Forecasts To 2030 (US$ Million)
Figure 13. Asia Pacific Power and Control Market Share (%) - Application, 2022 and 2030
Figure 14. Utilities Market Revenue and Forecasts To 2030 (US$ Million)
Figure 15. Industrial Market Revenue and Forecasts To 2030 (US$ Million)
Figure 16. Asia Pacific: Power and Control Market, by Key Country - Revenue (2022) (US$ Million)
Figure 17. Asia Pacific: Asia Pacific Power and Control Market Revenue Share, by Key Country (2022 and 2030)
Figure 18. Australia: Asia Pacific Power and Control Market - Revenue, and Forecast to 2030 (US$ Million)
Figure 19. China: Asia Pacific Power and Control Market - Revenue, and Forecast to 2030 (US$ Million)
Figure 20. India: Asia Pacific Power and Control Market - Revenue, and Forecast to 2030 (US$ Million)
Figure 21. Japan: Asia Pacific Power and Control Market - Revenue, and Forecast to 2030 (US$ Million)
Figure 22. South Korea: Asia Pacific Power and Control Market - Revenue, and Forecast to 2030 (US$ Million)
Figure 23. Rest of Asia Pacific: Asia Pacific Power and Control Market - Revenue, and Forecast to 2030 (US$ Million)
Figure 24. Company Positioning & Concentration

1. Belden Inc
2. Furukawa Electric Co Ltd
3. HENGTONG GROUP CO., LTD.
4. LEONI AG
5. Nexans SA
6. Prysmian SpA
7. Sumitomo Electric Industries Ltd

  • Save and reduce time carrying out entry-level research by identifying the growth, size, leading players, and segments in the Asia Pacific power and control cable market.
  • Highlights key business priorities in order to assist companies to realign their business strategies
  • The key findings and recommendations highlight crucial progressive industry trends in the Asia Pacific power and control cable market, thereby allowing players across the value chain to develop effective long-term strategies
  • Develop/modify business expansion plans by using substantial growth offering developed and emerging markets
  • Scrutinize in-depth Asia Pacific market trends and outlook coupled with the factors driving the power and control cable market, as well as those hindering it
  • Enhance the decision-making process by understanding the strategies that underpin commercial interest with respect to client products, segmentation, pricing, and distribution
Report Code
Full Name
Country Name
Email Id
Phone Number
Job Title
Company
Requirement

Note : Your data will never be shared with third parties, however, we may send you information from time to time about our products that may be of interest to you. By submitting your details, you agree to be contacted by us. You may contact us at any time to opt-out.


Purchase Options
Single User License
$3550
$2840
Site License
$4550
$3640
Enterprise License
$5550
$4440