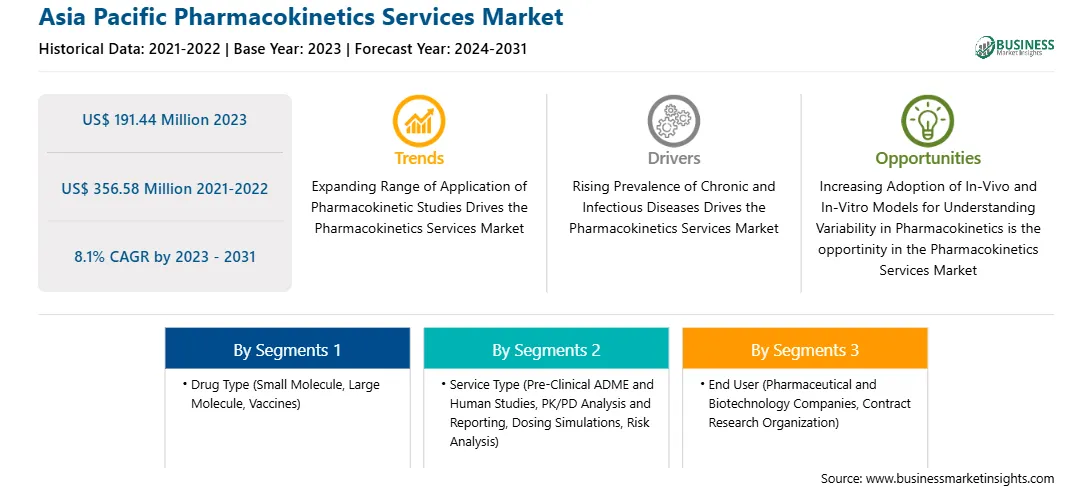
亚太药代动力学服务市场预测至 2031 年 - 区域分析 - 按药物类型(小分子、大分子和疫苗)、服务类型(临床前 ADME 和人体研究、PK/PD 分析和报告、剂量模拟、风险分析等)、治疗应用(肿瘤学、传染病、神经系统疾病、自身免疫性疾病、妇科疾病、心血管疾病、呼吸系统疾病等)和最终用户(制药和生物技术公司、合同研究组织等)

BMIRE00030886 | Pages: 95 | Pharmaceuticals | Oct 2024 | Type: Regional | Status: Published

2023 年亚太药代动力学服务市场价值为 1.9144 亿美元,预计到 2031 年将达到 3.5658 亿美元;预计 2023 年至 2031 年的复合年增长率为 8.1%。

越来越多地采用体内和体外模型来了解药代动力学的变化,推动亚太药代动力学服务市场发展

收集和处理药品制造过程中产生的大量药代动力学数据是一项昂贵、繁琐且耗时的任务。这些任务的劳动和成本密集性质凸显了对药代动力学模拟模型和体外-体内药代动力学相关模型 (IVIVC) 等模型的需求,以预测药代动力学参数。药代动力学模拟模型是一种使用计算和数学模型解释特定条件下生活环境中药物动力学的工具。此外,IVIVC 模型是药物发现过程的基本组成部分。在药物开发的早期阶段分析 PK/PD 预测对于先导优化策略和进一步降低流失率是必要的。在开发新的体外和体内策略以改善和表征药代动力学特性方面取得了重大进展。IVIVC 模型被提议作为一种经济有效的替代方案来评估分析药物生物利用度及其应用的生物制药特性。因此,预计此类体内和体外模型将在不久的将来为亚太药代动力学服务市场提供丰厚的机会。

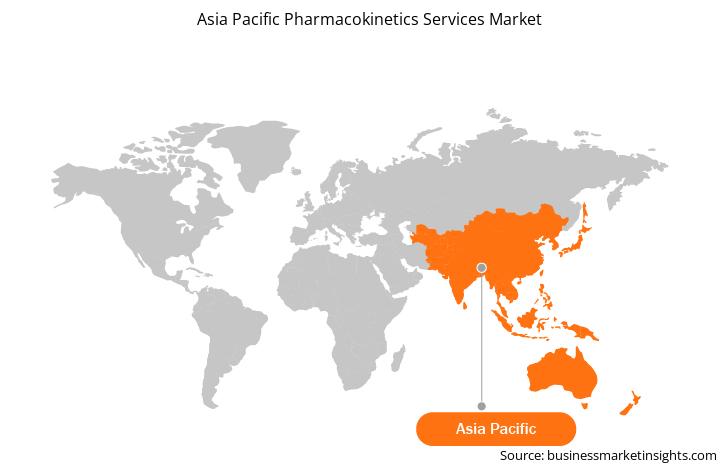
亚太药代动力学服务市场概览

中国亚太药代动力学服务市场的增长主要归因于成熟的制药市场、制药和生物制药公司不断增加的研发支出、由于运营成本降低而增加的临床试验数量以及有利的监管政策。根据 2023 年发布的 EFPIA 报告,中国制药公司的研发支出从 2020 年的 108.1423 亿美元增长到 2021 年的 129.8923 亿美元。中国拥有世界第二大医药市场。该国人口过剩,再加上各种非传染性和传染性疾病病例的增加,刺激了对新药物分子的需求,这使得中国成为亚太地区的主要市场。

亚太药代动力学服务市场收入和预测到 2031 年(百万美元)

亚太药代动力学服务市场细分

亚太药代动力学服务市场分为药物类型、服务类型、治疗应用、最终用户和国家。

根据药物类型,亚太药代动力学服务市场分为小分子、大分子和疫苗。小分子细分市场在 2023 年占据最大市场份额。

就服务类型而言,亚太药代动力学服务市场分为临床前 ADME 和人体研究、PK/PD 分析和报告、剂量模拟、风险分析等。临床前 ADME 和人体研究细分市场在 2023 年占据最大市场份额。

按治疗应用,亚太药代动力学服务市场细分为肿瘤学、传染病、神经系统疾病、自身免疫性疾病、妇科疾病、心血管疾病、呼吸系统疾病等。肿瘤学细分市场在 2023 年占据最大市场份额。

按最终用户,亚太药代动力学服务市场细分为制药和生物技术公司、合同研究组织等。合同研究组织部门在 2023 年占据了最大的市场份额。

按国家/地区划分,亚太药代动力学服务市场分为中国、日本、印度、澳大利亚、韩国和亚太地区其他地区。日本在 2023 年占据了亚太药代动力学服务市场份额的主导地位。

Allucent;Certara Inc.;Charles River Laboratories International Inc;Eurofins Scientific SE;PACIFIC BIOLABS;Parexel International Corp;SGS SA;上海美迪西公司;和赛默飞世尔科技公司是亚太药代动力学服务市场的一些领先公司。

TABLE OF CONTENTS


1. Introduction

1.1 The Insight Partners Research Report Guidance

1.2 Market Segmentation

2. Executive Summary

2.1 Key Insights

3. Research Methodology

3.1 Coverage

3.2 Secondary Research

3.3 Primary Research

4. Asia Pacific Pharmacokinetics Services Market - Key Market Dynamics

4.1 Market Drivers

4.1.1 Rising Prevalence of Chronic and Infectious Diseases

4.1.2 Expanding Range of Application of Pharmacokinetic Studies

4.1.3 Outsourcing of Pharmacokinetics Services to CROs

4.2 Market Restraints

4.2.1 Limited Reach of Pharmacokinetics Service Providers in Emerging Countries

4.3 Market Opportunities

4.3.1 Increasing Adoption of In-Vivo and In-Vitro Models for Understanding Variability in Pharmacokinetics

4.4 Future Trend

4.4.1 Increasing Adoption of Big Data Analytics in Pharmacokinetics Services

4.5 Impact of Drivers and Restraints:

5. Pharmacokinetics Services Market - Asia Pacific Analysis

5.1 Asia Pacific Pharmacokinetics Services Market Overview

5.2 Asia Pacific Pharmacokinetics Services Market Revenue (US$ Million), 2021-2031

6. Asia Pacific Pharmacokinetics Services Market Analysis - by Drug Type

6.1 Overview

6.2 Small Molecule

6.2.1 Overview

6.2.2 Small Molecule: Asia Pacific Pharmacokinetics Services Market - Revenue and Forecast to 2031 (US$ Million)

6.3 Large Molecule

6.3.1 Overview

6.3.2 Large Molecule: Asia Pacific Pharmacokinetics Services Market - Revenue and Forecast to 2031 (US$ Million)

6.4 Vaccines

6.4.1 Overview

6.4.2 Vaccines: Asia Pacific Pharmacokinetics Services Market - Revenue and Forecast to 2031 (US$ Million)

7. Asia Pacific Pharmacokinetics Services Market Analysis - by Service Type

7.1 Overview

7.2 Pre-Clinical ADME and Human Studies

7.2.1 Overview

7.2.2 Pre-Clinical ADME and Human Studies: Asia Pacific Pharmacokinetics Services Market - Revenue and Forecast to 2031 (US$ Million)

7.3 PK/PD Analysis and Reporting

7.3.1 Overview

7.3.2 PK/PD Analysis and Reporting: Asia Pacific Pharmacokinetics Services Market - Revenue and Forecast to 2031 (US$ Million)

7.4 Dosing Simulations

7.4.1 Overview

7.4.2 Dosing Simulations: Asia Pacific Pharmacokinetics Services Market - Revenue and Forecast to 2031 (US$ Million)

7.5 Risk Analysis

7.5.1 Overview

7.5.2 Risk Analysis: Asia Pacific Pharmacokinetics Services Market - Revenue and Forecast to 2031 (US$ Million)

7.6 Others

7.6.1 Overview

7.6.2 Others: Asia Pacific Pharmacokinetics Services Market - Revenue and Forecast to 2031 (US$ Million)

8. Asia Pacific Pharmacokinetics Services Market Analysis - by Therapeutic Application

8.1 Oncology

8.1.1 Overview

8.1.2 Oncology: Asia Pacific Pharmacokinetics Services Market - Revenue and Forecast to 2031 (US$ Million)

8.2 Infectious Diseases

8.2.1 Overview

8.2.2 Infectious Diseases: Asia Pacific Pharmacokinetics Services Market - Revenue and Forecast to 2031 (US$ Million)

8.3 Neurological Disorders

8.3.1 Overview

8.3.2 Neurological Disorders: Asia Pacific Pharmacokinetics Services Market - Revenue and Forecast to 2031 (US$ Million)

8.4 Autoimmune Diseases

8.4.1 Overview

8.4.2 Autoimmune Diseases: Asia Pacific Pharmacokinetics Services Market - Revenue and Forecast to 2031 (US$ Million)

8.5 Gynecological Disorders

8.5.1 Overview

8.5.2 Gynecological Disorders: Asia Pacific Pharmacokinetics Services Market - Revenue and Forecast to 2031 (US$ Million)

8.6 Cardiovascular Diseases

8.6.1 Overview

8.6.2 Cardiovascular Diseases: Asia Pacific Pharmacokinetics Services Market - Revenue and Forecast to 2031 (US$ Million)

8.7 Respiratory Disorders

8.7.1 Overview

8.7.2 Respiratory Disorders: Asia Pacific Pharmacokinetics Services Market - Revenue and Forecast to 2031 (US$ Million)

8.8 Others

8.8.1 Overview

8.8.2 Others: Asia Pacific Pharmacokinetics Services Market - Revenue and Forecast to 2031 (US$ Million)

9. Asia Pacific Pharmacokinetics Services Market Analysis - by End User

9.1 Pharmaceutical and Biotechnology Companies

9.1.1 Overview

9.1.2 Pharmaceutical and Biotechnology Companies: Asia Pacific Pharmacokinetics Services Market - Revenue and Forecast to 2031 (US$ Million)

9.2 Contract Research Organization

9.2.1 Overview

9.2.2 Contract Research Organization: Asia Pacific Pharmacokinetics Services Market - Revenue and Forecast to 2031 (US$ Million)

9.3 Others

9.3.1 Overview

9.3.2 Others: Asia Pacific Pharmacokinetics Services Market - Revenue and Forecast to 2031 (US$ Million)

10. Asia Pacific Pharmacokinetics Services Market - Country Analysis

10.1 Asia Pacific

10.1.1 Asia Pacific Pharmacokinetics Services Market Breakdown, by Key Countries, 2023 and 2031 (%)

10.1.1.1 China: Asia Pacific Pharmacokinetics Services Market - Revenue and Forecast to 2031 (US$ Million)

10.1.1.1.1 Overview

10.1.1.1.2 China: Asia Pacific Pharmacokinetics Services Market - Revenue and Forecast to 2031 (US$ Million)

10.1.1.1.3 China: Asia Pacific Pharmacokinetics Services Market Breakdown, by Drug Type

10.1.1.1.4 China: Asia Pacific Pharmacokinetics Services Market Breakdown, by Service Type

10.1.1.1.5 China: Asia Pacific Pharmacokinetics Services Market Breakdown, by Therapeutic Application

10.1.1.1.6 China: Asia Pacific Pharmacokinetics Services Market Breakdown, by End User

10.1.1.2 Japan: Asia Pacific Pharmacokinetics Services Market - Revenue and Forecast to 2031 (US$ Million)

10.1.1.2.1 Overview

10.1.1.2.2 Japan: Asia Pacific Pharmacokinetics Services Market - Revenue and Forecast to 2031 (US$ Million)

10.1.1.2.3 Japan: Asia Pacific Pharmacokinetics Services Market Breakdown, by Drug Type

10.1.1.2.4 Japan: Asia Pacific Pharmacokinetics Services Market Breakdown, by Service Type

10.1.1.2.5 Japan: Asia Pacific Pharmacokinetics Services Market Breakdown, by Therapeutic Application

10.1.1.2.6 Japan: Asia Pacific Pharmacokinetics Services Market Breakdown, by End User

10.1.1.3 India: Asia Pacific Pharmacokinetics Services Market - Revenue and Forecast to 2031 (US$ Million)

10.1.1.3.1 Overview

10.1.1.3.2 India: Asia Pacific Pharmacokinetics Services Market - Revenue and Forecast to 2031 (US$ Million)

10.1.1.3.3 India: Asia Pacific Pharmacokinetics Services Market Breakdown, by Drug Type

10.1.1.3.4 India: Asia Pacific Pharmacokinetics Services Market Breakdown, by Service Type

10.1.1.3.5 India: Asia Pacific Pharmacokinetics Services Market Breakdown, by Therapeutic Application

10.1.1.3.6 India: Asia Pacific Pharmacokinetics Services Market Breakdown, by End User

10.1.1.4 Australia: Asia Pacific Pharmacokinetics Services Market - Revenue and Forecast to 2031 (US$ Million)

10.1.1.4.1 Overview

10.1.1.4.2 Australia: Asia Pacific Pharmacokinetics Services Market - Revenue and Forecast to 2031 (US$ Million)

10.1.1.4.3 Australia: Asia Pacific Pharmacokinetics Services Market Breakdown, by Drug Type

10.1.1.4.4 Australia: Asia Pacific Pharmacokinetics Services Market Breakdown, by Service Type

10.1.1.4.5 Australia: Asia Pacific Pharmacokinetics Services Market Breakdown, by Therapeutic Application

10.1.1.4.6 Australia: Asia Pacific Pharmacokinetics Services Market Breakdown, by End User

10.1.1.5 South Korea: Asia Pacific Pharmacokinetics Services Market - Revenue and Forecast to 2031 (US$ Million)

10.1.1.5.1 Overview

10.1.1.5.2 South Korea: Asia Pacific Pharmacokinetics Services Market - Revenue and Forecast to 2031 (US$ Million)

10.1.1.5.3 South Korea: Asia Pacific Pharmacokinetics Services Market Breakdown, by Drug Type

10.1.1.5.4 South Korea: Asia Pacific Pharmacokinetics Services Market Breakdown, by Service Type

10.1.1.5.5 South Korea: Asia Pacific Pharmacokinetics Services Market Breakdown, by Therapeutic Application

10.1.1.5.6 South Korea: Asia Pacific Pharmacokinetics Services Market Breakdown, by End User

10.1.1.6 Rest of Asia Pacific: Asia Pacific Pharmacokinetics Services Market - Revenue and Forecast to 2031 (US$ Million)

10.1.1.6.1 Overview

10.1.1.6.2 Rest of Asia Pacific: Asia Pacific Pharmacokinetics Services Market - Revenue and Forecast to 2031 (US$ Million)

10.1.1.6.3 Rest of Asia Pacific: Asia Pacific Pharmacokinetics Services Market Breakdown, by Drug Type

10.1.1.6.4 Rest of Asia Pacific: Asia Pacific Pharmacokinetics Services Market Breakdown, by Service Type

10.1.1.6.5 Rest of Asia Pacific: Asia Pacific Pharmacokinetics Services Market Breakdown, by Therapeutic Application

10.1.1.6.6 Rest of Asia Pacific: Asia Pacific Pharmacokinetics Services Market Breakdown, by End User

11. Company Profile

11.1 Charles River Laboratories International Inc

11.1.1 Key Facts

11.1.2 Business Description

11.1.3 Products and Services

11.1.4 Financial Overview

11.1.5 SWOT Analysis

11.1.6 Key Developments

11.2 Eurofins Scientific SE

11.2.1 Key Facts

11.2.2 Business Description

11.2.3 Products and Services

11.2.4 Financial Overview

11.2.5 SWOT Analysis

11.2.6 Key Developments

11.3 Certara Inc.

11.3.1 Key Facts

11.3.2 Business Description

11.3.3 Products and Services

11.3.4 Financial Overview

11.3.5 SWOT Analysis

11.4 Parexel International Corp

11.4.1 Key Facts

11.4.2 Business Description

11.4.3 Products and Services

11.4.4 Financial Overview

11.4.5 SWOT Analysis

11.4.6 Key Developments

11.5 Thermo Fisher Scientific Inc.

11.5.1 Key Facts

11.5.2 Business Description

11.5.3 Products and Services

11.5.4 Financial Overview

11.5.5 SWOT Analysis

11.5.6 Key Developments

11.6 Allucent

11.6.1 Key Facts

11.6.2 Business Description

11.6.3 Products and Services

11.6.4 Financial Overview

11.6.5 SWOT Analysis

11.6.6 Key Developments

11.7 PACIFIC BIOLABS

11.7.1 Key Facts

11.7.2 Business Description

11.7.3 Products and Services

11.7.4 Financial Overview

11.7.5 SWOT Analysis

11.7.6 Key Developments

11.8 SGS SA

11.8.1 Key Facts

11.8.2 Business Description

11.8.3 Products and Services

11.8.4 Financial Overview

11.8.5 SWOT Analysis

11.8.6 Key Developments

11.9 Shanghai Medicilon Inc.

11.9.1 Key Facts

11.9.2 Business Description

11.9.3 Products and Services

11.9.4 Financial Overview

11.9.5 SWOT Analysis

11.9.6 Key Developments

12. Appendix

12.1 About The Insight Partners

12.2 Glossary of Terms for Pharmacokinetic Services Market


?

List of Tables

Table 1. Asia Pacific Pharmacokinetics Services Market Segmentation

Table 2. China: Asia Pacific Pharmacokinetics Services Market - Revenue and Forecast to 2031 (US$ Million) - by Drug Type

Table 3. China: Asia Pacific Pharmacokinetics Services Market - Revenue and Forecast to 2031 (US$ Million) - by Service Type

Table 4. China: Asia Pacific Pharmacokinetics Services Market - Revenue and Forecast to 2031 (US$ Million) - by Therapeutic Application

Table 5. China: Asia Pacific Pharmacokinetics Services Market - Revenue and Forecast to 2031 (US$ Million) - by End User

Table 6. Japan: Asia Pacific Pharmacokinetics Services Market - Revenue and Forecast to 2031 (US$ Million) - by Drug Type

Table 7. Japan: Asia Pacific Pharmacokinetics Services Market - Revenue and Forecast to 2031 (US$ Million) - by Service Type

Table 8. Japan: Asia Pacific Pharmacokinetics Services Market - Revenue and Forecast to 2031 (US$ Million) - by Therapeutic Application

Table 9. Japan: Asia Pacific Pharmacokinetics Services Market - Revenue and Forecast to 2031 (US$ Million) - by End User

Table 10. R&D Expenditure of Indian Companies, 2018-2020 (US$ Million)

Table 11. India: Asia Pacific Pharmacokinetics Services Market - Revenue and Forecast to 2031 (US$ Million) - by Drug Type

Table 12. India: Asia Pacific Pharmacokinetics Services Market - Revenue and Forecast to 2031 (US$ Million) - by Service Type

Table 13. India: Asia Pacific Pharmacokinetics Services Market - Revenue and Forecast to 2031 (US$ Million) - by Therapeutic Application

Table 14. India: Asia Pacific Pharmacokinetics Services Market - Revenue and Forecast to 2031 (US$ Million) - by End User

Table 15. Australia: Asia Pacific Pharmacokinetics Services Market - Revenue and Forecast to 2031 (US$ Million) - by Drug Type

Table 16. Australia: Asia Pacific Pharmacokinetics Services Market - Revenue and Forecast to 2031 (US$ Million) - by Service Type

Table 17. Australia: Asia Pacific Pharmacokinetics Services Market - Revenue and Forecast to 2031 (US$ Million) - by Therapeutic Application

Table 18. Australia: Asia Pacific Pharmacokinetics Services Market - Revenue and Forecast to 2031 (US$ Million) - by End User

Table 19. South Korea: Asia Pacific Pharmacokinetics Services Market - Revenue and Forecast to 2031 (US$ Million) - by Drug Type

Table 20. South Korea: Asia Pacific Pharmacokinetics Services Market - Revenue and Forecast to 2031 (US$ Million) - by Service Type

Table 21. South Korea: Asia Pacific Pharmacokinetics Services Market - Revenue and Forecast to 2031 (US$ Million) - by Therapeutic Application

Table 22. South Korea: Asia Pacific Pharmacokinetics Services Market - Revenue and Forecast to 2031 (US$ Million) - by End User

Table 23. Rest of Asia Pacific: Asia Pacific Pharmacokinetics Services Market - Revenue and Forecast to 2031 (US$ Million) - by Drug Type

Table 24. Rest of Asia Pacific: Asia Pacific Pharmacokinetics Services Market - Revenue and Forecast to 2031 (US$ Million) - by Service Type

Table 25. Rest of Asia Pacific: Asia Pacific Pharmacokinetics Services Market - Revenue and Forecast to 2031 (US$ Million) - by Therapeutic Application

Table 26. Rest of Asia Pacific: Asia Pacific Pharmacokinetics Services Market - Revenue and Forecast to 2031 (US$ Million) - by End User

Table 27. Glossary of Terms


?

List of Figures

Figure 1. Asia Pacific Pharmacokinetics Services Market Segmentation, by Country

Figure 2. Asia Pacific Pharmacokinetics Services Market - Key Market Dynamics

Figure 3. Impact Analysis of Drivers and Restraints

Figure 4. Asia Pacific Pharmacokinetics Services Market Revenue (US$ Million), 2021-2031

Figure 5. Asia Pacific Pharmacokinetics Services Market Share (%) - by Drug Type (2023 and 2031)

Figure 6. Small Molecule: Asia Pacific Pharmacokinetics Services Market - Revenue and Forecast to 2031 (US$ Million)

Figure 7. Large Molecule: Asia Pacific Pharmacokinetics Services Market - Revenue and Forecast to 2031 (US$ Million)

Figure 8. Vaccines: Asia Pacific Pharmacokinetics Services Market - Revenue and Forecast to 2031 (US$ Million)

Figure 9. Asia Pacific Pharmacokinetics Services Market Share (%) - by Service Type (2023 and 2031)

Figure 10. Pre-Clinical ADME and Human Studies: Asia Pacific Pharmacokinetics Services Market - Revenue and Forecast to 2031 (US$ Million)

Figure 11. PK/PD Analysis and Reporting: Asia Pacific Pharmacokinetics Services Market - Revenue and Forecast to 2031 (US$ Million)

Figure 12. Dosing Simulations: Asia Pacific Pharmacokinetics Services Market - Revenue and Forecast to 2031 (US$ Million)

Figure 13. Risk Analysis: Asia Pacific Pharmacokinetics Services Market - Revenue and Forecast to 2031 (US$ Million)

Figure 14. Others: Asia Pacific Pharmacokinetics Services Market - Revenue and Forecast to 2031 (US$ Million)

Figure 15. Asia Pacific Pharmacokinetics Services Market Share (%) - by Therapeutic Application (2023 and 2031)

Figure 16. Oncology: Asia Pacific Pharmacokinetics Services Market - Revenue and Forecast to 2031 (US$ Million)

Figure 17. Infectious Diseases: Asia Pacific Pharmacokinetics Services Market - Revenue and Forecast to 2031 (US$ Million)

Figure 18. Neurological Disorders: Asia Pacific Pharmacokinetics Services Market - Revenue and Forecast to 2031 (US$ Million)

Figure 19. Autoimmune Diseases: Asia Pacific Pharmacokinetics Services Market - Revenue and Forecast to 2031 (US$ Million)

Figure 20. Gynecological Disorders: Asia Pacific Pharmacokinetics Services Market - Revenue and Forecast to 2031 (US$ Million)

Figure 21. Cardiovascular Diseases: Asia Pacific Pharmacokinetics Services Market - Revenue and Forecast to 2031 (US$ Million)

Figure 22. Respiratory Disorders: Asia Pacific Pharmacokinetics Services Market - Revenue and Forecast to 2031 (US$ Million)

Figure 23. Others: Asia Pacific Pharmacokinetics Services Market - Revenue and Forecast to 2031 (US$ Million)

Figure 24. Asia Pacific Pharmacokinetics Services Market Share (%) - by End User (2023 and 2031)

Figure 25. Pharmaceutical and Biotechnology Companies: Asia Pacific Pharmacokinetics Services Market - Revenue and Forecast to 2031 (US$ Million)

Figure 26. Contract Research Organization: Asia Pacific Pharmacokinetics Services Market - Revenue and Forecast to 2031 (US$ Million)

Figure 27. Others: Asia Pacific Pharmacokinetics Services Market - Revenue and Forecast to 2031 (US$ Million)

Figure 28. Asia Pacific Pharmacokinetics Services Market - Revenue by Key Countries 2023 (US$ Million)

Figure 29. Asia Pacific Pharmacokinetics Services Market Breakdown, by Key Countries, 2023 and 2031 (%)

Figure 30. China: Asia Pacific Pharmacokinetics Services Market - Revenue and Forecast to 2031 (US$ Million)

Figure 31. Japan: Asia Pacific Pharmacokinetics Services Market - Revenue and Forecast to 2031 (US$ Million)

Figure 32. India: Asia Pacific Pharmacokinetics Services Market - Revenue and Forecast to 2031 (US$ Million)

Figure 33. Australia: Asia Pacific Pharmacokinetics Services Market - Revenue and Forecast to 2031 (US$ Million)

Figure 34. South Korea: Asia Pacific Pharmacokinetics Services Market - Revenue and Forecast to 2031 (US$ Million)

Figure 35. Rest of Asia Pacific: Asia Pacific Pharmacokinetics Services Market - Revenue and Forecast to 2031 (US$ Million)

  1. Allucent
  2. Certara Inc.
  3. Charles River Laboratories International Inc
  4. Eurofins Scientific SE
  5. PACIFIC BIOLABS
  6. Parexel International Corp
  7. SGS SA
  8. Shanghai Medicilon Inc.
  9. Thermo Fisher Scientific Inc.
  • Save and reduce time carrying out entry-level research by identifying the growth, size, leading players, and segments in the Asia Pacific pharmacokinetics services market.
  • Highlights key business priorities in order to assist companies to realign their business strategies.
  • The key findings and recommendations highlight crucial progressive industry trends in the Asia Pacific pharmacokinetics services market, thereby allowing players across the value chain to develop effective long-term strategies.
  • Develop/modify business expansion plans by using substantial growth offering developed and emerging markets.
  • Scrutinize in-depth Asia Pacific market trends and outlook coupled with the factors driving the Asia Pacific pharmacokinetics services market, as well as those hindering it.
  • Enhance the decision-making process by understanding the strategies that underpin commercial interest with respect to client products, segmentation, pricing, and distribution.
Report Code
Full Name
Country Name
Email Id
Phone Number
Job Title
Company
Requirement

Note : Your data will never be shared with third parties, however, we may send you information from time to time about our products that may be of interest to you. By submitting your details, you agree to be contacted by us. You may contact us at any time to opt-out.


Purchase Options
Single User License
$3550
$2485
Site License
$4550
$3185
Enterprise License
$5550
$3885