亚太矿业化学品市场预测至 2030 年 - 区域分析 - 按类型 [浮选化学品(起泡剂、絮凝剂、抑制剂、收集剂等)、溶剂萃取剂、研磨助剂等]、矿物类型(贱金属、非金属矿物、贵金属等)和应用(矿物加工、废水处理等)

BMIRE00030199 | Pages: 132 | Chemicals and Materials | Jun 2024 | Type: Regional | Status: Published

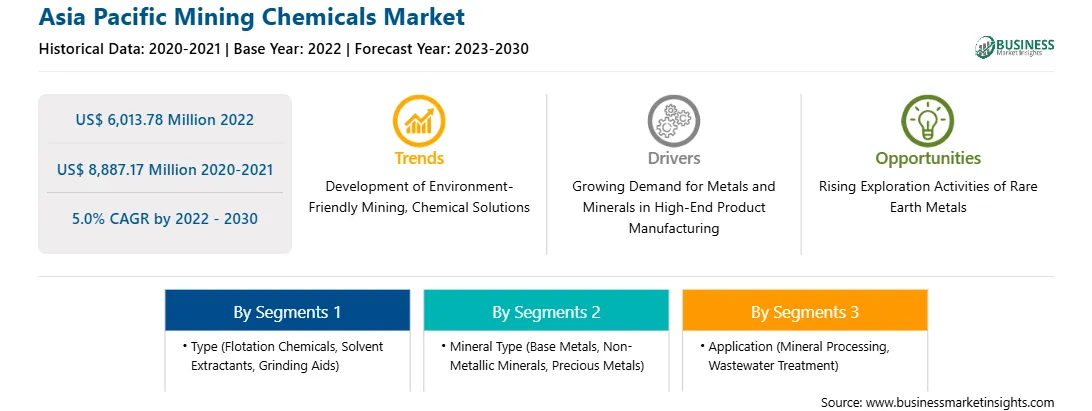
2022 年亚太地区矿业化学品市场价值为 60.1378 亿美元,预计到 2030 年将达到 88.8717 亿美元;预计 2022 年至 2030 年的复合年增长率为 5.0%。

全球采矿业投资和运营增加推动亚太采矿化学品市场发展

全球采矿活动的增加导致对采矿化学品的需求不断增加。此外,采用自动化和数字化等先进采矿技术提高了全球采矿作业的效率和环境可持续性。据世界银行称,到 2050 年,石墨、锂和钴的产量预计将增长约 500%,以满足对清洁能源技术日益增长的需求。

由于发现新的矿藏、基础设施建设不断发展以及对矿产和资源的需求不断增加,该地区的采矿活动正在增加。澳大利亚、中国、捷克共和国、葡萄牙、美国、加拿大等国家的政府和组织正在积极推动勘探和采矿活动。根据绿色金融与发展中心的一份报告,2023 年上半年,中国对金属和采矿业的投资达到 100 亿美元,比 2022 年同期增长 131%。此外,2023 年 10 月,澳大利亚政府向澳大利亚出口融资管理的关键矿产设施额外投资了 39 亿美元。这笔资金旨在支持与澳大利亚 2023-2030 年关键矿产战略相一致的采矿项目。采矿业的扩张活动和不断增加的投资推动了对采矿化学品的需求。

亚太采矿化学品市场概览

亚太地区是三菱综合材料公司、江西铜业有限公司、中国铝业有限公司、印度煤炭有限公司、中国钼业有限公司、必和必拓等主要矿业公司的存在。亚太地区有 10 个主要露天采矿项目——绿色矿山(中国)、桑加塔矿山(印度尼西亚)、黑岱沟矿山(中国)、奥尤陶勒盖铜金矿山(蒙古)、盖夫拉 OC 矿山(印度)、莱帕塘铜矿山(缅甸)、李矿山(泰国)、FTB 项目(泰国)和帕西尔矿山(印度尼西亚)。根据美国地质调查局 2022 年发布的报告,2021 年,中国是全球多个国家 25 种非燃料矿产品的最大供应国。此外,在列出的 25 种矿产中,中国是 16 种关键矿产的生产国。根据挪威国际事务研究所 2022 年的研究,中亚拥有全球 38.6% 的锰矿储量、30.07% 的铬、20% 的铅、12.6% 的锌、8.7% 的钛、5.8% 的铝和 5.3% 的铜。

中国、塔吉克斯坦、澳大利亚、越南等国是全球主要的锑矿生产和储量国。根据奥地利联邦共和国部发布的《2022 年世界矿业数据》报告,2000-2020 年期间,澳大利亚的矿产开采率增长了 142.2%。根据国际能源署的数据,中国公司对关键矿产勘探的投资增加了一倍,尤其是在锂项目上。对采矿化学品的需求与该地区的采矿作业和矿产勘探活动成正比。因此,采矿业务的增长推动了亚太地区对采矿化学品的需求。

亚太矿业化学品市场收入及预测至 2030 年(百万美元)

亚太矿业化学品市场细分

亚太矿业化学品市场根据类型、矿物类型、应用和国家/地区进行细分。

就类型而言,亚太矿业化学品市场细分为浮选化学品、溶剂萃取剂、研磨助剂等。浮选化学品细分市场细分为起泡剂、絮凝剂、抑制剂、收集剂等。浮选化学品细分市场在 2022 年占有最大份额。

按矿物类型,亚太矿业化学品市场细分为贱金属、非金属矿物、贵金属等。非金属矿物细分市场在 2022 年占有最大份额。

就应用而言,亚太矿业化学品市场细分为矿物加工、废水处理等。矿物加工部门在 2022 年占据了最大的份额。

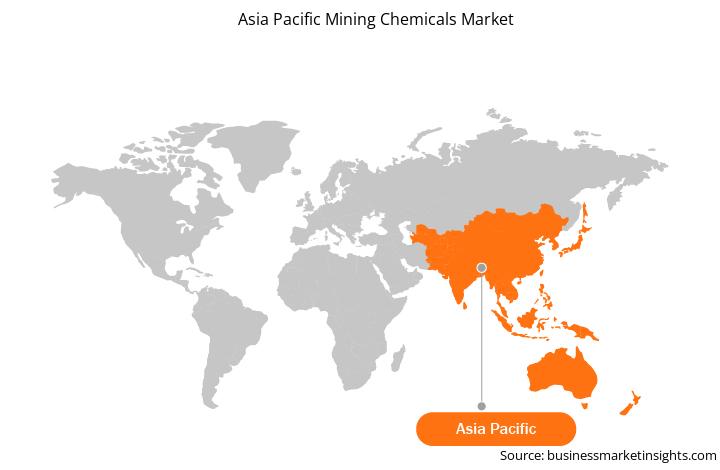
根据国家/地区,亚太采矿化学品市场分为澳大利亚、中国、印度、日本、韩国和亚太其他地区。中国在 2022 年占据了亚太采矿化学品市场的主导地位。

Orica Ltd、Kemira Oyj、BASF SE、Clariant AG、Dow Inc、AECI Ltd、Nouryon Chemicals Holding BV、Solvay SA 和 Arkema SA 是亚太采矿化学品市场的一些领先公司。

Table of Content


1. Introduction

1.1 The Insight Partners Research Report Guidance

1.2 Market Segmentation

2. Executive Summary

2.1 Key Insights

2.2 Market Attractiveness

2.2.1 Market Attractiveness

3. Research Methodology

3.1 Coverage

3.2 Secondary Research

3.3 Primary Research

4. Asia Pacific Mining Chemicals Market Landscape

4.1 Overview

4.2 Porter's Five Forces Analysis

4.2.1 Bargaining Power of Suppliers

4.2.2 Bargaining Power of Buyers

4.2.3 Threat of New Entrants

4.2.4 Competitive Rivalry

4.2.5 Threat of Substitutes

4.3 Ecosystem Analysis

4.3.1 Raw Material Suppliers:

4.3.2 Manufacturers:

4.3.3 Distributors or Suppliers:

4.3.4 End Use Industry:

4.4 List of Vendors in the Value Chain

5. Asia Pacific Mining Chemicals Market - Key Market Dynamics

5.1 Market Drivers

5.1.1 Growing Demand for Metals and Minerals in High-End Product Manufacturing

5.1.2 Increasing Investments and Operations in Global Mining Sector

5.2 Market Restraints

5.2.1 Stringent Government Regulations Related to Hazardous Mining Chemicals

5.3 Market Opportunities

5.3.1 Rising Exploration Activities of Rare Earth Metals

5.4 Future Trends

5.4.1 Development of Environment-Friendly Mining Chemical Solutions

5.5 Impact Analysis

6. Mining Chemicals Market - Asia Pacific Market Analysis

6.1 Asia Pacific Mining Chemicals Market Revenue (US$ Million), 2022 - 2030

6.2 Asia Pacific Mining Chemicals Market Forecast and Analysis

7. Asia Pacific Mining Chemicals Market Analysis - Type

7.1 Flotation Chemicals

7.1.1 Overview

7.1.2 Flotation Chemicals Market Revenue and Forecast to 2030 (US$ Million)

7.1.2.1 Flotation Chemicals Market Volume and Forecast to 2030 (Kilo tons)

7.1.3 Frothers

7.1.3.1 Overview

7.1.3.2 Frothers Market Revenue and Forecast to 2030 (US$ Million)

7.1.3.3 Frothers Market Volume and Forecast to 2030 (Kilo tons)

7.1.4 Flocculants

7.1.4.1 Overview

7.1.4.2 Flocculants Market Revenue and Forecast to 2030 (US$ Million)

7.1.4.3 Flocculants Market Volume and Forecast to 2030 (Kilo tons)

7.1.5 Depressants

7.1.5.1 Overview

7.1.5.2 Depressants Market Revenue and Forecast to 2030 (US$ Million)

7.1.5.3 Depressants Market Volume and Forecast to 2030 (Kilo tons)

7.1.6 Collectors

7.1.6.1 Overview

7.1.6.2 Collectors Market Revenue and Forecast to 2030 (US$ Million)

7.1.6.3 Collectors Market Volume and Forecast to 2030 (Kilo tons)

7.1.7 Others

7.1.7.1 Overview

7.1.7.2 Others Market Revenue and Forecast to 2030 (US$ Million)

7.1.7.3 Others Market Volume and Forecast to 2030 (Kilo tons)

7.2 Solvent Extractants

7.2.1 Overview

7.2.1.1 Solvent Extractants Market Revenue and Forecast to 2030 (US$ Million)

7.2.1.2 Solvent Extractants Market Volume and Forecast to 2030 (Kilo tons)

7.3 Grinding Aids

7.3.1 Overview

7.3.1.1 Grinding Aids Market Revenue and Forecast to 2030 (US$ Million)

7.3.1.2 Grinding Aids Market Volume and Forecast to 2030 (Kilo tons)

7.4 Others

7.4.1 Overview

7.4.1.1 Others Market Revenue and Forecast to 2030 (US$ Million)

7.4.1.2 Others Market Volume and Forecast to 2030 (Kilo tons)

8. Asia Pacific Mining Chemicals Market Analysis - Mineral Type

8.1 Base Metals

8.1.1 Overview

8.1.1.1 Base Metals Market Revenue and Forecast to 2030 (US$ Million)

8.2 Non-Metallic Minerals

8.2.1 Overview

8.2.1.1 Non-metallic minerals Market Revenue and Forecast to 2030 (US$ Million)

8.3 Precious Metals

8.3.1 Overview

8.3.1.1 Precious Metals Market Revenue and Forecast to 2030 (US$ Million)

8.4 Others

8.4.1 Overview

8.4.1.1 Others Market Revenue and Forecast to 2030 (US$ Million)

9. Asia Pacific Mining Chemicals Market Analysis - Application

9.1 Mineral Processing

9.1.1 Overview

9.1.1.1 Mineral Processing Market Revenue and Forecast to 2030 (US$ Million)

9.2 Wastewater Treatment

9.2.1 Overview

9.2.1.1 Wastewater Treatment Market Revenue and Forecast to 2030 (US$ Million)

9.3 Others

9.3.1 Overview

9.3.1.1 Others Market Revenue and Forecast to 2030 (US$ Million)

10. Asia Pacific Mining Chemicals Market - Country Analysis

10.1.1 Asia Pacific Mining Chemicals Market Revenue and Forecasts and Analysis - By Countries

10.1.1.1 Mining Chemicals market Breakdown by Country

10.1.1.2 Australia Mining Chemicals Market Volume and Forecasts to 2030 (Kilo tons)

10.1.1.3 Australia Mining Chemicals Market Revenue and Forecasts to 2030 (US$ Million)

10.1.1.3.1 Australia Mining Chemicals Market Breakdown by Type

10.1.1.3.2 Australia Mining Chemicals Market Breakdown by Type

10.1.1.3.3 Australia Mining Chemicals Market Breakdown by Mineral Type

10.1.1.3.4 Australia Mining Chemicals Market Breakdown by Application

10.1.1.4 China Mining Chemicals Market Volume and Forecasts to 2030 (Kilo tons)

10.1.1.5 China Mining Chemicals Market Revenue and Forecasts to 2030 (US$ Million)

10.1.1.5.1 China Mining Chemicals Market Breakdown by Type

10.1.1.5.2 China Mining Chemicals Market Breakdown by Type

10.1.1.5.3 China Mining Chemicals Market Breakdown by Mineral Type

10.1.1.5.4 China Mining Chemicals Market Breakdown by Application

10.1.1.6 India Mining Chemicals Market Volume and Forecasts to 2030 (Kilo tons)

10.1.1.7 India Mining Chemicals Market Revenue and Forecasts to 2030 (US$ Million)

10.1.1.7.1 India Mining Chemicals Market Breakdown by Type

10.1.1.7.2 India Mining Chemicals Market Breakdown by Type

10.1.1.7.3 India Mining Chemicals Market Breakdown by Mineral Type

10.1.1.7.4 India Mining Chemicals Market Breakdown by Application

10.1.1.8 Japan Mining Chemicals Market Volume and Forecasts to 2030 (Kilo tons)

10.1.1.9 Japan Mining Chemicals Market Revenue and Forecasts to 2030 (US$ Million)

10.1.1.9.1 Japan Mining Chemicals Market Breakdown by Type

10.1.1.9.2 Japan Mining Chemicals Market Breakdown by Type

10.1.1.9.3 Japan Mining Chemicals Market Breakdown by Mineral Type

10.1.1.9.4 Japan Mining Chemicals Market Breakdown by Application

10.1.1.10 South Korea Mining Chemicals Market Volume and Forecasts to 2030 (Kilo tons)

10.1.1.11 South Korea Mining Chemicals Market Revenue and Forecasts to 2030 (US$ Million)

10.1.1.11.1 South Korea Mining Chemicals Market Breakdown by Type

10.1.1.11.2 South Korea Mining Chemicals Market Breakdown by Type

10.1.1.11.3 South Korea Mining Chemicals Market Breakdown by Mineral Type

10.1.1.11.4 South Korea Mining Chemicals Market Breakdown by Application

10.1.1.12 Rest of Asia Pacific Mining Chemicals Market Volume and Forecasts to 2030 (Kilo tons)

10.1.1.13 Rest of Asia Pacific Mining Chemicals Market Revenue and Forecasts to 2030 (US$ Million)

10.1.1.13.1 Rest of Asia Pacific Mining Chemicals Market Breakdown by Type

10.1.1.13.2 Rest of Asia Pacific Mining Chemicals Market Breakdown by Type

10.1.1.13.3 Rest of Asia Pacific Mining Chemicals Market Breakdown by Mineral Type

10.1.1.13.4 Rest of Asia Pacific Mining Chemicals Market Breakdown by Application

11. Industry Landscape

11.1 Overview

11.2 Product launch

11.3 Other Strategies and Developments

12. Company Profiles

12.1 Orica Ltd

12.1.1 Key Facts

12.1.2 Business Description

12.1.3 Products and Services

12.1.4 Financial Overview

12.1.5 SWOT Analysis

12.1.6 Key Developments

12.2 Kemira Oyj

12.2.1 Key Facts

12.2.2 Business Description

12.2.3 Products and Services

12.2.4 Financial Overview

12.2.5 SWOT Analysis

12.2.6 Key Developments

12.3 BASF SE

12.3.1 Key Facts

12.3.2 Business Description

12.3.3 Products and Services

12.3.4 Financial Overview

12.3.5 SWOT Analysis

12.3.6 Key Developments

12.4 Clariant AG

12.4.1 Key Facts

12.4.2 Business Description

12.4.3 Products and Services

12.4.4 Financial Overview

12.4.5 SWOT Analysis

12.4.6 Key Developments

12.5 Dow Inc

12.5.1 Key Facts

12.5.2 Business Description

12.5.3 Products and Services

12.5.4 Financial Overview

12.5.5 SWOT Analysis

12.5.6 Key Developments

12.6 AECI Ltd

12.6.1 Key Facts

12.6.2 Business Description

12.6.3 Products and Services

12.6.4 Financial Overview

12.6.5 SWOT Analysis

12.6.6 Key Developments

12.7 Nouryon Chemicals Holding BV

12.7.1 Key Facts

12.7.2 Business Description

12.7.3 Products and Services

12.7.4 Financial Overview

12.7.5 SWOT Analysis

12.7.6 Key Developments

12.8 Solvay SA

12.8.1 Key Facts

12.8.2 Business Description

12.8.3 Products and Services

12.8.4 Financial Overview

12.8.5 SWOT Analysis

12.8.6 Key Developments

12.9 Arkema SA

12.9.1 Key Facts

12.9.2 Business Description

12.9.3 Products and Services

12.9.4 Financial Overview

12.9.5 SWOT Analysis

12.9.6 Key Developments

13. Appendix

?

List of Tables

Table 1. Asia Pacific Mining Chemicals Market Segmentation

Table 2. List of Raw Material Suppliers

Table 3. Asia Pacific Mining Chemicals Market Revenue and Forecasts to 2030 (US$ Million)

Table 4. Asia Pacific Mining Chemicals Market Volume and Forecasts to 2030 (Kilo tons) - Type

Table 5. Asia Pacific Mining Chemicals Market Revenue and Forecasts to 2030 (US$ Million) - Type

Table 6. Asia Pacific Mining Chemicals Market Revenue and Forecasts to 2030 (US$ Million) - Mineral Type

Table 7. Asia Pacific Mining Chemicals Market Revenue and Forecasts to 2030 (US$ Million) - Application

Table 8. Australia Mining Chemicals Market Volume and Forecasts to 2030 (Kilo tons) - By Type

Table 9. Australia Mining Chemicals Market Revenue and Forecasts to 2030 (US$ Million) - By Type

Table 10. Australia Mining Chemicals Market Revenue and Forecasts to 2030 (US$ Million) - By Mineral Type

Table 11. Australia Mining Chemicals Market Revenue and Forecasts to 2030 (US$ Million) - By Application

Table 12. China Mining Chemicals Market Volume and Forecasts to 2030 (Kilo tons) - By Type

Table 13. China Mining Chemicals Market Revenue and Forecasts to 2030 (US$ Million) - By Type

Table 14. China Mining Chemicals Market Revenue and Forecasts to 2030 (US$ Million) - By Mineral Type

Table 15. China Mining Chemicals Market Revenue and Forecasts to 2030 (US$ Million) - By Application

Table 16. India Mining Chemicals Market Volume and Forecasts to 2030 (Kilo tons) - By Type

Table 17. India Mining Chemicals Market Revenue and Forecasts to 2030 (US$ Million) - By Type

Table 18. India Mining Chemicals Market Revenue and Forecasts to 2030 (US$ Million) - By Mineral Type

Table 19. India Mining Chemicals Market Revenue and Forecasts to 2030 (US$ Million) - By Application

Table 20. Japan Mining Chemicals Market Volume and Forecasts to 2030 (Kilo tons) - By Type

Table 21. Japan Mining Chemicals Market Revenue and Forecasts to 2030 (US$ Million) - By Type

Table 22. Japan Mining Chemicals Market Revenue and Forecasts to 2030 (US$ Million) - By Mineral Type

Table 23. Japan Mining Chemicals Market Revenue and Forecasts to 2030 (US$ Million) - By Application

Table 24. South Korea Mining Chemicals Market Revenue and Forecasts to 2030 (US$ Million) - By Type

Table 25. South Korea Mining Chemicals Market Revenue and Forecasts to 2030 (US$ Million) - By Type

Table 26. South Korea Mining Chemicals Market Revenue and Forecasts to 2030 (US$ Million) - By Mineral Type

Table 27. South Korea Mining Chemicals Market Revenue and Forecasts to 2030 (US$ Million) - By Application

Table 28. Rest of Asia Pacific Mining Chemicals Market Volume and Forecasts to 2030 (Kilo tons) - By Type

Table 29. Rest of Asia Pacific Mining Chemicals Market Revenue and Forecasts to 2030 (US$ Million) - By Type

Table 30. Rest of Asia Pacific Mining Chemicals Market Revenue and Forecasts to 2030 (US$ Million) - By Mineral Type

Table 31. Rest of Asia Pacific Mining Chemicals Market Revenue and Forecasts to 2030 (US$ Million) - By Application

?

List of Figures

Figure 1. Asia Pacific Mining Chemicals Market Segmentation, By Country

Figure 2. Porter's Five Forces Analysis

Figure 3. Ecosystem: Asia Pacific Mining Chemicals Market

Figure 4. Asia Pacific Mining Chemicals Market Impact Analysis of Drivers and Restraints

Figure 5. Asia Pacific Mining Chemicals Market Revenue (US$ Million), 2022 - 2030

Figure 6. Asia Pacific Mining Chemicals Market Share (%) - Type, 2022 and 2030

Figure 7. Flotation Chemicals Market Revenue and Forecasts to 2030 (US$ Million)

Figure 8. Flotation Chemicals Market Volume and Forecasts to 2030 (Kilo tons)

Figure 9. Frothers Market Revenue and Forecasts to 2030 (US$ Million)

Figure 10. Frothers Market Volume and Forecasts to 2030 (Kilo tons)

Figure 11. Flocculants Market Revenue and Forecasts to 2030 (US$ Million)

Figure 12. Flocculants Market Volume and Forecasts to 2030 (Kilo tons)

Figure 13. Depressants Market Revenue and Forecasts to 2030 (US$ Million)

Figure 14. Depressants Market Volume and Forecasts to 2030 (Kilo tons)

Figure 15. Collectors Market Revenue and Forecasts to 2030 (US$ Million)

Figure 16. Collectors Market Volume and Forecasts to 2030 (Kilo tons)

Figure 17. Others Market Revenue and Forecasts to 2030 (US$ Million)

Figure 18. Others Market Volume and Forecasts to 2030 (Kilo tons)

Figure 19. Solvent Extractants Market Revenue and Forecasts to 2030 (US$ Million)

Figure 20. Solvent Extractants Market Volume and Forecasts to 2030 (Kilo tons)

Figure 21. Grinding Aids Market Revenue and Forecasts to 2030 (US$ Million)

Figure 22. Grinding Aids Market Volume and Forecasts to 2030 (Kilo tons)

Figure 23. Others Market Revenue and Forecasts to 2030 (US$ Million)

Figure 24. Others Market Volume and Forecasts to 2030 (Kilo tons)

Figure 25. Asia Pacific Mining Chemicals Market Share (%) - Mineral Type, 2022 and 2030

Figure 26. Base Metals Market Revenue and Forecasts to 2030 (US$ Million)

Figure 27. Non-Metallic Minerals Market Revenue and Forecasts to 2030 (US$ Million)

Figure 28. Precious Metals Market Revenue and Forecasts to 2030 (US$ Million)

Figure 29. Others Market Revenue and Forecasts to 2030 (US$ Million)

Figure 30. Asia Pacific Mining Chemicals Market Share (%) - Application, 2022 and 2030

Figure 31. Mineral Processing Market Revenue and Forecasts to 2030 (US$ Million)

Figure 32. Wastewater Treatment Market Revenue and Forecasts to 2030 (US$ Million)

Figure 33. Others Market Revenue and Forecasts to 2030 (US$ Million)

Figure 34. Asia Pacific Mining Chemicals Market Breakdown, by Key Countries, 2022 (US$)

Figure 35. Mining Chemicals market Breakdown by Key Countries, 2022 and 2030 (%)

Figure 36. Australia Mining Chemicals Market Volume and Forecasts to 2030 (Kilo tons)

Figure 37. Australia Mining Chemicals Market Revenue and Forecasts to 2030 (US$ Million)

Figure 38. China Mining Chemicals Market Volume and Forecasts to 2030 (Kilo tons)

Figure 39. China Mining Chemicals Market Revenue and Forecasts to 2030 (US$ Million)

Figure 40. India Mining Chemicals Market Volume and Forecasts to 2030 (Kilo tons)

Figure 41. India Mining Chemicals Market Revenue and Forecasts to 2030 (US$ Million)

Figure 42. Japan Mining Chemicals Market Volume and Forecasts to 2030 (Kilo tons)

Figure 43. Japan Mining Chemicals Market Revenue and Forecasts to 2030 (US$ Million)

Figure 44. South Korea Mining Chemicals Market Volume and Forecasts to 2030 (Kilo tons)

Figure 45. South Korea Mining Chemicals Market Revenue and Forecasts to 2030 (US$ Million)

Figure 46. Rest of Asia Pacific Mining Chemicals Market Volume and Forecasts to 2030 (Kilo tons)

Figure 47. Rest of Asia Pacific Mining Chemicals Market Revenue and Forecasts to 2030 (US$ Million)


1. Orica Ltd

2. Kemira Oyj

3. BASF SE

4. Clariant AG

5. Dow Inc

6. AECI Ltd

7. Nouryon Chemicals Holding BV

8. Solvay SA

9. Arkema SA

  • Save and reduce time carrying out entry-level research by identifying the growth, size, leading players, and segments in the Asia Pacific mining chemicals market.
  • Highlights key business priorities in order to assist companies to realign their business strategies.
  • The key findings and recommendations highlight crucial progressive industry trends in Asia Pacific mining chemicals market, thereby allowing players across the value chain to develop effective long-term strategies.
  • Develop/modify business expansion plans by using substantial growth offering developed and emerging markets.
  • Scrutinize in-depth Asia Pacific market trends and outlook coupled with the factors driving the market, as well as those hindering it.
  • Enhance the decision-making process by understanding the strategies that underpin security interest with respect to client products, segmentation, pricing, and distribution.
Report Code
Full Name
Country Name
Email Id
Phone Number
Job Title
Company
Requirement

Note : Your data will never be shared with third parties, however, we may send you information from time to time about our products that may be of interest to you. By submitting your details, you agree to be contacted by us. You may contact us at any time to opt-out.


Purchase Options
Single User License
$3550
$2485
Site License
$4550
$3185
Enterprise License
$5550
$3885