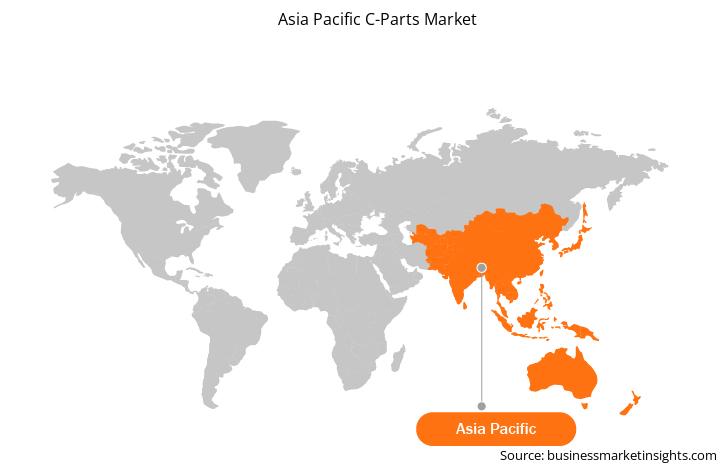
亚太地区 C 部件市场规模和预测(2021-2031 年)、趋势和增长机会分析报告范围:按产品类型(紧固件、轴承等)、最终用途行业(汽车、航空航天和国防、能源和电力、半导体等)、材料类型(钢/不锈钢、塑料/复合材料、铸铁、钢合金等)和国家/地区

BMIRE00030867 | Pages: 130 | Manufacturing and Construction | Sep 2024 | Status: Published

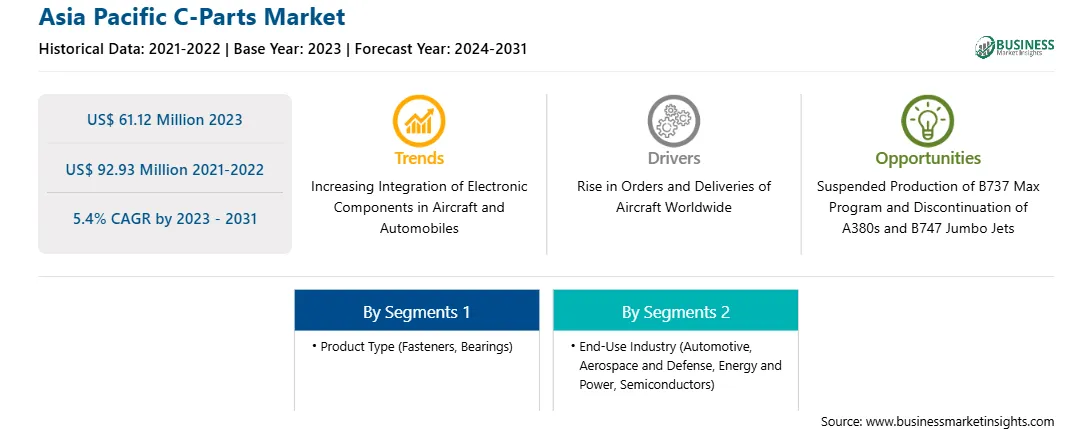
预计到 2031 年,亚太地区 C 部件市场规模将从 2023 年的 6112 万美元增至 9293 万美元。预计该市场在 2023-2031 年期间的复合年增长率为 5.4%。飞机和汽车中电子元件的日益集成可能会在未来几年为亚太地区 C 部件市场带来新的趋势。

汽车和飞机中电子元件集成度的提高是未来几年可能推动亚太地区 C 部件市场发展的主要趋势之一。

此外,电动汽车和电动飞机的推出是另一个可能在不久的将来推动市场对 C 部件需求的主要因素。此外,对飞机改装和汽车电气化的需求也可能支持未来几年 C 部件的增长。

航空电子设备、电子飞行器 (EFB)、ADAS 和其他类型的电子和显示系统等组件的部署需求,进一步产生了整个航空航天和汽车行业对 C 部件的需求。

此外,电动汽车的日益普及为汽车行业带来了一个新的细分市场,以满足新类别的客户需求。电动汽车的工程/生产也产生了对电子元件集成的需求,从而促进了塑料/复合紧固件和铝紧固件的使用,以避免车辆传感器受到磁干扰。

根据产品类型,亚太地区 C 部件市场细分为紧固件、轴承和其他。紧固件部分进一步细分为螺母、螺栓、螺钉、垫圈和其他紧固件部分在 2023 年亚太 C 部件市场中占有最大份额。

轴承是亚太 C 部件市场的主要部件之一,在每个使用机械机器的行业中都有使用。轴承通过平滑轴或相关结构之间的动力转换来支持旋转运动。轴承主要有两种类型——滚珠轴承和滚子轴承。此外,滚珠轴承通过使用金属球来减少旋转摩擦并支撑径向和轴向载荷。滚珠轴承主要有四种类型:深沟球轴承、角接触球轴承、自调心球轴承和推力球轴承。

其他部分包括墙塞、垫片和电缆扎带。塞子主要用于在墙上钻螺丝。插头是塑料插入件,用于将螺钉固定在墙壁结构中,以支撑任何其他结构(仅靠墙壁中的螺钉无法支撑)的重量。垫片是薄金属片,用于填充不同表面之间的小空间。电缆扎带(也称为扎带、电线扎带或拉链扎带)用于将电线固定在一起。电缆扎带用于整理不同级别的电线和电缆。电缆扎带的主要应用包括车辆、飞机、直升机、电子设备、工业设备、电子机器等。

1.           Introduction

1.1       The Insight Partners Research Report Guidance

1.2       Market Segmentation

2.           Executive Summary

2.1       Key Insights

2.2       Market Attractiveness

3.           Research Methodology

3.1       Secondary Research

3.2       Primary Research

3.2.1         Hypothesis formulation:

3.2.2         Macro-economic factor analysis:

3.2.3         Developing base number:

3.2.4         Data Triangulation:

3.2.5         Country level data:

4.           Asia Pacific C-Parts Market Landscape

4.1       Overview

4.2       PEST Analysis

4.3       Ecosystem Analysis

4.3.1         Raw Material Suppliers

4.3.2         C-Parts Manufacturers

4.3.3         End Users

4.3.4         List of Vendors in the Value Chain

5.           Asia Pacific C-Parts Market – Key Market Dynamics

5.1       Asia Pacific C-Parts Market – Key Market Dynamics

5.2       Market Drivers

5.2.1         Rise in Orders and Deliveries of Aircraft Worldwide

5.2.2         Surge in Automotive Production Across Asia Pacific Countries

5.3       Market Restraints

5.3.1         Suspended Production of B737 Max Program and Discontinuation of A380s and B747 Jumbo Jets

5.3.2         Increasing Use of Composite Parts in Various Industries

5.4       Market Opportunities

5.4.1         Growing Global Aircraft Fleet Size

5.5       Future Trends

5.5.1         Increasing Integration of Electronic Components in Aircraft and Automobiles

5.6       Impact of Drivers and Restraints:

6.           Asia Pacific C-Parts Market Analysis

6.1       Asia Pacific C-Parts Market Revenue (US$ Billion), 2021–2031

6.2       Asia Pacific C-Parts Market Forecast and Analysis

7.           Asia Pacific C-Parts Market Analysis – by Product Type

7.1       Fasteners

7.1.1         Overview

7.1.2         Fasteners: Asia Pacific C-Parts Market – Revenue and Forecast to 2031 (US$ Billion)

7.1.3         Fasteners Market, by Type

7.2       Bearings

7.2.1         Overview

7.2.2         Bearings: Asia Pacific C-Parts Market – Revenue and Forecast to 2031 (US$ Billion)

7.3       Others

7.3.1         Overview

7.3.2         Others: Asia Pacific C-Parts Market – Revenue and Forecast to 2031 (US$ Billion)

8.           Asia Pacific C-Parts Market Analysis – by End-use Industry

8.1       Automotive

8.1.1         Overview

8.1.2         Automotive: Asia Pacific C-Parts Market – Revenue and Forecast to 2031 (US$ Billion)

8.2       Aerospace and Defense

8.2.1         Overview

8.2.2         Aerospace and Defense: Asia Pacific C-Parts Market – Revenue and Forecast to 2031 (US$ Billion)

8.3       Energy and Power

8.3.1         Overview

8.3.2         Energy and Power: Asia Pacific C-Parts Market – Revenue and Forecast to 2031 (US$ Billion)

8.4       Semiconductors

8.4.1         Overview

8.4.2         Semiconductors: Asia Pacific C-Parts Market – Revenue and Forecast to 2031 (US$ Billion)

8.5       Others

8.5.1         Overview

8.5.2         Others: Asia Pacific C-Parts Market – Revenue and Forecast to 2031 (US$ Billion)

9.           Asia Pacific C-Parts Market Analysis – by Material Type

9.1       Steel/Stainless Steel

9.1.1         Overview

9.1.2         Steel/Stainless Steel: Asia Pacific C-Parts Market – Revenue and Forecast to 2031 (US$ Billion)

9.2       Plastic/Composites

9.2.1         Overview

9.2.2         Plastic/Composites: Asia Pacific C-Parts Market – Revenue and Forecast to 2031 (US$ Billion)

9.3       Cast Iron

9.3.1         Overview

9.3.2         Cast Iron: Asia Pacific C-Parts Market – Revenue and Forecast to 2031 (US$ Billion)

9.4       Steel Alloys

9.4.1         Overview

9.4.2         Steel Alloys: Asia Pacific C-Parts Market – Revenue and Forecast to 2031 (US$ Billion)

9.5       Others

9.5.1         Overview

9.5.2         Others: Asia Pacific C-Parts Market – Revenue and Forecast to 2031 (US$ Billion)

10.        Asia Pacific C-Parts Market – Country Analysis

10.1     Asia Pacific

10.1.1       Asia Pacific C-Parts Market Breakdown by Countries

10.1.2       Asia Pacific C-Parts Market Revenue and Forecast and Analysis – by Country

10.1.2.1          Asia Pacific C-Parts Market Revenue and Forecast and Analysis – by Country

10.1.2.2          Australia: Asia Pacific C-Parts Market – Revenue and Forecast to 2031 (US$ Billion)

10.1.2.2.1        Australia: Asia Pacific C-Parts Market Breakdown by Product Type

10.1.2.2.1.1      Australia: Asia Pacific C-Parts Market Breakdown by Fasteners

10.1.2.2.2        Australia: Asia Pacific C-Parts Market Breakdown by End-use Industry

10.1.2.2.3        Australia: Asia Pacific C-Parts Market Breakdown by Material Type

10.1.2.3          China: Asia Pacific C-Parts Market – Revenue and Forecast to 2031 (US$ Billion)

10.1.2.3.1        China: Asia Pacific C-Parts Market Breakdown by Product Type

10.1.2.3.1.1      China: Asia Pacific C-Parts Market Breakdown by Fasteners

10.1.2.3.2        China: Asia Pacific C-Parts Market Breakdown by End-use Industry

10.1.2.3.3        China: Asia Pacific C-Parts Market Breakdown by Material Type

10.1.2.4          India: Asia Pacific C-Parts Market – Revenue and Forecast to 2031 (US$ Billion)

10.1.2.4.1        India: Asia Pacific C-Parts Market Breakdown by Product Type

10.1.2.4.1.1      India: Asia Pacific C-Parts Market Breakdown by Fasteners

10.1.2.4.2        India: Asia Pacific C-Parts Market Breakdown by End-use Industry

10.1.2.4.3        India: Asia Pacific C-Parts Market Breakdown by Material Type

10.1.2.5          Japan: Asia Pacific C-Parts Market – Revenue and Forecast to 2031 (US$ Billion)

10.1.2.5.1        Japan: Asia Pacific C-Parts Market Breakdown by Product Type

10.1.2.5.1.1      Japan: Asia Pacific C-Parts Market Breakdown by Fasteners

10.1.2.5.2        Japan: Asia Pacific C-Parts Market Breakdown by End-use Industry

10.1.2.5.3        Japan: Asia Pacific C-Parts Market Breakdown by Material Type

10.1.2.6          South Korea: Asia Pacific C-Parts Market – Revenue and Forecast to 2031 (US$ Billion)

10.1.2.6.1        South Korea: Asia Pacific C-Parts Market Breakdown by Product Type

10.1.2.6.1.1      South Korea: Asia Pacific C-Parts Market Breakdown by Fasteners

10.1.2.6.2        South Korea: Asia Pacific C-Parts Market Breakdown by End-use Industry

10.1.2.6.3        South Korea: Asia Pacific C-Parts Market Breakdown by Material Type

10.1.2.7          Singapore: Asia Pacific C-Parts Market – Revenue and Forecast to 2031 (US$ Billion)

10.1.2.7.1        Singapore: Asia Pacific C-Parts Market Breakdown by Product Type

10.1.2.7.1.1      Singapore: Asia Pacific C-Parts Market Breakdown by Fasteners

10.1.2.7.2        Singapore: Asia Pacific C-Parts Market Breakdown by End-use Industry

10.1.2.7.3        Singapore: Asia Pacific C-Parts Market Breakdown by Material Type

10.1.2.8          Thailand: Asia Pacific C-Parts Market – Revenue and Forecast to 2031 (US$ Billion)

10.1.2.8.1        Thailand: Asia Pacific C-Parts Market Breakdown by Product Type

10.1.2.8.1.1      Thailand: Asia Pacific C-Parts Market Breakdown by Fasteners

10.1.2.8.2        Thailand: Asia Pacific C-Parts Market Breakdown by End-use Industry

10.1.2.8.3        Thailand: Asia Pacific C-Parts Market Breakdown by Material Type

10.1.2.9          Vietnam: Asia Pacific C-Parts Market – Revenue and Forecast to 2031 (US$ Billion)

10.1.2.9.1        Vietnam: Asia Pacific C-Parts Market Breakdown by Product Type

10.1.2.9.1.1      Vietnam: Asia Pacific C-Parts Market Breakdown by Fasteners

10.1.2.9.2        Vietnam: Asia Pacific C-Parts Market Breakdown by End-use Industry

10.1.2.9.3        Vietnam: Asia Pacific C-Parts Market Breakdown by Material Type

10.1.2.10       Indonesia: Asia Pacific C-Parts Market – Revenue and Forecast to 2031 (US$ Billion)

10.1.2.10.1     Indonesia: Asia Pacific C-Parts Market Breakdown by Product Type

10.1.2.10.1.1    Indonesia: Asia Pacific C-Parts Market Breakdown by Fasteners

10.1.2.10.2     Indonesia: Asia Pacific C-Parts Market Breakdown by End-use Industry

10.1.2.10.3     Indonesia: Asia Pacific C-Parts Market Breakdown by Material Type

10.1.2.11       Rest of APAC: Asia Pacific C-Parts Market – Revenue and Forecast to 2031 (US$ Billion)

10.1.2.11.1     Rest of APAC: Asia Pacific C-Parts Market Breakdown by Product Type

10.1.2.11.1.1    Rest of APAC: Asia Pacific C-Parts Market Breakdown by Fasteners

10.1.2.11.2     Rest of APAC: Asia Pacific C-Parts Market Breakdown by End-use Industry

10.1.2.11.3     Rest of APAC: Asia Pacific C-Parts Market Breakdown by Material Type

11.        Competitive Landscape

11.1     Heat Map Analysis by Key Players

11.2     Company Positioning & Concentration

12.        Industry Landscape

12.1     Overview

12.2     Market Initiative

12.3     Product Development

12.4     Mergers & Acquisitions

13.        Company Profiles

13.1     Fastenal Co

13.1.1       Key Facts

13.1.2       Business Description

13.1.3       Products and Services

13.1.4       Financial Overview

13.1.5       SWOT Analysis

13.1.6       Key Developments

13.2     W W Grainger Inc

13.2.1       Key Facts

13.2.2       Business Description

13.2.3       Products and Services

13.2.4       Financial Overview

13.2.5       SWOT Analysis

13.2.6       Key Developments

13.3     ERIKS

13.3.1       Key Facts

13.3.2       Business Description

13.3.3       Products and Services

13.3.4       Financial Overview

13.3.5       SWOT Analysis

13.3.6       Key Developments

13.4     RS Group Plc

13.4.1       Key Facts

13.4.2       Business Description

13.4.3       Products and Services

13.4.4       Financial Overview

13.4.5       SWOT Analysis

13.4.6       Key Developments

13.5     Kaman Corp

13.5.1       Key Facts

13.5.2       Business Description

13.5.3       Products and Services

13.5.4       Financial Overview

13.5.5       SWOT Analysis

13.5.6       Key Developments

13.6     Würth Industrie Service GmbH & Co. KG

13.6.1       Key Facts

13.6.2       Business Description

13.6.3       Products and Services

13.6.4       Financial Overview

13.6.5       SWOT Analysis

13.6.6       Key Developments

13.7     Ningbo yi pian hong fastener Co., Ltd

13.7.1       Key Facts

13.7.2       Business Description

13.7.3       Products and Services

13.7.4       Financial Overview

13.7.5       SWOT Analysis

13.7.6       Key Developments

13.8     Bossard Holding AG

13.8.1       Key Facts

13.8.2       Business Description

13.8.3       Products and Services

13.8.4       Financial Overview

13.8.5       SWOT Analysis

13.8.6       Key Developments

13.9     MCMASTER-CARR

13.9.1       Key Facts

13.9.2       Business Description

13.9.3       Products and Services

13.9.4       Financial Overview

13.9.5       SWOT Analysis

13.9.6       Key Developments

13.10  Fabory Nederland B.V.

13.10.1    Key Facts

13.10.2    Business Description

13.10.3    Products and Services

13.10.4    Financial Overview

13.10.5    SWOT Analysis

13.10.6    Key Developments

13.11  Bailey International LLC

13.11.1    Key Facts

13.11.2    Business Description

13.11.3    Products and Services

13.11.4    Financial Overview

13.11.5    SWOT Analysis

13.11.6    Key Developments

13.12  Exim & Mfr Enterprise

13.12.1    Key Facts

13.12.2    Business Description

13.12.3    Products and Services

13.12.4    Financial Overview

13.12.5    SWOT Analysis

13.12.6    Key Developments

14.        Appendix

14.1     About The Insight Partners


List of Tables

Table 1.             Asia Pacific C-Parts Market Segmentation

Table 2.             List of Vendors

Table 3.             Asia Pacific C-Parts Market – Revenue and Forecast to 2031 (US$ Billion)

Table 4.             Asia Pacific C-Parts Market – Revenue and Forecast to 2031 (US$ Billion) – by Product Type

Table 5.             Asia Pacific C-Parts Market, by Fastener Type – Revenue and Forecast to 2031 (USD Million)

Table 6.             Asia Pacific C-Parts Market – Revenue and Forecast to 2031 (US$ Billion) – by End-use Industry

Table 7.             Asia Pacific C-Parts Market – Revenue and Forecast to 2031 (US$ Billion) – by Material Type

Table 8.             Asia Pacific C-Parts Market – Revenue and Forecast to 2031 (US$ Billion) – by Country

Table 9.             Australia: Asia Pacific C-Parts Market – Revenue and Forecast to 2031 (US$ Billion) – by Product Type

Table 10.          Australia: Asia Pacific C-Parts Market – Revenue and Forecast to 2031 (US$ Billion) – by Fasteners

Table 11.          Australia: Asia Pacific C-Parts Market – Revenue and Forecast to 2031 (US$ Billion) – by End-use Industry

Table 12.          Australia: Asia Pacific C-Parts Market – Revenue and Forecast to 2031 (US$ Billion) – by Material Type

Table 13.          China: Asia Pacific C-Parts Market – Revenue and Forecast to 2031 (US$ Billion) – by Product Type

Table 14.          China: Asia Pacific C-Parts Market – Revenue and Forecast to 2031 (US$ Billion) – by Fasteners

Table 15.          China: Asia Pacific C-Parts Market – Revenue and Forecast to 2031 (US$ Billion) – by End-use Industry

Table 16.          China: Asia Pacific C-Parts Market – Revenue and Forecast to 2031 (US$ Billion) – by Material Type

Table 17.          India: Asia Pacific C-Parts Market – Revenue and Forecast to 2031 (US$ Billion) – by Product Type

Table 18.          India: Asia Pacific C-Parts Market – Revenue and Forecast to 2031 (US$ Billion) – by Fasteners

Table 19.          India: Asia Pacific C-Parts Market – Revenue and Forecast to 2031 (US$ Billion) – by End-use Industry

Table 20.          India: Asia Pacific C-Parts Market – Revenue and Forecast to 2031 (US$ Billion) – by Material Type

Table 21.          Japan: Asia Pacific C-Parts Market – Revenue and Forecast to 2031 (US$ Billion) – by Product Type

Table 22.          Japan: Asia Pacific C-Parts Market – Revenue and Forecast to 2031 (US$ Billion) – by Fasteners

Table 23.          Japan: Asia Pacific C-Parts Market – Revenue and Forecast to 2031 (US$ Billion) – by End-use Industry

Table 24.          Japan: Asia Pacific C-Parts Market – Revenue and Forecast to 2031 (US$ Billion) – by Material Type

Table 25.          South Korea: Asia Pacific C-Parts Market – Revenue and Forecast to 2031 (US$ Billion) – by Product Type

Table 26.          South Korea: Asia Pacific C-Parts Market – Revenue and Forecast to 2031 (US$ Billion) – by Fasteners

Table 27.          South Korea: Asia Pacific C-Parts Market – Revenue and Forecast to 2031 (US$ Billion) – by End-use Industry

Table 28.          South Korea: Asia Pacific C-Parts Market – Revenue and Forecast to 2031 (US$ Billion) – by Material Type

Table 29.          Singapore: Asia Pacific C-Parts Market – Revenue and Forecast to 2031 (US$ Billion) – by Product Type

Table 30.          Singapore: Asia Pacific C-Parts Market – Revenue and Forecast to 2031 (US$ Billion) – by Fasteners

Table 31.          Singapore: Asia Pacific C-Parts Market – Revenue and Forecast to 2031 (US$ Billion) – by End-use Industry

Table 32.          Singapore: Asia Pacific C-Parts Market – Revenue and Forecast to 2031 (US$ Billion) – by Material Type

Table 33.          Thailand: Asia Pacific C-Parts Market – Revenue and Forecast to 2031 (US$ Billion) – by Product Type

Table 34.          Thailand: Asia Pacific C-Parts Market – Revenue and Forecast to 2031 (US$ Billion) – by Fasteners

Table 35.          Thailand: Asia Pacific C-Parts Market – Revenue and Forecast to 2031 (US$ Billion) – by End-use Industry

Table 36.          Thailand: Asia Pacific C-Parts Market – Revenue and Forecast to 2031 (US$ Billion) – by Material Type

Table 37.          Vietnam: Asia Pacific C-Parts Market – Revenue and Forecast to 2031 (US$ Billion) – by Product Type

Table 38.          Vietnam: Asia Pacific C-Parts Market – Revenue and Forecast to 2031 (US$ Billion) – by Fasteners

Table 39.          Vietnam: Asia Pacific C-Parts Market – Revenue and Forecast to 2031 (US$ Billion) – by End-use Industry

Table 40.          Vietnam: Asia Pacific C-Parts Market – Revenue and Forecast to 2031 (US$ Billion) – by Material Type

Table 41.          Indonesia: Asia Pacific C-Parts Market – Revenue and Forecast to 2031 (US$ Billion) – by Product Type

Table 42.          Indonesia: Asia Pacific C-Parts Market – Revenue and Forecast to 2031 (US$ Billion) – by Fasteners

Table 43.          Indonesia: Asia Pacific C-Parts Market – Revenue and Forecast to 2031 (US$ Billion) – by End-use Industry

Table 44.          Indonesia: Asia Pacific C-Parts Market – Revenue and Forecast to 2031 (US$ Billion) – by Material Type

Table 45.          Rest of APAC: Asia Pacific C-Parts Market – Revenue and Forecast to 2031 (US$ Billion) – by Product Type

Table 46.          Rest of APAC: Asia Pacific C-Parts Market – Revenue and Forecast to 2031 (US$ Billion) – by Fasteners

Table 47.          Rest of APAC: Asia Pacific C-Parts Market – Revenue and Forecast to 2031 (US$ Billion) – by End-use Industry

Table 48.          Rest of APAC: Asia Pacific C-Parts Market – Revenue and Forecast to 2031 (US$ Billion) – by Material Type


List of Figures

Figure 1.           Asia Pacific C-Parts Market Segmentation, by Country

Figure 2.           PEST Analysis

Figure 3.           Impact Analysis of Drivers and Restraints

Figure 4.           Asia Pacific C-Parts Market Revenue (US$ Billion), 2021–2031

Figure 5.           Asia Pacific C-Parts Market Share (%) – by Product Type, 2023 and 2031

Figure 6.           Fasteners: Asia Pacific C-Parts Market – Revenue and Forecast to 2031 (US$ Billion)

Figure 7.           Bearings: Asia Pacific C-Parts Market – Revenue and Forecast to 2031 (US$ Billion)

Figure 8.           Others: Asia Pacific C-Parts Market – Revenue and Forecast to 2031 (US$ Billion)

Figure 9.           Asia Pacific C-Parts Market Share (%) – by End-use Industry, 2023 and 2031

Figure 10.        Automotive: Asia Pacific C-Parts Market – Revenue and Forecast to 2031 (US$ Billion)

Figure 11.        Aerospace and Defense: Asia Pacific C-Parts Market – Revenue and Forecast to 2031 (US$ Billion)

Figure 12.        Energy and Power: Asia Pacific C-Parts Market – Revenue and Forecast to 2031 (US$ Billion)

Figure 13.        Semiconductors: Asia Pacific C-Parts Market – Revenue and Forecast to 2031 (US$ Billion)

Figure 14.        Others: Asia Pacific C-Parts Market – Revenue and Forecast to 2031 (US$ Billion)

Figure 15.        Asia Pacific C-Parts Market Share (%) – by Material Type, 2023 and 2031

Figure 16.        Steel/Stainless Steel: Asia Pacific C-Parts Market – Revenue and Forecast to 2031 (US$ Billion)

Figure 17.        Plastic/Composites: Asia Pacific C-Parts Market – Revenue and Forecast to 2031 (US$ Billion)

Figure 18.        Cast Iron: Asia Pacific C-Parts Market – Revenue and Forecast to 2031 (US$ Billion)

Figure 19.        Steel Alloys: Asia Pacific C-Parts Market – Revenue and Forecast to 2031 (US$ Billion)

Figure 20.        Others: Asia Pacific C-Parts Market – Revenue and Forecast to 2031 (US$ Billion)

Figure 21.        Asia Pacific C-Parts Market Breakdown by Key Countries, 2023 and 2031 (%)

Figure 22.        Australia: Asia Pacific C-Parts Market – Revenue and Forecast to 2031 (US$ Billion)

Figure 23.        China: Asia Pacific C-Parts Market – Revenue and Forecast to 2031 (US$ Billion)

Figure 24.        India: Asia Pacific C-Parts Market – Revenue and Forecast to 2031 (US$ Billion)

Figure 25.        Japan: Asia Pacific C-Parts Market – Revenue and Forecast to 2031 (US$ Billion)

Figure 26.        South Korea: Asia Pacific C-Parts Market – Revenue and Forecast to 2031 (US$ Billion)

Figure 27.        Singapore: Asia Pacific C-Parts Market – Revenue and Forecast to 2031 (US$ Billion)

Figure 28.        Thailand: Asia Pacific C-Parts Market – Revenue and Forecast to 2031 (US$ Billion)

Figure 29.        Vietnam: Asia Pacific C-Parts Market – Revenue and Forecast to 2031 (US$ Billion)

Figure 30.        Indonesia: Asia Pacific C-Parts Market – Revenue and Forecast to 2031 (US$ Billion)

Figure 31.        Rest of APAC: Asia Pacific C-Parts Market – Revenue and Forecast to 2031 (US$ Billion)

Figure 32.        Heat Map Analysis by Key Players

Figure 33.        Company Positioning & Concentration

  • Fastenal Co
  • W W Grainger Inc
  • ERIKS
  • RS Group Plc
  • Kaman Group
  • Würth Industrie Service GmbH & Co. KG
  • Ningbo yi pian hong fastener Co., Ltd
  • Bossard Holding AG
  • MCMASTER-CARR
  • Fabory Nederland B.V.
  • Save and reduce time carrying out entrylevel research by identifying the growth, size, leading players, and segments in the aerial firefighting market.
  •  Highlights key business priorities in order to assist companies to realign their business strategies
  •  The key findings and recommendations highlight crucial progressive industry trends in the aerial firefighting market, thereby allowing players across the value chain to develop effective longterm strategies
  •  Develop/modify business expansion plans by using substantial growth offering developed and emerging markets
  •  Scrutinize indepth global market trends and outlook coupled with the factors driving the market, as well as those hindering it
  •  Enhance the decisionmaking process by understanding the strategies that underpin commercial interest with respect to client products, segmentation, pricing and distribution
Report Code
Full Name
Country Name
Email Id
Phone Number
Job Title
Company
Requirement

Note : Your data will never be shared with third parties, however, we may send you information from time to time about our products that may be of interest to you. By submitting your details, you agree to be contacted by us. You may contact us at any time to opt-out.


Purchase Options
Single User License
$3550
$2485
Site License
$4550
$3185
Enterprise License
$5550
$3885