Analysis - by Drug Therapy [Targeted Drug Therapy (Abemaciclib, Ado-Trastuzumab Emtansine, Palbociclib, Trastuzumab, and Other Target Drug Therapies), Hormonal Drug Therapy (Selective Estrogen Receptor Modulators, Aromatase Inhibitors, and Selective Estrogen Receptor Downregulators), Chemotherapy, and Immunotherapy/Biological Therapy], Breast Cancer Type (Hormone Receptor, HER2+, and Triple-Negative Breast Cancer), and Distribution Channel (Hospital Pharmacies, Drug Stores and Retail Pharmacies, and Online Pharmacies)
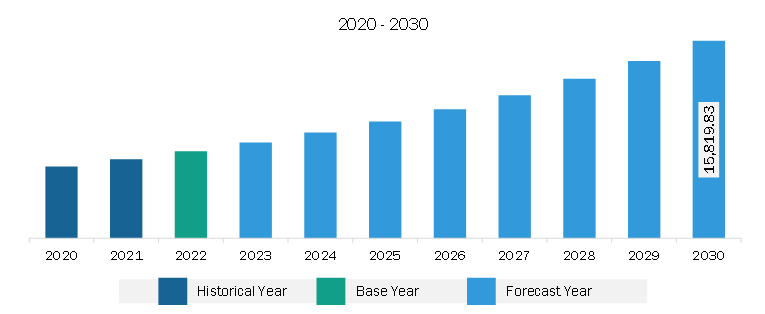
The Asia Pacific breast cancer therapeutics market was valued at US$ 6,986.37 million in 2022 and is expected to reach US$ 15,819.83 million by 2030; it is estimated to grow at a CAGR of 10.8% from 2022 to 2030.
Launch of Several Diagnostics and Screening Programs Fuels the Asia Pacific Breast Cancer Therapeutics Market
Advancements in personalized medicine, immunotherapy, combination therapies, drug delivery systems, liquid biopsies, AI, and patient-centric approaches are expected to shape the future of breast cancer treatment. These trends aim to improve treatment outcomes, reduce side effects, and enhance breast cancer patients overall quality of life.
Early disease detection plays a major role in improving patient outcomes and survival rates. Various organizations and healthcare providers are implementing screening programs to detect breast cancer at an initial stage when it is more treatable. The World Health Organization released a new Global Breast Cancer Initiative Framework in February 2013 that serves as a plan for fulfilling the goal of saving 2.5 million people from breast cancer by 2040. To achieve this, the new Framework, unveiled ahead of the World Cancer Day campaign, urges nations to follow the three pillars of health promotion for early detection, prompt diagnosis, and thorough management of breast cancer. These programs often include mammography, clinical breast exams, and self-breast exams to identify any abnormalities or signs of breast cancer. Implementing these programs has increased awareness and early detection of breast cancer cases, resulting in higher demand for effective therapeutics.
In addition, many advancements in diagnostic technologies have been witnessed across the globe. The National Library of Medicine states that early detection and precise diagnosis are essential for enhancing prognosis. Breast cancer assessment frequently makes use of radiographic imaging modalities such as digital mammography (DM), digital breast tomosynthesis (DBT), magnetic resonance imaging (MRI), ultrasound (US), and nuclear medicine procedures. Histopathology (HP) is the gold standard for determining the presence of cancer. Furthermore, using artificial intelligence (AI) technology to depict medical images quantitatively has significant potential for improving breast cancer segmentation, diagnosis, and prognosis. These technologies help healthcare providers identify the extent and characteristics of the tumor, allowing them to develop personalized treatment plans. Thus, the launch of diagnostic and screening programs, coupled with advancements in diagnostic technologies, contributes to the Asia Pacific breast cancer therapeutics market growth.
Asia Pacific Breast Cancer Therapeutics Market Overview
The breast cancer therapeutics market in Asia Pacific is segmented into China, Japan, India, South Korea, Australia, and the Rest of Asia Pacific. The market growth is attributed to factors including growing burden of breast cancers among women coupled with advancements in personalized medicine, immunotherapy, combination therapies, and drug delivery systems.
The breast cancer therapeutics market in China is projected to witness substantial growth in the coming years, owing to the rising prevalence of breast cancer, increasing aging population, lifestyle changes, and others. China accounted for 24% of cases with new diagnoses and 30% of cancer-related fatalities globally in 2020, as per CDC statistics published on April 14, 2023. Over the last three decades, the age-standardized incidence of breast cancer climbed from 17.07 per 100,000 in 1990 to 35.61 per 100,000 in 2019. Advancements in treatment options have played a crucial role in driving the demand for breast cancer therapeutics in China.
Also, out of 1 in 10 women in Japan will acquire breast cancer at some point. The pink ribbon campaign in October and other initiatives have raised awareness of the disease among Japanese people, including the importance of self-checks and other early detection methods that, when used, increase the survival rate to over 90%. The identification of typical risk variables, however, lags. Thus, the breast cancer therapeutics market in Japan is expected to grow significantly due to an aging population, treatment options, government initiatives and policies, high healthcare expenditure, rising awareness, and technological advancements.
Asia Pacific Breast Cancer Therapeutics Market Revenue and Forecast to 2030 (US$ Million)
Asia Pacific Breast Cancer Therapeutics Market Segmentation
The Asia Pacific breast cancer therapeutics market is segmented based on drug therapy, breast cancer type, and distribution channel.
Based on drug therapy, the Asia Pacific breast cancer therapeutics market is segmented into targeted drug therapy, hormonal drug therapy, chemotherapy, and immunotherapy/ biological therapy. The targeted drug therapy segment held a larger share in 2022. The targeted drug therapy segment held a larger share in 2022. The targeted drug therapy segment is further subsegmented into abemaciclib, ado-trastuzumab emtansine, palbociclib, trastuzumab, and other target drug therapy. Additionally, the hormonal drug therapy segment is categorized into selective estrogen receptor modulators, aromatase inhibitors, and selective estrogen receptor downregulators.
In terms of breast cancer type, the Asia Pacific breast cancer therapeutics market is segmented into hormone receptor, HER2+, and triple-negative breast cancer. The hormone receptor segment held a larger share in 2022.
By distribution channel, the Asia Pacific breast cancer therapeutics market is segmented into hospital pharmacies, drug store and retail pharmacies, and online pharmacies. The hospital pharmacies segment held a larger share in 2022.
Based on country, the Asia Pacific breast cancer therapeutics market is categorized into Australia, China, India, Japan, South Korea, and the Rest of Asia Pacific. China dominated the Asia Pacific breast cancer therapeutics market in 2022.
Eli Lilly and Co, Eisai Co Ltd, Novartis AG, AstraZeneca Plc, Pfizer Inc, Gilead Sciences Inc, Merck & Co Inc, Teva Pharmaceutical Industries Ltd, and Amgen Inc and Amgen Inc are some of the leading companies operating in the Asia Pacific breast cancer therapeutics market.
Asia Pacific Breast Cancer Therapeutics Market Strategic Insights
Get more information on this report
Asia Pacific Breast Cancer Therapeutics Market Segmentation Analysis
Asia Pacific Breast Cancer Therapeutics Market Report Highlights
Asia Pacific Breast Cancer Therapeutics Report Scope
Report Attribute
Details
Market size in 2022
US$ 6,986.37 Million
Market Size by 2030
US$ 15,819.83 Million
CAGR (2022 - 2030)
10.8%
Historical Data
2020-2021
Forecast period
2023-2030
Segments Covered
By Drug Therapy
Targeted Drug Therapy
Hormonal Drug Therapy
Chemotherapy
Immunotherapy/Biological Therapy
By Breast Cancer Type
Hormone Receptor
HER2+
Triple-Negative Breast Cancer
By Distribution Channel
Hospital Pharmacies
Drug Store and Retail Pharmacies
Online Pharmacies
Regions and Countries Covered
Asia-Pacific
China, India, Japan, Australia, Rest of Asia-Pacific
Market leaders and key company profiles
Eli Lilly and Co
Eisai Co Ltd
Novartis AG
AstraZeneca Plc
Pfizer Inc
Gilead Sciences Inc
Merck & Co Inc
Teva Pharmaceutical Industries Ltd
Amgen Inc
Get more information on this report
Asia Pacific Breast Cancer Therapeutics Market Country and Regional Insights
Get more information on this report
Identical Market Reports with other Region/Countries
The List of Companies - Asia Pacific Breast Cancer Therapeutics Market
1. Eli Lilly and Co2. Eisai Co Ltd3. Novartis AG4. AstraZeneca Plc5. Pfizer Inc6. Gilead Sciences Inc7. Merck & Co Inc8. Teva Pharmaceutical Industries Ltd9. Amgen Inc
Frequently Asked Questions
How big is the Asia Pacific Breast Cancer Therapeutics Market?
The Asia Pacific Breast Cancer Therapeutics Market is valued at US$ 6,986.37 Million in 2022, it is projected to reach US$ 15,819.83 Million by 2030.
What is the CAGR for Asia Pacific Breast Cancer Therapeutics Market by (2022 - 2030)?
As per our report Asia Pacific Breast Cancer Therapeutics Market, the market size is valued at US$ 6,986.37 Million in 2022, projecting it to reach US$ 15,819.83 Million by 2030. This translates to a CAGR of approximately 10.8% during the forecast period.
What segments are covered in this report?
The Asia Pacific Breast Cancer Therapeutics Market report typically cover these key segments-
Drug Therapy (Targeted Drug Therapy, Hormonal Drug Therapy, Chemotherapy, Immunotherapy/Biological Therapy)
Breast Cancer Type (Hormone Receptor, HER2+, Triple-Negative Breast Cancer)
Distribution Channel (Hospital Pharmacies, Drug Store and Retail Pharmacies, Online Pharmacies)
What is the historic period, base year, and forecast period taken for Asia Pacific Breast Cancer Therapeutics Market?
The historic period, base year, and forecast period can vary slightly depending on the specific market research report. However, for the Asia Pacific Breast Cancer Therapeutics Market report:
Historic Period : 2020-2021
Base Year : 2022
Forecast Period : 2023-2030
Who are the major players in Asia Pacific Breast Cancer Therapeutics Market?
The Asia Pacific Breast Cancer Therapeutics Market is populated by several key players, each contributing to its growth and innovation. Some of the major players include:
Eli Lilly and Co
Eisai Co Ltd
Novartis AG
AstraZeneca Plc
Pfizer Inc
Gilead Sciences Inc
Merck & Co Inc
Teva Pharmaceutical Industries Ltd
Amgen Inc
Who should buy this report?
The Asia Pacific Breast Cancer Therapeutics Market report is valuable for diverse stakeholders, including:
Investors: Provides insights for investment decisions pertaining to market growth, companies, or industry insights. Helps assess market attractiveness and potential returns.
Industry Players: Offers competitive intelligence, market sizing, and trend analysis to inform strategic planning, product development, and sales strategies.
Suppliers and Manufacturers: Helps understand market demand for components, materials, and services related to concerned industry.
Researchers and Consultants: Provides data and analysis for academic research, consulting projects, and market studies.
Financial Institutions: Helps assess risks and opportunities associated with financing or investing in the concerned market.
Essentially, anyone involved in or considering involvement in the Asia Pacific Breast Cancer Therapeutics Market value chain can benefit from the information contained in a comprehensive market report.


 Get Free Sample For Asia Pacific Breast Cancer Therapeutics Market


