1. Introduction
1.1 Business Market Insights Research Report Guidance
1.2 Market Segmentation
2. Executive Summary
2.1 Key Market Insights
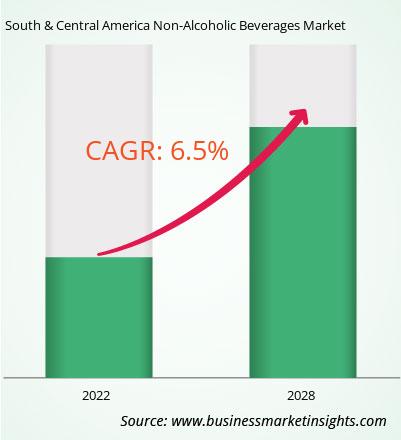
2.2 Market Attractiveness
3. Research Methodology
3.1 Secondary Research
3.2 Primary Research
- 3.2.1 Hypothesis formulation:
- 3.2.2 Macro-economic factor analysis:
- 3.2.3 Developing base number:
- 3.2.4 Data Triangulation:
- 3.2.5 Country level data:
4. South & Central America Non-Alcoholic Beverages Market Landscape
4.1 Market Overview
4.2 Porter's Five Forces Analysis
- 4.2.1 Bargaining Power of Suppliers
- 4.2.2 Bargaining Power of Buyers
- 4.2.3 Threat of New Entrants
- 4.2.4 Competitive Rivalry
- 4.2.5 Threat of Substitutes
4.3 Ecosystem Analysis
- 4.3.1 Raw Material Suppliers
- 4.3.2 Manufacturers
- 4.3.3 Distributors/Suppliers
- 4.3.4 End Users
5. South & Central America Non-Alcoholic Beverages Market – Key Market Dynamics
5.1 Growth Drivers
- 5.1.1 Growing health consciousness
- 5.1.2 Rising demand for alcohol-free alternatives
- 5.1.3 Increased awareness of low-calorie drinks
5.2 Market Opportunities
- 5.2.1 Expansion of flavored and functional drinks
- 5.2.2 Growth in plant-based and organic beverages
- 5.2.3 Rising demand for healthier alternatives
5.3 Future Trends
- 5.3.1 Increasing consumer preference for healthier drinks
- 5.3.2 Demand for plant-based options
- 5.3.3 Growth in alcohol-free beverages
5.4 Impact of Drivers and Restraints
6. South & Central America Non-Alcoholic Beverages Market Regional Analysis
6.1 South & Central America Non-Alcoholic Beverages Market Overview
6.2 South & Central America Non-Alcoholic Beverages Market Revenue 2020-2028 (US$ Million)
6.3 South & Central America Non-Alcoholic Beverages Market Forecast Analysis
7. South & Central America Non-Alcoholic Beverages Market Analysis – by Type
7.1 Carbonated Soft Drinks
- 7.1.1 Overview
- 7.1.2 Carbonated Soft Drinks: South & Central America Non-Alcoholic Beverages Market – Revenue and Forecast to 2031 (US$ Million)
7.2 Juices & Nectars
- 7.2.1 Overview
- 7.2.2 Juices & Nectars: South & Central America Non-Alcoholic Beverages Market – Revenue and Forecast to 2031 (US$ Million)
7.3 Bottled Waters
- 7.3.1 Overview
- 7.3.2 Bottled Waters: South & Central America Non-Alcoholic Beverages Market – Revenue and Forecast to 2031 (US$ Million)
7.4 Dairy-Based Beverages
- 7.4.1 Overview
- 7.4.2 Dairy-Based Beverages: South & Central America Non-Alcoholic Beverages Market – Revenue and Forecast to 2031 (US$ Million)
7.5 Dairy Alternative Beverages
- 7.5.1 Overview
- 7.5.2 Dairy Alternative Beverages: South & Central America Non-Alcoholic Beverages Market – Revenue and Forecast to 2031 (US$ Million)
7.6 RTD Tea and Coffee
- 7.6.1 Overview
- 7.6.2 RTD Tea and Coffee: South & Central America Non-Alcoholic Beverages Market – Revenue and Forecast to 2031 (US$ Million)
8. South & Central America Non-Alcoholic Beverages Market Analysis – by Packaging Type
8.1 Bottles
- 8.1.1 Overview
- 8.1.2 Bottles: South & Central America Non-Alcoholic Beverages Market – Revenue and Forecast to 2028 (US$ Million)
8.2 Cartons
- 8.2.1 Overview
- 8.2.2 Cartons: South & Central America Non-Alcoholic Beverages Market – Revenue and Forecast to 2028 (US$ Million)
8.3 Cans
- 8.3.1 Overview
- 8.3.2 Cans: South & Central America Non-Alcoholic Beverages Market – Revenue and Forecast to 2028 (US$ Million)
8.4 Pouches
- 8.4.1 Overview
- 8.4.2 Pouches: South & Central America Non-Alcoholic Beverages Market – Revenue and Forecast to 2028 (US$ Million)
9. South & Central America Non-Alcoholic Beverages Market Analysis – by Category
9.1 Sugar-Free
- 9.1.1 Overview
- 9.1.2 Pouches: South & Central America Non-Alcoholic Beverages Market – Revenue and Forecast to 2028 (US$ Million)
9.2 Conventional
- 9.2.1 Overview
- 9.2.2 Pouches: South & Central America Non-Alcoholic Beverages Market – Revenue and Forecast to 2028 (US$ Million)
10. South & Central America Non-Alcoholic Beverages Market – South and Central America Analysis
10.1 South and Central America
- 10.1.1 South & Central America Non-Alcoholic Beverages Market Breakdown, by Key
Country, 2023 and 2028 (%)
- 10.1.1.1 South & Central America Non-Alcoholic Beverages Market – Revenue and
Forecast Analysis – by Country
- 10.1.1.1 Brazil:
South & Central America Non-Alcoholic Beverages Market – Revenue and Forecast to 2028 (US$ Million)
- 10.1.1.1.1 Brazil: South & Central America Non-Alcoholic Beverages Market Breakdown, by Type
- 10.1.1.1.2 Brazil: South & Central America Non-Alcoholic Beverages Market Breakdown, by Packaging Type
- 10.1.1.1.3 Brazil: South & Central America Non-Alcoholic Beverages Market Breakdown, by Category
- 10.1.1.2 Argentina:
South & Central America Non-Alcoholic Beverages Market – Revenue and Forecast to 2028 (US$ Million)
- 10.1.1.2.1 Argentina: South & Central America Non-Alcoholic Beverages Market Breakdown, by Type
- 10.1.1.2.2 Argentina: South & Central America Non-Alcoholic Beverages Market Breakdown, by Packaging Type
- 10.1.1.2.3 Argentina: South & Central America Non-Alcoholic Beverages Market Breakdown, by Category
- 10.1.1.3 Rest of South and Central America :
South & Central America Non-Alcoholic Beverages Market – Revenue and Forecast to 2028 (US$ Million)
- 10.1.1.3.1 Rest of South and Central America : South & Central America Non-Alcoholic Beverages Market Breakdown, by Type
- 10.1.1.3.2 Rest of South and Central America : South & Central America Non-Alcoholic Beverages Market Breakdown, by Packaging Type
- 10.1.1.3.3 Rest of South and Central America : South & Central America Non-Alcoholic Beverages Market Breakdown, by Category
11. Competitive Landscape
11.1 Heat Map Analysis
11.2 Company Positioning and Concentration
12. South & Central America Non-Alcoholic Beverages Market Industry Landscape
12.1 Overview
12.2 Mergers and Acquisitions
12.3 Agreements, Collaborations, and Joint Ventures
12.4 New Product Launches
12.5 Expansions and Other Strategic Developments
13. Company Profiles
13.1 Asahi Group Holdings, Ltd.
- 13.1.1 Key Facts
- 13.1.2 Business Description
- 13.1.3 Products and Services
- 13.1.4 Financial Overview
- 13.1.5 SWOT Analysis
- 13.1.6 Key Developments
13.2 Bolthouse Farms, Inc.
- 13.2.1 Key Facts
- 13.2.2 Business Description
- 13.2.3 Products and Services
- 13.2.4 Financial Overview
- 13.2.5 SWOT Analysis
- 13.2.6 Key Developments
13.3 Califia Farms, LLC
- 13.3.1 Key Facts
- 13.3.2 Business Description
- 13.3.3 Products and Services
- 13.3.4 Financial Overview
- 13.3.5 SWOT Analysis
- 13.3.6 Key Developments
13.4 Danone S.A.
- 13.4.1 Key Facts
- 13.4.2 Business Description
- 13.4.3 Products and Services
- 13.4.4 Financial Overview
- 13.4.5 SWOT Analysis
- 13.4.6 Key Developments
13.5 Keurig Dr Pepper, Inc.
- 13.5.1 Key Facts
- 13.5.2 Business Description
- 13.5.3 Products and Services
- 13.5.4 Financial Overview
- 13.5.5 SWOT Analysis
- 13.5.6 Key Developments
13.6 Nestlé S.A.
- 13.6.1 Key Facts
- 13.6.2 Business Description
- 13.6.3 Products and Services
- 13.6.4 Financial Overview
- 13.6.5 SWOT Analysis
- 13.6.6 Key Developments
13.7 PepsiCo Inc.
- 13.7.1 Key Facts
- 13.7.2 Business Description
- 13.7.3 Products and Services
- 13.7.4 Financial Overview
- 13.7.5 SWOT Analysis
- 13.7.6 Key Developments
13.8 Red Bull
- 13.8.1 Key Facts
- 13.8.2 Business Description
- 13.8.3 Products and Services
- 13.8.4 Financial Overview
- 13.8.5 SWOT Analysis
- 13.8.6 Key Developments
13.9 SUNTORY HOLDINGS LIMITED.
- 13.9.1 Key Facts
- 13.9.2 Business Description
- 13.9.3 Products and Services
- 13.9.4 Financial Overview
- 13.9.5 SWOT Analysis
- 13.9.6 Key Developments
13.10 The Coca-Cola Company
- 13.10.1 Key Facts
- 13.10.2 Business Description
- 13.10.3 Products and Services
- 13.10.4 Financial Overview
- 13.10.5 SWOT Analysis
- 13.10.6 Key Developments
14. Appendix
14.1 About Business Market Insights


 Get Free Sample For South & Central America Non-Alcoholic Beverages Market

