1. Introduction
1.1 Business Market Insights Research Report Guidance
1.2 Market Segmentation
2. Executive Summary
2.1 Key Market Insights
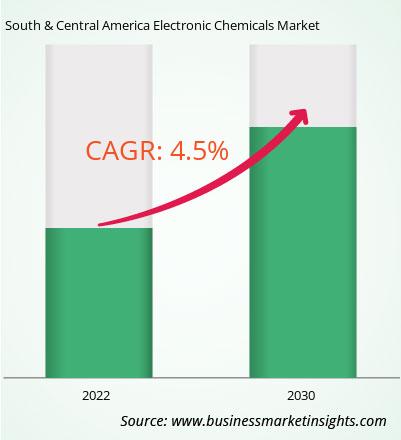
2.2 Market Attractiveness
3. Research Methodology
3.1 Secondary Research
3.2 Primary Research
- 3.2.1 Hypothesis formulation:
- 3.2.2 Macro-economic factor analysis:
- 3.2.3 Developing base number:
- 3.2.4 Data Triangulation:
- 3.2.5 Country level data:
4. South & Central America Electronic Chemicals Market Landscape
4.1 Market Overview
4.2 Porter's Five Forces Analysis
- 4.2.1 Bargaining Power of Suppliers
- 4.2.2 Bargaining Power of Buyers
- 4.2.3 Threat of New Entrants
- 4.2.4 Competitive Rivalry
- 4.2.5 Threat of Substitutes
4.3 Ecosystem Analysis
- 4.3.1 Raw Material Suppliers
- 4.3.2 Manufacturers
- 4.3.3 Distributors/Suppliers
- 4.3.4 End Users
5. South & Central America Electronic Chemicals Market – Key Market Dynamics
5.1 Growth Drivers
- 5.1.1 Growth of Semiconductor Industry
- 5.1.2 Rising Demand for Flat-Panel Displays
5.2 Market Opportunities
- 5.2.1 Emerging Applications in Renewable Energy
5.3 Future Trends
- 5.3.1 Adoption of Nanotechnology in Electronic Devices
5.4 Impact of Drivers and Restraints
6. South & Central America Electronic Chemicals Market Regional Analysis
6.1 South & Central America Electronic Chemicals Market Overview
6.2 South & Central America Electronic Chemicals Market Revenue 2020-2030 (US$ Million)
6.3 South & Central America Electronic Chemicals Market Forecast Analysis
7. South & Central America Electronic Chemicals Market Analysis – by Product Type
7.1 CMP Slurries
- 7.1.1 Overview
- 7.1.2 CMP Slurries: South & Central America Electronic Chemicals Market – Revenue and Forecast to 2031 (US$ Million)
7.2 Photoresist Chemicals
- 7.2.1 Overview
- 7.2.2 Photoresist Chemicals: South & Central America Electronic Chemicals Market – Revenue and Forecast to 2031 (US$ Million)
7.3 Wet Chemicals
- 7.3.1 Overview
- 7.3.2 Wet Chemicals: South & Central America Electronic Chemicals Market – Revenue and Forecast to 2031 (US$ Million)
7.4 Acids
- 7.4.1 Overview
- 7.4.2 Acids: South & Central America Electronic Chemicals Market – Revenue and Forecast to 2031 (US$ Million)
8. South & Central America Electronic Chemicals Market Analysis – by End Use
8.1 Semiconductors
- 8.1.1 Overview
- 8.1.2 Semiconductors: South & Central America Electronic Chemicals Market – Revenue and Forecast to 2030 (US$ Million)
8.2 Flat Panel Displays
- 8.2.1 Overview
- 8.2.2 Flat Panel Displays: South & Central America Electronic Chemicals Market – Revenue and Forecast to 2030 (US$ Million)
8.3 Printed Circuit Boards
- 8.3.1 Overview
- 8.3.2 Printed Circuit Boards: South & Central America Electronic Chemicals Market – Revenue and Forecast to 2030 (US$ Million)
8.4 Photovoltaics
- 8.4.1 Overview
- 8.4.2 Photovoltaics: South & Central America Electronic Chemicals Market – Revenue and Forecast to 2030 (US$ Million)
9. South & Central America Electronic Chemicals Market – South and Central America Analysis
9.1 South and Central America
- 9.1.1 South & Central America Electronic Chemicals Market Breakdown, by Key
Country, 2023 and 2030 (%)
- 9.1.1.1 South & Central America Electronic Chemicals Market – Revenue and
Forecast Analysis – by Country
- 9.1.1.1 Brazil:
South & Central America Electronic Chemicals Market – Revenue and Forecast to 2030 (US$ Million)
- 9.1.1.1.1 Brazil: South & Central America Electronic Chemicals Market Breakdown, by Product Type
- 9.1.1.1.2 Brazil: South & Central America Electronic Chemicals Market Breakdown, by End Use
- 9.1.1.2 Argentina:
South & Central America Electronic Chemicals Market – Revenue and Forecast to 2030 (US$ Million)
- 9.1.1.2.1 Argentina: South & Central America Electronic Chemicals Market Breakdown, by Product Type
- 9.1.1.2.2 Argentina: South & Central America Electronic Chemicals Market Breakdown, by End Use
- 9.1.1.3 Rest of South and Central America :
South & Central America Electronic Chemicals Market – Revenue and Forecast to 2030 (US$ Million)
- 9.1.1.3.1 Rest of South and Central America : South & Central America Electronic Chemicals Market Breakdown, by Product Type
- 9.1.1.3.2 Rest of South and Central America : South & Central America Electronic Chemicals Market Breakdown, by End Use
10. Competitive Landscape
10.1 Heat Map Analysis
10.2 Company Positioning and Concentration
11. South & Central America Electronic Chemicals Market Industry Landscape
11.1 Overview
11.2 Mergers and Acquisitions
11.3 Agreements, Collaborations, and Joint Ventures
11.4 New Product Launches
11.5 Expansions and Other Strategic Developments
12. Company Profiles
12.1 FUJIFILM Holdings Corp
- 12.1.1 Key Facts
- 12.1.2 Business Description
- 12.1.3 Products and Services
- 12.1.4 Financial Overview
- 12.1.5 SWOT Analysis
- 12.1.6 Key Developments
12.2 Hitachi High-Tech Corp
- 12.2.1 Key Facts
- 12.2.2 Business Description
- 12.2.3 Products and Services
- 12.2.4 Financial Overview
- 12.2.5 SWOT Analysis
- 12.2.6 Key Developments
12.3 Solvay SA
- 12.3.1 Key Facts
- 12.3.2 Business Description
- 12.3.3 Products and Services
- 12.3.4 Financial Overview
- 12.3.5 SWOT Analysis
- 12.3.6 Key Developments
12.4 BASF SE
- 12.4.1 Key Facts
- 12.4.2 Business Description
- 12.4.3 Products and Services
- 12.4.4 Financial Overview
- 12.4.5 SWOT Analysis
- 12.4.6 Key Developments
12.5 Linde Plc
- 12.5.1 Key Facts
- 12.5.2 Business Description
- 12.5.3 Products and Services
- 12.5.4 Financial Overview
- 12.5.5 SWOT Analysis
- 12.5.6 Key Developments
12.6 Honeywell International Inc
- 12.6.1 Key Facts
- 12.6.2 Business Description
- 12.6.3 Products and Services
- 12.6.4 Financial Overview
- 12.6.5 SWOT Analysis
- 12.6.6 Key Developments
13. Appendix
13.1 About Business Market Insights


 Get Free Sample For South & Central America Electronic Chemicals Market

