1. Introduction
1.1 Business Market Insights Research Report Guidance
1.2 Market Segmentation
2. Executive Summary
2.1 Key Market Insights
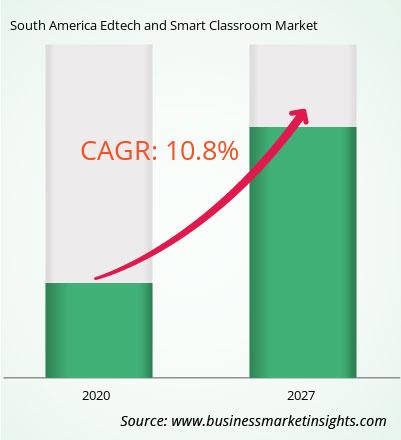
2.2 Market Attractiveness
3. Research Methodology
3.1 Secondary Research
3.2 Primary Research
- 3.2.1 Hypothesis formulation:
- 3.2.2 Macro-economic factor analysis:
- 3.2.3 Developing base number:
- 3.2.4 Data Triangulation:
- 3.2.5 Country level data:
4. South America Edtech and Smart Classroom Market Landscape
4.1 Market Overview
4.2 Porter's Five Forces Analysis
- 4.2.1 Bargaining Power of Suppliers
- 4.2.2 Bargaining Power of Buyers
- 4.2.3 Threat of New Entrants
- 4.2.4 Competitive Rivalry
- 4.2.5 Threat of Substitutes
4.3 Ecosystem Analysis
- 4.3.1 Raw Material Suppliers
- 4.3.2 Manufacturers
- 4.3.3 Distributors/Suppliers
- 4.3.4 End Users
5. South America Edtech and Smart Classroom Market – Key Market Dynamics
5.1 Growth Drivers
- 5.1.1 Rise in mobile penetration increasing investment in edtech and e learning
5.2 Market Opportunities
- 5.2.1 Increasing user enegagement demand
5.3 Future Trends
- 5.3.1 Growing technological use in the education industry
5.4 Impact of Drivers and Restraints
6. South America Edtech and Smart Classroom Market Regional Analysis
6.1 South America Edtech and Smart Classroom Market Overview
6.2 South America Edtech and Smart Classroom Market Revenue 2017-2027 (US$ Million)
6.3 South America Edtech and Smart Classroom Market Forecast Analysis
7. South America Edtech and Smart Classroom Market Analysis – by Component
7.1 Hardware
- 7.1.1 Overview
- 7.1.2 Hardware: South America Edtech and Smart Classroom Market – Revenue and Forecast to 2031 (US$ Million)
7.2 Software
- 7.2.1 Overview
- 7.2.2 Software: South America Edtech and Smart Classroom Market – Revenue and Forecast to 2031 (US$ Million)
7.3 Services
- 7.3.1 Overview
- 7.3.2 Services: South America Edtech and Smart Classroom Market – Revenue and Forecast to 2031 (US$ Million)
8. South America Edtech and Smart Classroom Market Analysis – by Deployment Type
8.1 On-Premises
- 8.1.1 Overview
- 8.1.2 On-Premises: South America Edtech and Smart Classroom Market – Revenue and Forecast to 2027 (US$ Million)
8.2 Cloud
- 8.2.1 Overview
- 8.2.2 Cloud: South America Edtech and Smart Classroom Market – Revenue and Forecast to 2027 (US$ Million)
8.3 Hybrid
- 8.3.1 Overview
- 8.3.2 Hybrid: South America Edtech and Smart Classroom Market – Revenue and Forecast to 2027 (US$ Million)
9. South America Edtech and Smart Classroom Market Analysis – by End-User
9.1 Upto K-12
- 9.1.1 Overview
- 9.1.2 Hybrid: South America Edtech and Smart Classroom Market – Revenue and Forecast to 2027 (US$ Million)
9.2 Higher Education
- 9.2.1 Overview
- 9.2.2 Hybrid: South America Edtech and Smart Classroom Market – Revenue and Forecast to 2027 (US$ Million)
10. South America Edtech and Smart Classroom Market – South and Central America Analysis
10.1 South and Central America
- 10.1.1 South America Edtech and Smart Classroom Market Breakdown, by Key
Country, 2020 and 2027 (%)
- 10.1.1.1 South America Edtech and Smart Classroom Market – Revenue and
Forecast Analysis – by Country
- 10.1.1.1 Brazil:
South America Edtech and Smart Classroom Market – Revenue and Forecast to 2027 (US$ Million)
- 10.1.1.1.1 Brazil: South America Edtech and Smart Classroom Market Breakdown, by Component
- 10.1.1.1.2 Brazil: South America Edtech and Smart Classroom Market Breakdown, by Deployment Type
- 10.1.1.1.3 Brazil: South America Edtech and Smart Classroom Market Breakdown, by End-User
- 10.1.1.2 Argentina:
South America Edtech and Smart Classroom Market – Revenue and Forecast to 2027 (US$ Million)
- 10.1.1.2.1 Argentina: South America Edtech and Smart Classroom Market Breakdown, by Component
- 10.1.1.2.2 Argentina: South America Edtech and Smart Classroom Market Breakdown, by Deployment Type
- 10.1.1.2.3 Argentina: South America Edtech and Smart Classroom Market Breakdown, by End-User
- 10.1.1.3 Rest of South and Central America :
South America Edtech and Smart Classroom Market – Revenue and Forecast to 2027 (US$ Million)
- 10.1.1.3.1 Rest of South and Central America : South America Edtech and Smart Classroom Market Breakdown, by Component
- 10.1.1.3.2 Rest of South and Central America : South America Edtech and Smart Classroom Market Breakdown, by Deployment Type
- 10.1.1.3.3 Rest of South and Central America : South America Edtech and Smart Classroom Market Breakdown, by End-User
11. Competitive Landscape
11.1 Heat Map Analysis
11.2 Company Positioning and Concentration
12. South America Edtech and Smart Classroom Market Industry Landscape
12.1 Overview
12.2 Mergers and Acquisitions
12.3 Agreements, Collaborations, and Joint Ventures
12.4 New Product Launches
12.5 Expansions and Other Strategic Developments
13. Company Profiles
13.1 Apple Inc.
- 13.1.1 Key Facts
- 13.1.2 Business Description
- 13.1.3 Products and Services
- 13.1.4 Financial Overview
- 13.1.5 SWOT Analysis
- 13.1.6 Key Developments
13.2 Blackboard Inc.
- 13.2.1 Key Facts
- 13.2.2 Business Description
- 13.2.3 Products and Services
- 13.2.4 Financial Overview
- 13.2.5 SWOT Analysis
- 13.2.6 Key Developments
13.3 Cisco Systems, Inc.
- 13.3.1 Key Facts
- 13.3.2 Business Description
- 13.3.3 Products and Services
- 13.3.4 Financial Overview
- 13.3.5 SWOT Analysis
- 13.3.6 Key Developments
13.4 IBM Corporation
- 13.4.1 Key Facts
- 13.4.2 Business Description
- 13.4.3 Products and Services
- 13.4.4 Financial Overview
- 13.4.5 SWOT Analysis
- 13.4.6 Key Developments
13.5 Microsoft Corporation
- 13.5.1 Key Facts
- 13.5.2 Business Description
- 13.5.3 Products and Services
- 13.5.4 Financial Overview
- 13.5.5 SWOT Analysis
- 13.5.6 Key Developments
13.6 Oracle Corporation
- 13.6.1 Key Facts
- 13.6.2 Business Description
- 13.6.3 Products and Services
- 13.6.4 Financial Overview
- 13.6.5 SWOT Analysis
- 13.6.6 Key Developments
13.7 SAP SE
- 13.7.1 Key Facts
- 13.7.2 Business Description
- 13.7.3 Products and Services
- 13.7.4 Financial Overview
- 13.7.5 SWOT Analysis
- 13.7.6 Key Developments
14. Appendix
14.1 About Business Market Insights


 Get Free Sample For South America Edtech and Smart Classroom Market

