1. Introduction
1.1 Business Market Insights Research Report Guidance
1.2 Market Segmentation
2. Executive Summary
2.1 Key Market Insights
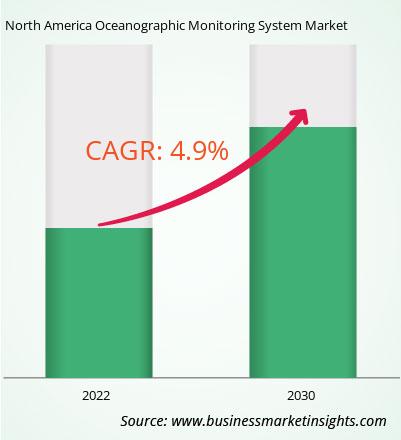
2.2 Market Attractiveness
3. Research Methodology
3.1 Secondary Research
3.2 Primary Research
- 3.2.1 Hypothesis formulation:
- 3.2.2 Macro-economic factor analysis:
- 3.2.3 Developing base number:
- 3.2.4 Data Triangulation:
- 3.2.5 Country level data:
4. North America Oceanographic Monitoring System Market Landscape
4.1 Market Overview
4.2 Porter's Five Forces Analysis
- 4.2.1 Bargaining Power of Suppliers
- 4.2.2 Bargaining Power of Buyers
- 4.2.3 Threat of New Entrants
- 4.2.4 Competitive Rivalry
- 4.2.5 Threat of Substitutes
4.3 Ecosystem Analysis
- 4.3.1 Raw Material Suppliers
- 4.3.2 Manufacturers
- 4.3.3 Distributors/Suppliers
- 4.3.4 End Users
5. North America Oceanographic Monitoring System Market – Key Market Dynamics
5.1 Growth Drivers
- 5.1.1 Growing Use of Oceanographic Monitoring Systems for Monitoring Sea Levels
5.2 Market Opportunities
- 5.2.1 Growing Deployment of Ocean Underwater Observatories
5.3 Future Trends
- 5.3.1 Incorporation of autonomous underwater vehicles and unmanned surface vehicles for collecting oceanographic data
5.4 Impact of Drivers and Restraints
6. North America Oceanographic Monitoring System Market Regional Analysis
6.1 North America Oceanographic Monitoring System Market Overview
6.2 North America Oceanographic Monitoring System Market Revenue 2020-2030 (US$ Million)
6.3 North America Oceanographic Monitoring System Market Forecast Analysis
7. North America Oceanographic Monitoring System Market Analysis – by Type
7.1 Sensors
- 7.1.1 Overview
- 7.1.2 Sensors: North America Oceanographic Monitoring System Market – Revenue and Forecast to 2031 (US$ Million)
7.2 Underwater Communication System
- 7.2.1 Overview
- 7.2.2 Underwater Communication System: North America Oceanographic Monitoring System Market – Revenue and Forecast to 2031 (US$ Million)
7.3 Buoys Observation Monitoring System
- 7.3.1 Overview
- 7.3.2 Buoys Observation Monitoring System: North America Oceanographic Monitoring System Market – Revenue and Forecast to 2031 (US$ Million)
8. North America Oceanographic Monitoring System Market Analysis – by Application
8.1 Onshore
- 8.1.1 Overview
- 8.1.2 Onshore: North America Oceanographic Monitoring System Market – Revenue and Forecast to 2030 (US$ Million)
8.2 Offshore
- 8.2.1 Overview
- 8.2.2 Offshore: North America Oceanographic Monitoring System Market – Revenue and Forecast to 2030 (US$ Million)
9. North America Oceanographic Monitoring System Market – North America Analysis
9.1 North America
- 9.1.1 North America Oceanographic Monitoring System Market Breakdown, by Key
Country, 2023 and 2030 (%)
- 9.1.1.1 North America Oceanographic Monitoring System Market – Revenue and
Forecast Analysis – by Country
- 9.1.1.1 US:
North America Oceanographic Monitoring System Market – Revenue and Forecast to 2030 (US$ Million)
- 9.1.1.1.1 US: North America Oceanographic Monitoring System Market Breakdown, by Type
- 9.1.1.1.2 US: North America Oceanographic Monitoring System Market Breakdown, by Application
- 9.1.1.2 Canada:
North America Oceanographic Monitoring System Market – Revenue and Forecast to 2030 (US$ Million)
- 9.1.1.2.1 Canada: North America Oceanographic Monitoring System Market Breakdown, by Type
- 9.1.1.2.2 Canada: North America Oceanographic Monitoring System Market Breakdown, by Application
- 9.1.1.3 Mexico :
North America Oceanographic Monitoring System Market – Revenue and Forecast to 2030 (US$ Million)
- 9.1.1.3.1 Mexico : North America Oceanographic Monitoring System Market Breakdown, by Type
- 9.1.1.3.2 Mexico : North America Oceanographic Monitoring System Market Breakdown, by Application
10. Competitive Landscape
10.1 Heat Map Analysis
10.2 Company Positioning and Concentration
11. North America Oceanographic Monitoring System Market Industry Landscape
11.1 Overview
11.2 Mergers and Acquisitions
11.3 Agreements, Collaborations, and Joint Ventures
11.4 New Product Launches
11.5 Expansions and Other Strategic Developments
12. Company Profiles
12.1 AXYS Technologies Inc.
- 12.1.1 Key Facts
- 12.1.2 Business Description
- 12.1.3 Products and Services
- 12.1.4 Financial Overview
- 12.1.5 SWOT Analysis
- 12.1.6 Key Developments
12.2 GOST Global
- 12.2.1 Key Facts
- 12.2.2 Business Description
- 12.2.3 Products and Services
- 12.2.4 Financial Overview
- 12.2.5 SWOT Analysis
- 12.2.6 Key Developments
12.3 MOBILIS
- 12.3.1 Key Facts
- 12.3.2 Business Description
- 12.3.3 Products and Services
- 12.3.4 Financial Overview
- 12.3.5 SWOT Analysis
- 12.3.6 Key Developments
12.4 Neil Brown Ocean Sensors, Inc
- 12.4.1 Key Facts
- 12.4.2 Business Description
- 12.4.3 Products and Services
- 12.4.4 Financial Overview
- 12.4.5 SWOT Analysis
- 12.4.6 Key Developments
12.5 Sea-Bird Scientific
- 12.5.1 Key Facts
- 12.5.2 Business Description
- 12.5.3 Products and Services
- 12.5.4 Financial Overview
- 12.5.5 SWOT Analysis
- 12.5.6 Key Developments
12.6 SERCEL
- 12.6.1 Key Facts
- 12.6.2 Business Description
- 12.6.3 Products and Services
- 12.6.4 Financial Overview
- 12.6.5 SWOT Analysis
- 12.6.6 Key Developments
12.7 Sonardyne
- 12.7.1 Key Facts
- 12.7.2 Business Description
- 12.7.3 Products and Services
- 12.7.4 Financial Overview
- 12.7.5 SWOT Analysis
- 12.7.6 Key Developments
12.8 Trelleborg Marine and Infrastructure
- 12.8.1 Key Facts
- 12.8.2 Business Description
- 12.8.3 Products and Services
- 12.8.4 Financial Overview
- 12.8.5 SWOT Analysis
- 12.8.6 Key Developments
12.9 Xylem
- 12.9.1 Key Facts
- 12.9.2 Business Description
- 12.9.3 Products and Services
- 12.9.4 Financial Overview
- 12.9.5 SWOT Analysis
- 12.9.6 Key Developments
13. Appendix
13.1 About Business Market Insights


 Get Free Sample For North America Oceanographic Monitoring System Market

