No. of Pages: 90 | Report Code: BMIRE00031068 | Category: Manufacturing and Construction
1.1 The Insight Partners Research Report Guidance
1.2 Market Segmentation
2.1 Key Insights
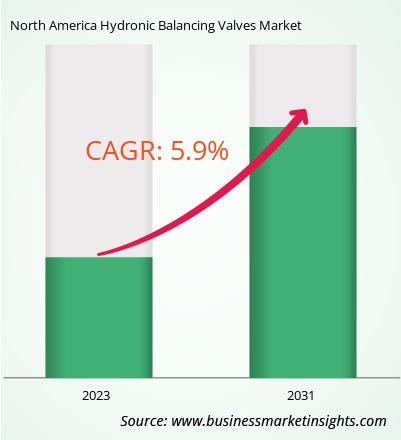
2.2 Market Attractiveness
3.1 Secondary Research
3.2 Primary Research
3.2.1 Hypothesis formulation:
3.2.2 Macro-economic factor analysis:
3.2.3 Developing base number:
3.2.4 Data Triangulation:
3.2.5 Country level data:
4.1 Overview
4.2 Ecosystem Analysis
4.2.1 Raw Materials Suppliers-
4.2.2 Manufacturing and Assembly:
4.2.3 Distribution and Logistics:
4.2.4 End Users:
4.2.5 List of Vendors in the Value Chain
5.1 Market Drivers
5.1.1 Increasing Demand for Energy-efficient Solutions
5.1.2 Growing Application of Hydronic Balancing Valves for HVAC Systems in Oil & Gas Industry
5.1.3 Rising Urbanization Worldwide
5.2 Market Restraints
5.2.1 High Cost of Installation, Repair, and Maintenance of Hydronic Balancing Valves
5.3 Market Opportunities
5.3.1 Integration of Smart Technology into Hydronic Balancing Valves
5.4 Future Trends
5.4.1 Utilization of Sustainable Materials and Components in Public Infrastructure
5.5 Impact of Drivers and Restraints:
6.1 North America Hydronic Balancing Valves Market Revenue (US$ Million), 2021–2031
6.2 North America Hydronic Balancing Valves Market Forecast Analysis
7.1 Static Balancing Valves
7.1.1 Overview
7.1.2 Static Balancing Valves: North America Hydronic Balancing Valves Market – Revenue and Forecast to 2031 (US$ Million)
7.2 Fixed-Orifice Balancing Valves
7.2.1 Overview
7.2.2 Fixed-Orifice Balancing Valves: North America Hydronic Balancing Valves Market – Revenue and Forecast to 2031 (US$ Million)
7.3 Automatic Balancing Valves
7.3.1 Overview
7.3.2 Automatic Balancing Valves: North America Hydronic Balancing Valves Market – Revenue and Forecast to 2031 (US$ Million)
7.4 Pressure-Independent Flow Control Valves
7.4.1 Overview
7.4.2 Pressure-Independent Flow Control Valves: North America Hydronic Balancing Valves Market – Revenue and Forecast to 2031 (US$ Million)
8.1 Flanged
8.1.1 Overview
8.1.2 Flanged: North America Hydronic Balancing Valves Market – Revenue and Forecast to 2031 (US$ Million)
8.2 Threaded
8.2.1 Overview
8.2.2 Threaded: North America Hydronic Balancing Valves Market – Revenue and Forecast to 2031 (US$ Million)
8.3 Others
8.3.1 Overview
8.3.2 Others: North America Hydronic Balancing Valves Market – Revenue and Forecast to 2031 (US$ Million)
9.1 Less than 5 Inches
9.1.1 Overview
9.1.2 Less than 5 Inches: North America Hydronic Balancing Valves Market – Revenue and Forecast to 2031 (US$ Million)
9.2 6-10 Inches
9.2.1 Overview
9.2.2 6-10 Inches: North America Hydronic Balancing Valves Market – Revenue and Forecast to 2031 (US$ Million)
9.3 11-20 Inches
9.3.1 Overview
9.3.2- 20 Inches: North America Hydronic Balancing Valves Market – Revenue and Forecast to 2031 (US$ Million)
9.4 Above 20 Inches
9.4.1 Overview
9.4.2 Above 20 Inches: North America Hydronic Balancing Valves Market – Revenue and Forecast to 2031 (US$ Million)
10.1 Residential
10.1.1 Overview
10.1.2 Residential: North America Hydronic Balancing Valves Market – Revenue and Forecast to 2031 (US$ Million)
10.2 Commercial
10.2.1 Overview
10.2.2 Commercial: North America Hydronic Balancing Valves Market – Revenue and Forecast to 2031 (US$ Million)
10.3 Industrial
10.3.1 Overview
10.3.2 Industrial: North America Hydronic Balancing Valves Market – Revenue and Forecast to 2031 (US$ Million)
11.1 North America
11.1.1 North America Hydronic Balancing Valves Market Breakdown, by Key Countries, 2023 and 2031 (%)
11.1.1.1 North America Hydronic Balancing Valves Market – Revenue and Forecast Analysis – by Country
11.1.1.2 United States: North America Hydronic Balancing Valves Market – Revenue and Forecast to 2031 (US$ Million)
11.1.1.2.1 United States: North America Hydronic Balancing Valves Market Breakdown, by Type
11.1.1.2.2 United States: North America Hydronic Balancing Valves Market Breakdown, by Connection Type
11.1.1.2.3 United States: North America Hydronic Balancing Valves Market Breakdown, by Size
11.1.1.2.4 United States: North America Hydronic Balancing Valves Market Breakdown, by Application
11.1.1.3 Canada: North America Hydronic Balancing Valves Market – Revenue and Forecast to 2031 (US$ Million)
11.1.1.3.1 Canada: North America Hydronic Balancing Valves Market Breakdown, by Type
11.1.1.3.2 Canada: North America Hydronic Balancing Valves Market Breakdown, by Connection Type
11.1.1.3.3 Canada: North America Hydronic Balancing Valves Market Breakdown, by Size
11.1.1.3.4 Canada: North America Hydronic Balancing Valves Market Breakdown, by Application
11.1.1.4 Mexico: North America Hydronic Balancing Valves Market – Revenue and Forecast to 2031 (US$ Million)
11.1.1.4.1 Mexico: North America Hydronic Balancing Valves Market Breakdown, by Type
11.1.1.4.2 Mexico: North America Hydronic Balancing Valves Market Breakdown, by Connection Type
11.1.1.4.3 Mexico: North America Hydronic Balancing Valves Market Breakdown, by Size
11.1.1.4.4 Mexico: North America Hydronic Balancing Valves Market Breakdown, by Application
12.1 Company Positioning & Concentration
12.2 Heat Map Analysis
13.1 Overview
13.2 Market Initiative
13.3 Product Development
13.4 Mergers & Acquisitions
14.1 Danfoss AS
14.1.1 Key Facts
14.1.2 Business Description
14.1.3 Products and Services
14.1.4 Financial Overview
14.1.5 SWOT Analysis
14.1.6 Key Developments
14.2 Johnson Controls International Plc
14.2.1 Key Facts
14.2.2 Business Description
14.2.3 Products and Services
14.2.4 Financial Overview
14.2.5 SWOT Analysis
14.2.6 Key Developments
14.3 Xylem Inc.
14.3.1 Key Facts
14.3.2 Business Description
14.3.3 Products and Services
14.3.4 Financial Overview
14.3.5 SWOT Analysis
14.3.6 Key Developments
14.4 HAYS FLUID CONTROLS
14.4.1 Key Facts
14.4.2 Business Description
14.4.3 Products and Services
14.4.4 Financial Overview
14.4.5 SWOT Analysis
14.4.6 Key Developments
14.5 Victaulic Company
14.5.1 Key Facts
14.5.2 Business Description
14.5.3 Products and Services
14.5.4 Financial Overview
14.5.5 SWOT Analysis
14.5.6 Key Developments
14.6 Red-White Valve Corp.
14.6.1 Key Facts
14.6.2 Business Description
14.6.3 Products and Services
14.6.4 Financial Overview
14.6.5 SWOT Analysis
14.6.6 Key Developments
14.7 Oventrop GmbH & Co. KG
14.7.1 Key Facts
14.7.2 Business Description
14.7.3 Products and Services
14.7.4 Financial Overview
14.7.5 SWOT Analysis
14.7.6 Key Developments
14.8 Caleffi S.p.a.
14.8.1 Key Facts
14.8.2 Business Description
14.8.3 Products and Services
14.8.4 Financial Overview
14.8.5 SWOT Analysis
14.8.6 Key Developments
14.9 Global Flow Products LLC
14.9.1 Key Facts
14.9.2 Business Description
14.9.3 Products and Services
14.9.4 Financial Overview
14.9.5 SWOT Analysis
14.9.6 Key Developments
14.10 Global Flow Products LLC
14.10.1 Key Facts
14.10.2 Business Description
14.10.3 Products and Services
14.10.4 Financial Overview
14.10.5 SWOT Analysis
14.10.6 Key Developments
15.1 About The Insight Partners
Table 1. North America Hydronic Balancing Valves Market Segmentation
Table 2. List of Vendors
Table 3. North America Hydronic Balancing Valves Market – Revenue and Forecast to 2031 (US$ Million)
Table 4. North America Hydronic Balancing Valves Market – Revenue and Forecast to 2031 (US$ Million) – by Type
Table 5. North America Hydronic Balancing Valves Market – Revenue and Forecast to 2031 (US$ Million) – by Connection Type
Table 6. North America Hydronic Balancing Valves Market – Revenue and Forecast to 2031 (US$ Million) – by Size
Table 7. North America Hydronic Balancing Valves Market – Revenue and Forecast to 2031 (US$ Million) – by Application
Table 8. North America Hydronic Balancing Valves Market – Revenue and Forecast to 2031 (US$ Million) – by Country
Table 9. United States: North America Hydronic Balancing Valves Market – Revenue and Forecast to 2031 (US$ Million) – by Type
Table 10. United States: North America Hydronic Balancing Valves Market – Revenue and Forecast to 2031 (US$ Million) – by Connection Type
Table 11. United States: North America Hydronic Balancing Valves Market – Revenue and Forecast to 2031 (US$ Million) – by Size
Table 12. United States: North America Hydronic Balancing Valves Market – Revenue and Forecast to 2031 (US$ Million) – by Application
Table 13. Canada: North America Hydronic Balancing Valves Market – Revenue and Forecast to 2031 (US$ Million) – by Type
Table 14. Canada: North America Hydronic Balancing Valves Market – Revenue and Forecast to 2031 (US$ Million) – by Connection Type
Table 15. Canada: North America Hydronic Balancing Valves Market – Revenue and Forecast to 2031 (US$ Million) – by Size
Table 16. Canada: North America Hydronic Balancing Valves Market – Revenue and Forecast to 2031 (US$ Million) – by Application
Table 17. Mexico: North America Hydronic Balancing Valves Market – Revenue and Forecast to 2031 (US$ Million) – by Type
Table 18. Mexico: North America Hydronic Balancing Valves Market – Revenue and Forecast to 2031 (US$ Million) – by Connection Type
Table 19. Mexico: North America Hydronic Balancing Valves Market – Revenue and Forecast to 2031 (US$ Million) – by Size
Table 20. Mexico: North America Hydronic Balancing Valves Market – Revenue and Forecast to 2031 (US$ Million) – by Application
Figure 1. North America Hydronic Balancing Valves Market Segmentation, by Country
Figure 2. North America Hydronic Balancing Valves Market – Key Market Dynamics
Figure 3. Impact Analysis of Drivers and Restraints
Figure 4. North America Hydronic Balancing Valves Market Revenue (US$ Million), 2021–2031
Figure 5. North America Hydronic Balancing Valves Market Share (%) – by Type (2023 and 2031)
Figure 6. Static Balancing Valves: North America Hydronic Balancing Valves Market – Revenue and Forecast to 2031 (US$ Million)
Figure 7. Fixed-Orifice Balancing Valves: North America Hydronic Balancing Valves Market – Revenue and Forecast to 2031 (US$ Million)
Figure 8. Automatic Balancing Valves: North America Hydronic Balancing Valves Market – Revenue and Forecast to 2031 (US$ Million)
Figure 9. Pressure-Independent Flow Control Valves: North America Hydronic Balancing Valves Market – Revenue and Forecast to 2031 (US$ Million)
Figure 10. North America Hydronic Balancing Valves Market Share (%) – by Connection Type (2023 and 2031)
Figure 11. Flanged: North America Hydronic Balancing Valves Market – Revenue and Forecast to 2031 (US$ Million)
Figure 12. Threaded: North America Hydronic Balancing Valves Market – Revenue and Forecast to 2031 (US$ Million)
Figure 13. Others: North America Hydronic Balancing Valves Market – Revenue and Forecast to 2031 (US$ Million)
Figure 14. North America Hydronic Balancing Valves Market Share (%) – by Size (2023 and 2031)
Figure 15. Less than 5 Inches: North America Hydronic Balancing Valves Market – Revenue and Forecast to 2031 (US$ Million)
Figure 16. 6-10 Inches: North America Hydronic Balancing Valves Market – Revenue and Forecast to 2031 (US$ Million)
Figure 17. 11- 20 Inches: North America Hydronic Balancing Valves Market – Revenue and Forecast to 2031 (US$ Million)
Figure 18. Above 20 Inches: North America Hydronic Balancing Valves Market – Revenue and Forecast to 2031 (US$ Million)
Figure 19. North America Hydronic Balancing Valves Market Share (%) – by Application (2023 and 2031)
Figure 20. Residential: North America Hydronic Balancing Valves Market – Revenue and Forecast to 2031 (US$ Million)
Figure 21. Commercial: North America Hydronic Balancing Valves Market – Revenue and Forecast to 2031 (US$ Million)
Figure 22. Industrial: North America Hydronic Balancing Valves Market – Revenue and Forecast to 2031 (US$ Million)
Figure 23. North America Hydronic Balancing Valves Market Breakdown, by Key Countries – Revenue (2023) (US$ Million)
Figure 24. North America Hydronic Balancing Valves Market Breakdown, by Key Countries, 2023 and 2031 (%)
Figure 25. United States: North America Hydronic Balancing Valves Market – Revenue and Forecast to 2031 (US$ Million)
Figure 26. Canada: North America Hydronic Balancing Valves Market – Revenue and Forecast to 2031 (US$ Million)
Figure 27. Mexico: North America Hydronic Balancing Valves Market – Revenue and Forecast to 2031 (US$ Million)
Figure 28. Company Positioning & Concentration
Figure 29. Heat Map Analysis