1. Introduction
1.1 Business Market Insights Research Report Guidance
1.2 Market Segmentation
2. Executive Summary
2.1 Key Market Insights
2.2 Market Attractiveness
3. Research Methodology
3.1 Secondary Research
3.2 Primary Research
- 3.2.1 Hypothesis formulation:
- 3.2.2 Macro-economic factor analysis:
- 3.2.3 Developing base number:
- 3.2.4 Data Triangulation:
- 3.2.5 Country level data:
4. North America Direct Reduced Iron (DRI) Market Landscape
4.1 Market Overview
4.2 Porter's Five Forces Analysis
- 4.2.1 Bargaining Power of Suppliers
- 4.2.2 Bargaining Power of Buyers
- 4.2.3 Threat of New Entrants
- 4.2.4 Competitive Rivalry
- 4.2.5 Threat of Substitutes
4.3 Ecosystem Analysis
- 4.3.1 Raw Material Suppliers
- 4.3.2 Manufacturers
- 4.3.3 Distributors/Suppliers
- 4.3.4 End Users
5. North America Direct Reduced Iron (DRI) Market – Key Market Dynamics
5.1 Growth Drivers
- 5.1.1
- 5.1.2 Increasing demand for steel
- 5.1.3 Growth of the automotive industry
- 5.1.4 Infrastructure development
- 5.1.5 Rising urbanization
- 5.1.6 Government initiatives
- 5.1.7 Technological advancements
- 5.1.8 Cost-effective production process
5.2 Market Opportunities
- 5.2.1
- 5.2.2 Increasing demand for noise reduction in various industries
- 5.2.3 Growing awareness of noise pollution and its health hazards
- 5.2.4 Advancements in sensor and actuator technologies
- 5.2.5 Rising demand for comfort and convenience in vehicles
- 5.2.6 Increasing adoption of active noise and vibration control systems in consumer electronics
- 5.2.7 Development of new applications in aerospace and defense
5.3 Future Trends
- 5.3.1
- 5.3.2 Integration of AI and machine learning
- 5.3.3 Development of advanced sensors and actuators
- 5.3.4 Miniaturization of devices
- 5.3.5 Increased focus on energy efficiency
- 5.3.6 Expansion into emerging markets
- 5.3.7 Development of new applications in healthcare and wellness
5.4 Impact of Drivers and Restraints
6. North America Direct Reduced Iron (DRI) Market Regional Analysis
6.1 North America Direct Reduced Iron (DRI) Market Overview
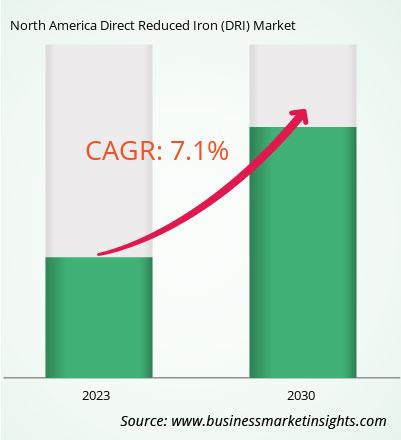
6.2 North America Direct Reduced Iron (DRI) Market Revenue 2021-2030 (US$ Million)
6.3 North America Direct Reduced Iron (DRI) Market Forecast Analysis
7. North America Direct Reduced Iron (DRI) Market Analysis – by Form
7.1 Lumps
- 7.1.1 Overview
- 7.1.2 Lumps: North America Direct Reduced Iron (DRI) Market – Revenue and Forecast to 2031 (US$ Million)
7.2 Pellets
- 7.2.1 Overview
- 7.2.2 Pellets: North America Direct Reduced Iron (DRI) Market – Revenue and Forecast to 2031 (US$ Million)
7.3 Fine
- 7.3.1 Overview
- 7.3.2 Fine: North America Direct Reduced Iron (DRI) Market – Revenue and Forecast to 2031 (US$ Million)
8. North America Direct Reduced Iron (DRI) Market Analysis – by Production Process
8.1 Coal based and gas based
- 8.1.1 Overview
- 8.1.2 Coal based and gas based: North America Direct Reduced Iron (DRI) Market – Revenue and Forecast to 2030 (US$ Million)
9. North America Direct Reduced Iron (DRI) Market Analysis – by Application
9.1 Steel Making and Construction
- 9.1.1 Overview
- 9.1.2 Coal based and gas based: North America Direct Reduced Iron (DRI) Market – Revenue and Forecast to 2030 (US$ Million)
10. North America Direct Reduced Iron (DRI) Market – North America Analysis
10.1 North America
- 10.1.1 North America Direct Reduced Iron (DRI) Market Breakdown, by Key
Country, 2024 and 2030 (%)
- 10.1.1.1 North America Direct Reduced Iron (DRI) Market – Revenue and
Forecast Analysis – by Country
- 10.1.1.1 US:
North America Direct Reduced Iron (DRI) Market – Revenue and Forecast to 2030 (US$ Million)
- 10.1.1.1.1 US: North America Direct Reduced Iron (DRI) Market Breakdown, by Form
- 10.1.1.1.2 US: North America Direct Reduced Iron (DRI) Market Breakdown, by Production Process
- 10.1.1.1.3 US: North America Direct Reduced Iron (DRI) Market Breakdown, by Application
- 10.1.1.2 Canada:
North America Direct Reduced Iron (DRI) Market – Revenue and Forecast to 2030 (US$ Million)
- 10.1.1.2.1 Canada: North America Direct Reduced Iron (DRI) Market Breakdown, by Form
- 10.1.1.2.2 Canada: North America Direct Reduced Iron (DRI) Market Breakdown, by Production Process
- 10.1.1.2.3 Canada: North America Direct Reduced Iron (DRI) Market Breakdown, by Application
- 10.1.1.3 Mexico:
North America Direct Reduced Iron (DRI) Market – Revenue and Forecast to 2030 (US$ Million)
- 10.1.1.3.1 Mexico: North America Direct Reduced Iron (DRI) Market Breakdown, by Form
- 10.1.1.3.2 Mexico: North America Direct Reduced Iron (DRI) Market Breakdown, by Production Process
- 10.1.1.3.3 Mexico: North America Direct Reduced Iron (DRI) Market Breakdown, by Application
11. Competitive Landscape
11.1 Heat Map Analysis
11.2 Company Positioning and Concentration
12. North America Direct Reduced Iron (DRI) Market Industry Landscape
12.1 Overview
12.2 Mergers and Acquisitions
12.3 Agreements, Collaborations, and Joint Ventures
12.4 New Product Launches
12.5 Expansions and Other Strategic Developments
13. Company Profiles
13.1 Nucor Corp
- 13.1.1 Key Facts
- 13.1.2 Business Description
- 13.1.3 Products and Services
- 13.1.4 Financial Overview
- 13.1.5 SWOT Analysis
- 13.1.6 Key Developments
13.2 Cleveland-Cliffs Inc
- 13.2.1 Key Facts
- 13.2.2 Business Description
- 13.2.3 Products and Services
- 13.2.4 Financial Overview
- 13.2.5 SWOT Analysis
- 13.2.6 Key Developments
13.3 Kobe Steel Ltd
- 13.3.1 Key Facts
- 13.3.2 Business Description
- 13.3.3 Products and Services
- 13.3.4 Financial Overview
- 13.3.5 SWOT Analysis
- 13.3.6 Key Developments
13.4 SMS Group GmbH
- 13.4.1 Key Facts
- 13.4.2 Business Description
- 13.4.3 Products and Services
- 13.4.4 Financial Overview
- 13.4.5 SWOT Analysis
- 13.4.6 Key Developments
13.5 Voestalpine AG
- 13.5.1 Key Facts
- 13.5.2 Business Description
- 13.5.3 Products and Services
- 13.5.4 Financial Overview
- 13.5.5 SWOT Analysis
- 13.5.6 Key Developments
13.6 Ternium SA
- 13.6.1 Key Facts
- 13.6.2 Business Description
- 13.6.3 Products and Services
- 13.6.4 Financial Overview
- 13.6.5 SWOT Analysis
- 13.6.6 Key Developments
13.7 JSW Steel Ltd
- 13.7.1 Key Facts
- 13.7.2 Business Description
- 13.7.3 Products and Services
- 13.7.4 Financial Overview
- 13.7.5 SWOT Analysis
- 13.7.6 Key Developments
13.8 Tenova SpA
- 13.8.1 Key Facts
- 13.8.2 Business Description
- 13.8.3 Products and Services
- 13.8.4 Financial Overview
- 13.8.5 SWOT Analysis
- 13.8.6 Key Developments
13.9 Liberty Steel Group Holdings UK Ltd
- 13.9.1 Key Facts
- 13.9.2 Business Description
- 13.9.3 Products and Services
- 13.9.4 Financial Overview
- 13.9.5 SWOT Analysis
- 13.9.6 Key Developments
13.10 Bharat Engineering Works Pvt Ltd
- 13.10.1 Key Facts
- 13.10.2 Business Description
- 13.10.3 Products and Services
- 13.10.4 Financial Overview
- 13.10.5 SWOT Analysis
- 13.10.6 Key Developments
14. Appendix
14.1 About Business Market Insights


 Get Free Sample For North America Direct Reduced Iron (DRI) Market

