1. Introduction
1.1 Business Market Insights Research Report Guidance
1.2 Market Segmentation
2. Executive Summary
2.1 Key Market Insights
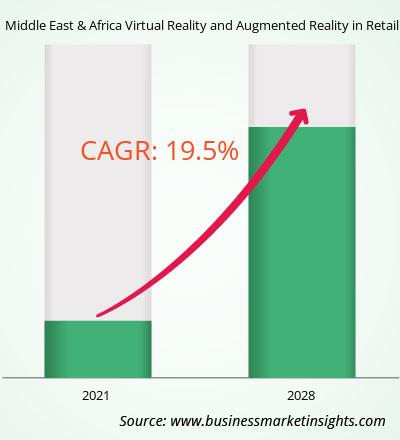
2.2 Market Attractiveness
3. Research Methodology
3.1 Secondary Research
3.2 Primary Research
- 3.2.1 Hypothesis formulation:
- 3.2.2 Macro-economic factor analysis:
- 3.2.3 Developing base number:
- 3.2.4 Data Triangulation:
- 3.2.5 Country level data:
4. Middle East & Africa Virtual Reality and Augmented Reality in Retail Market Landscape
4.1 Market Overview
4.2 Porter's Five Forces Analysis
- 4.2.1 Bargaining Power of Suppliers
- 4.2.2 Bargaining Power of Buyers
- 4.2.3 Threat of New Entrants
- 4.2.4 Competitive Rivalry
- 4.2.5 Threat of Substitutes
4.3 Ecosystem Analysis
- 4.3.1 Raw Material Suppliers
- 4.3.2 Manufacturers
- 4.3.3 Distributors/Suppliers
- 4.3.4 End Users
5. Middle East & Africa Virtual Reality and Augmented Reality in Retail Market – Key Market Dynamics
5.1 Growth Drivers
- 5.1.1 The increasing adoption of AR/VR in retail and the huge growth of the ecommerce industry
5.2 Market Opportunities
- 5.2.1 Increased demand for Virtual try-ons
5.3 Future Trends
- 5.3.1 VR-based advertising
5.4 Impact of Drivers and Restraints
6. Middle East & Africa Virtual Reality and Augmented Reality in Retail Market Regional Analysis
6.1 Middle East & Africa Virtual Reality and Augmented Reality in Retail Market Overview
6.2 Middle East & Africa Virtual Reality and Augmented Reality in Retail Market Revenue 2019-2028 (US$ Million)
6.3 Middle East & Africa Virtual Reality and Augmented Reality in Retail Market Forecast Analysis
7. Middle East & Africa Virtual Reality and Augmented Reality in Retail Market Analysis – by Type
7.1 AR and VR
- 7.1.1 Overview
- 7.1.2 AR and VR: Middle East & Africa Virtual Reality and Augmented Reality in Retail Market – Revenue and Forecast to 2031 (US$ Million)
8. Middle East & Africa Virtual Reality and Augmented Reality in Retail Market Analysis – by Application
8.1 Online Retail and Offline Retail
- 8.1.1 Overview
- 8.1.2 Online Retail and Offline Retail : Middle East & Africa Virtual Reality and Augmented Reality in Retail Market – Revenue and Forecast to 2028 (US$ Million)
9. Middle East & Africa Virtual Reality and Augmented Reality in Retail Market – Middle East and Africa Analysis
9.1 Middle East and Africa
- 9.1.1 Middle East & Africa Virtual Reality and Augmented Reality in Retail Market Breakdown, by Key
Country, 2022 and 2028 (%)
- 9.1.1.1 Middle East & Africa Virtual Reality and Augmented Reality in Retail Market – Revenue and
Forecast Analysis – by Country
- 9.1.1.1 South Africa:
Middle East & Africa Virtual Reality and Augmented Reality in Retail Market – Revenue and Forecast to 2028 (US$ Million)
- 9.1.1.1.1 South Africa: Middle East & Africa Virtual Reality and Augmented Reality in Retail Market Breakdown, by Type
- 9.1.1.1.2 South Africa: Middle East & Africa Virtual Reality and Augmented Reality in Retail Market Breakdown, by Application
- 9.1.1.2 Saudi Arabia:
Middle East & Africa Virtual Reality and Augmented Reality in Retail Market – Revenue and Forecast to 2028 (US$ Million)
- 9.1.1.2.1 Saudi Arabia: Middle East & Africa Virtual Reality and Augmented Reality in Retail Market Breakdown, by Type
- 9.1.1.2.2 Saudi Arabia: Middle East & Africa Virtual Reality and Augmented Reality in Retail Market Breakdown, by Application
- 9.1.1.3 UAE:
Middle East & Africa Virtual Reality and Augmented Reality in Retail Market – Revenue and Forecast to 2028 (US$ Million)
- 9.1.1.3.1 UAE: Middle East & Africa Virtual Reality and Augmented Reality in Retail Market Breakdown, by Type
- 9.1.1.3.2 UAE: Middle East & Africa Virtual Reality and Augmented Reality in Retail Market Breakdown, by Application
- 9.1.1.4 Rest of Middle East and Africa:
Middle East & Africa Virtual Reality and Augmented Reality in Retail Market – Revenue and Forecast to 2028 (US$ Million)
- 9.1.1.4.1 Rest of Middle East and Africa: Middle East & Africa Virtual Reality and Augmented Reality in Retail Market Breakdown, by Type
- 9.1.1.4.2 Rest of Middle East and Africa: Middle East & Africa Virtual Reality and Augmented Reality in Retail Market Breakdown, by Application
10. Competitive Landscape
10.1 Heat Map Analysis
10.2 Company Positioning and Concentration
11. Middle East & Africa Virtual Reality and Augmented Reality in Retail Market Industry Landscape
11.1 Overview
11.2 Mergers and Acquisitions
11.3 Agreements, Collaborations, and Joint Ventures
11.4 New Product Launches
11.5 Expansions and Other Strategic Developments
12. Company Profiles
12.1 Epson America, Inc.
- 12.1.1 Key Facts
- 12.1.2 Business Description
- 12.1.3 Products and Services
- 12.1.4 Financial Overview
- 12.1.5 SWOT Analysis
- 12.1.6 Key Developments
12.2 Google LLC
- 12.2.1 Key Facts
- 12.2.2 Business Description
- 12.2.3 Products and Services
- 12.2.4 Financial Overview
- 12.2.5 SWOT Analysis
- 12.2.6 Key Developments
12.3 Infosys Ltd.
- 12.3.1 Key Facts
- 12.3.2 Business Description
- 12.3.3 Products and Services
- 12.3.4 Financial Overview
- 12.3.5 SWOT Analysis
- 12.3.6 Key Developments
12.4 Intel Corporation
- 12.4.1 Key Facts
- 12.4.2 Business Description
- 12.4.3 Products and Services
- 12.4.4 Financial Overview
- 12.4.5 SWOT Analysis
- 12.4.6 Key Developments
12.5 Microsoft Corporation
- 12.5.1 Key Facts
- 12.5.2 Business Description
- 12.5.3 Products and Services
- 12.5.4 Financial Overview
- 12.5.5 SWOT Analysis
- 12.5.6 Key Developments
12.6 PTC Inc.
- 12.6.1 Key Facts
- 12.6.2 Business Description
- 12.6.3 Products and Services
- 12.6.4 Financial Overview
- 12.6.5 SWOT Analysis
- 12.6.6 Key Developments
13. Appendix
13.1 About Business Market Insights


 Get Free Sample For Middle East & Africa Virtual Reality and Augmented Reality in Retail Market

