No. of Pages: 142 | Report Code: BMIRE00031067 | Category: Consumer Goods
1.1 Report Guidance
1.2 Market Segmentation
2.1 Key Insights
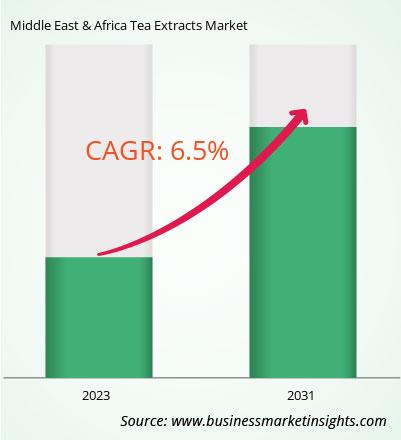
2.2 Market Attractiveness
3.1 Secondary Research
3.2 Primary Research
3.2.1 Hypothesis formulation:
3.2.2 Macroeconomic factor analysis:
3.2.3 Developing base number:
3.2.4 Data Triangulation:
3.2.5 Country-level data:
3.3 Assumptions and Limitations
4.1 Overview
4.2 Porter's Five Forces Analysis
4.3 Ecosystem Analysis
4.4 List of Vendors in the Value Chain
5.1 Market Drivers
5.2 Market Restraints
5.3 Market Opportunities
5.4 Future Trends
5.5 Impact of Drivers and Restraints:
6.1 Middle East & Africa Tea Extracts Market Revenue (US$ Million), 2021–2031
6.2 Middle East & Africa Tea Extracts Market Forecast Analysis
7.1 Green Tea
7.1.1 Overview
7.1.2 Green Tea: Middle East & Africa Tea Extracts Market – Revenue and Forecast, 2021–2031 (US$ Million)
7.2 Black Tea
7.2.1 Overview
7.2.2 Black Tea: Middle East & Africa Tea Extracts Market – Revenue and Forecast, 2021–2031 (US$ Million)
7.3 Oolong Tea
7.3.1 Overview
7.3.2 Oolong Tea: Middle East & Africa Tea Extracts Market – Revenue and Forecast, 2021–2031 (US$ Million)
7.4 Others
7.4.1 Overview
7.4.2 Others: Middle East & Africa Tea Extracts Market – Revenue and Forecast, 2021–2031 (US$ Million)
8.1 Conventional
8.1.1 Overview
8.1.2 Conventional: Middle East & Africa Tea Extracts Market – Revenue and Forecast, 2021–2031 (US$ Million)
8.2 Organic
8.2.1 Overview
8.2.2 Organic: Middle East & Africa Tea Extracts Market – Revenue and Forecast, 2021–2031 (US$ Million)
9.1 Powder
9.1.1 Overview
9.1.2 Powder: Middle East & Africa Tea Extracts Market – Revenue and Forecast, 2021–2031 (US$ Million)
9.2 Liquid
9.2.1 Overview
9.2.2 Liquid: Middle East & Africa Tea Extracts Market – Revenue and Forecast, 2021–2031 (US$ Million)
10.1 Food and Beverages
10.1.1 Overview
10.1.2 Food and Beverages: Middle East & Africa Tea Extracts Market – Revenue and Forecast, 2021–2031 (US$ Million)
10.2 Bakery and Confectionery
10.2.1 Overview
10.2.2 Bakery and Confectionery: Middle East & Africa Tea Extracts Market – Revenue and Forecast, 2021–2031 (US$ Million)
10.3 Dairy and Frozen Dessert
10.3.1 Overview
10.3.2 Dairy and Frozen Dessert: Middle East & Africa Tea Extracts Market – Revenue and Forecast, 2021–2031 (US$ Million)
10.4 Beverages
10.4.1 Overview
10.4.2 Beverages: Middle East & Africa Tea Extracts Market – Revenue and Forecast, 2021–2031 (US$ Million)
10.5 Other Food and Beverages
10.5.1 Overview
10.5.2 Other Food and Beverages: Middle East & Africa Tea Extracts Market – Revenue and Forecast, 2021–2031 (US$ Million)
10.6 Dietary Supplements
10.6.1 Overview
10.6.2 Dietary Supplements: Middle East & Africa Tea Extracts Market – Revenue and Forecast, 2021–2031 (US$ Million)
10.7 Personal Care and Cosmetics
10.7.1 Overview
10.7.2 Personal Care and Cosmetics: Middle East & Africa Tea Extracts Market – Revenue and Forecast, 2021–2031 (US$ Million)
10.8 Others
10.8.1 Overview
10.8.2 Others: Middle East & Africa Tea Extracts Market – Revenue and Forecast, 2021–2031 (US$ Million)
11.1 Middle East & Africa
11.1.1 Middle East & Africa Tea Extracts Market – Revenue and Forecast Analysis – by Country
11.1.1.1 Middle East & Africa Tea Extracts Market – Revenue and Forecast Analysis – by Country
11.1.1.2 United Arab Emirates: Middle East & Africa Tea Extracts Market – Revenue and Forecast, 2021–2031 (US$ Million)
11.1.1.2.1 United Arab Emirates: Middle East & Africa Tea Extracts Market Share – by Type
11.1.1.2.2 United Arab Emirates: Middle East & Africa Tea Extracts Market Share – by Category
11.1.1.2.3 United Arab Emirates: Middle East & Africa Tea Extracts Market Share – by Form
11.1.1.2.4 United Arab Emirates: Middle East & Africa Tea Extracts Market Share – by Application
11.1.1.3 South Africa: Middle East & Africa Tea Extracts Market – Revenue and Forecast, 2021–2031 (US$ Million)
11.1.1.3.1 South Africa: Middle East & Africa Tea Extracts Market Share – by Type
11.1.1.3.2 South Africa: Middle East & Africa Tea Extracts Market Share – by Category
11.1.1.3.3 South Africa: Middle East & Africa Tea Extracts Market Share – by Form
11.1.1.3.4 South Africa: Middle East & Africa Tea Extracts Market Share – by Application
11.1.1.4 Saudi Arabia: Middle East & Africa Tea Extracts Market – Revenue and Forecast, 2021–2031 (US$ Million)
11.1.1.4.1 Saudi Arabia: Middle East & Africa Tea Extracts Market Share – by Type
11.1.1.4.2 Saudi Arabia: Middle East & Africa Tea Extracts Market Share – by Category
11.1.1.4.3 Saudi Arabia: Middle East & Africa Tea Extracts Market Share – by Form
11.1.1.4.4 Saudi Arabia: Middle East & Africa Tea Extracts Market Share – by Application
11.1.1.5 Rest of Middle East & Africa : Middle East & Africa Tea Extracts Market – Revenue and Forecast, 2021–2031 (US$ Million)
11.1.1.5.1 Rest of Middle East & Africa : Middle East & Africa Tea Extracts Market Share – by Type
11.1.1.5.2 Rest of Middle East & Africa : Middle East & Africa Tea Extracts Market Share – by Category
11.1.1.5.3 Rest of Middle East & Africa : Middle East & Africa Tea Extracts Market Share – by Form
11.1.1.5.4 Rest of Middle East & Africa : Middle East & Africa Tea Extracts Market Share – by Application
12.1 Heat Map Analysis by Key Players
12.2 Company Positioning and Concentration
13.1 Overview
13.2 Market Initiative
13.3 Partnerships and Collaborations
13.4 Other Developments
14.1 Finlays
14.1.1 Key Facts
14.1.2 Business Description
14.1.3 Products and Services
14.1.4 Financial Overview
14.1.5 SWOT Analysis
14.1.6 Key Developments
14.2 MartinBauer
14.2.1 Key Facts
14.2.2 Business Description
14.2.3 Products and Services
14.2.4 Financial Overview
14.2.5 SWOT Analysis
14.2.6 Key Developments
14.3 Dohler GmbH
14.3.1 Key Facts
14.3.2 Business Description
14.3.3 Products and Services
14.3.4 Financial Overview
14.3.5 SWOT Analysis
14.3.6 Key Developments
14.4 Firmenich International SA
14.4.1 Key Facts
14.4.2 Business Description
14.4.3 Products and Services
14.4.4 Financial Overview
14.4.5 SWOT Analysis
14.4.6 Key Developments
14.5 Givaudan SA
14.5.1 Key Facts
14.5.2 Business Description
14.5.3 Products and Services
14.5.4 Financial Overview
14.5.5 SWOT Analysis
14.5.6 Key Developments
14.6 International Flavors & Fragrances Inc
14.6.1 Key Facts
14.6.2 Business Description
14.6.3 Products and Services
14.6.4 Financial Overview
14.6.5 SWOT Analysis
14.6.6 Key Developments
14.7 Kerry Group Plc
14.7.1 Key Facts
14.7.2 Business Description
14.7.3 Products and Services
14.7.4 Financial Overview
14.7.5 SWOT Analysis
14.7.6 Key Developments
14.8 Archer Daniels Midland Company
14.8.1 Key Facts
14.8.2 Business Description
14.8.3 Products and Services
14.8.4 Financial Overview
14.8.5 SWOT Analysis
14.8.6 Key Developments
14.9 Sensient Technologies Corp
14.9.1 Key Facts
14.9.2 Business Description
14.9.3 Products and Services
14.9.4 Financial Overview
14.9.5 SWOT Analysis
14.9.6 Key Developments
14.10 Kemin Industries Inc
14.10.1 Key Facts
14.10.2 Business Description
14.10.3 Products and Services
14.10.4 Financial Overview
14.10.5 SWOT Analysis
14.10.6 Key Developments
14.11 Botanic Healthcare Pvt Ltd
14.11.1 Key Facts
14.11.2 Business Description
14.11.3 Products and Services
14.11.4 Financial Overview
14.11.5 SWOT Analysis
14.11.6 Key Developments
14.12 Medikonda Nutrients
14.12.1 Key Facts
14.12.2 Business Description
14.12.3 Products and Services
14.12.4 Financial Overview
14.12.5 SWOT Analysis
14.12.6 Key Developments
14.13 Virginia Dare Extract Co Inc
14.13.1 Key Facts
14.13.2 Business Description
14.13.3 Products and Services
14.13.4 Financial Overview
14.13.5 SWOT Analysis
14.13.6 Key Developments
14.14 Lipoid-Kosmetik
14.14.1 Key Facts
14.14.2 Business Description
14.14.3 Products and Services
14.14.4 Financial Overview
14.14.5 SWOT Analysis
14.14.6 Key Developments
14.15 Florida Food Products
14.15.1 Key Facts
14.15.2 Business Description
14.15.3 Products and Services
14.15.4 Financial Overview
14.15.5 SWOT Analysis
14.15.6 Key Developments
15.1 About Us
15.2 List of Abbreviations
Table 1. Middle East & Africa Tea Extracts Market Segmentation
Table 2. List of Vendors
Table 3. Middle East & Africa Tea Extracts Market – Revenue and Forecast, 2021–2031 (US$ Million)
Table 4. Middle East & Africa Tea Extracts Market – Revenue and Forecast, 2021–2031 (US$ Million) – by Type
Table 5. Middle East & Africa Tea Extracts Market – Revenue and Forecast, 2021–2031 (US$ Million) – by Category
Table 6. Middle East & Africa Tea Extracts Market – Revenue and Forecast, 2021–2031 (US$ Million) – by Form
Table 7. Middle East & Africa Tea Extracts Market – Revenue and Forecast, 2021–2031 (US$ Million) – by Application
Table 8. Middle East & Africa Tea Extracts Market – Revenue and Forecast, 2021–2031 (US$ Million) – by Country
Table 9. United Arab Emirates: Middle East & Africa Tea Extracts Market – Revenue and Forecast, 2021 – 2031(US$ Million) – by Type
Table 10. United Arab Emirates: Middle East & Africa Tea Extracts Market – Revenue and Forecast, 2021 – 2031(US$ Million) – by Category
Table 11. United Arab Emirates: Middle East & Africa Tea Extracts Market – Revenue and Forecast, 2021 – 2031(US$ Million) – by Form
Table 12. United Arab Emirates: Middle East & Africa Tea Extracts Market – Revenue and Forecast, 2021 – 2031(US$ Million) – by Application
Table 13. South Africa: Middle East & Africa Tea Extracts Market – Revenue and Forecast, 2021 – 2031(US$ Million) – by Type
Table 14. South Africa: Middle East & Africa Tea Extracts Market – Revenue and Forecast, 2021 – 2031(US$ Million) – by Category
Table 15. South Africa: Middle East & Africa Tea Extracts Market – Revenue and Forecast, 2021 – 2031(US$ Million) – by Form
Table 16. South Africa: Middle East & Africa Tea Extracts Market – Revenue and Forecast, 2021 – 2031(US$ Million) – by Application
Table 17. Saudi Arabia: Middle East & Africa Tea Extracts Market – Revenue and Forecast, 2021 – 2031(US$ Million) – by Type
Table 18. Saudi Arabia: Middle East & Africa Tea Extracts Market – Revenue and Forecast, 2021 – 2031(US$ Million) – by Category
Table 19. Saudi Arabia: Middle East & Africa Tea Extracts Market – Revenue and Forecast, 2021 – 2031(US$ Million) – by Form
Table 20. Saudi Arabia: Middle East & Africa Tea Extracts Market – Revenue and Forecast, 2021 – 2031(US$ Million) – by Application
Table 21. Rest of Middle East & Africa : Middle East & Africa Tea Extracts Market – Revenue and Forecast, 2021 – 2031(US$ Million) – by Type
Table 22. Rest of Middle East & Africa : Middle East & Africa Tea Extracts Market – Revenue and Forecast, 2021 – 2031(US$ Million) – by Category
Table 23. Rest of Middle East & Africa : Middle East & Africa Tea Extracts Market – Revenue and Forecast, 2021 – 2031(US$ Million) – by Form
Table 24. Rest of Middle East & Africa : Middle East & Africa Tea Extracts Market – Revenue and Forecast, 2021 – 2031(US$ Million) – by Application
Table 25. List of Abbreviations
Figure 1. Middle East & Africa Tea Extracts Market Segmentation – Country
Figure 2. Porter's Five Forces Analysis
Figure 3. Impact Analysis of Drivers and Restraints
Figure 4. Middle East & Africa Tea Extracts Market Revenue (US$ Million), 2021–2031
Figure 5. Middle East & Africa Tea Extracts Market Share (%) – by Type (2023 and 2031)
Figure 6. Green Tea: Middle East & Africa Tea Extracts Market – Revenue and Forecast, 2021–2031 (US$ Million)
Figure 7. Black Tea: Middle East & Africa Tea Extracts Market – Revenue and Forecast, 2021–2031 (US$ Million)
Figure 8. Oolong Tea: Middle East & Africa Tea Extracts Market – Revenue and Forecast, 2021–2031 (US$ Million)
Figure 9. Others: Middle East & Africa Tea Extracts Market – Revenue and Forecast, 2021–2031 (US$ Million)
Figure 10. Middle East & Africa Tea Extracts Market Share (%) – by Category (2023 and 2031)
Figure 11. Conventional: Middle East & Africa Tea Extracts Market – Revenue and Forecast, 2021–2031 (US$ Million)
Figure 12. Organic: Middle East & Africa Tea Extracts Market – Revenue and Forecast, 2021–2031 (US$ Million)
Figure 13. Middle East & Africa Tea Extracts Market Share (%) – by Form (2023 and 2031)
Figure 14. Powder: Middle East & Africa Tea Extracts Market – Revenue and Forecast, 2021–2031 (US$ Million)
Figure 15. Liquid: Middle East & Africa Tea Extracts Market – Revenue and Forecast, 2021–2031 (US$ Million)
Figure 16. Middle East & Africa Tea Extracts Market Share (%) – by Application (2023 and 2031)
Figure 17. Food and Beverages: Middle East & Africa Tea Extracts Market – Revenue and Forecast, 2021–2031 (US$ Million)
Figure 18. Bakery and Confectionery: Middle East & Africa Tea Extracts Market – Revenue and Forecast, 2021–2031 (US$ Million)
Figure 19. Dairy and Frozen Dessert: Middle East & Africa Tea Extracts Market – Revenue and Forecast, 2021–2031 (US$ Million)
Figure 20. Beverages: Middle East & Africa Tea Extracts Market – Revenue and Forecast, 2021–2031 (US$ Million)
Figure 21. Other Food and Beverages: Middle East & Africa Tea Extracts Market – Revenue and Forecast, 2021–2031 (US$ Million)
Figure 22. Dietary Supplements: Middle East & Africa Tea Extracts Market – Revenue and Forecast, 2021–2031 (US$ Million)
Figure 23. Personal Care and Cosmetics: Middle East & Africa Tea Extracts Market – Revenue and Forecast, 2021–2031 (US$ Million)
Figure 24. Others: Middle East & Africa Tea Extracts Market – Revenue and Forecast, 2021–2031 (US$ Million)
Figure 25. Middle East & Africa Tea Extracts Market Breakdown, by Key Countries, 2023 and 2031 (%)
Figure 26. United Arab Emirates: Middle East & Africa Tea Extracts Market – Revenue and Forecast, 2021– 2031 (US$ Million)
Figure 27. South Africa: Middle East & Africa Tea Extracts Market – Revenue and Forecast, 2021– 2031 (US$ Million)
Figure 28. Saudi Arabia: Middle East & Africa Tea Extracts Market – Revenue and Forecast, 2021– 2031 (US$ Million)
Figure 29. Rest of Middle East & Africa : Middle East & Africa Tea Extracts Market – Revenue and Forecast, 2021– 2031 (US$ Million)
Figure 30. Heat Map Analysis by Key Players
Figure 31. Company Positioning and Concentration