1. Introduction
1.1 Business Market Insights Research Report Guidance
1.2 Market Segmentation
2. Executive Summary
2.1 Key Market Insights
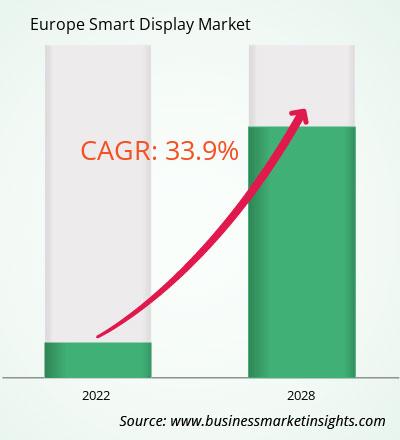
2.2 Market Attractiveness
3. Research Methodology
3.1 Secondary Research
3.2 Primary Research
- 3.2.1 Hypothesis formulation:
- 3.2.2 Macro-economic factor analysis:
- 3.2.3 Developing base number:
- 3.2.4 Data Triangulation:
- 3.2.5 Country level data:
4. Europe Smart Display Market Landscape
4.1 Market Overview
4.2 Porter's Five Forces Analysis
- 4.2.1 Bargaining Power of Suppliers
- 4.2.2 Bargaining Power of Buyers
- 4.2.3 Threat of New Entrants
- 4.2.4 Competitive Rivalry
- 4.2.5 Threat of Substitutes
4.3 Ecosystem Analysis
- 4.3.1 Raw Material Suppliers
- 4.3.2 Manufacturers
- 4.3.3 Distributors/Suppliers
- 4.3.4 End Users
5. Europe Smart Display Market – Key Market Dynamics
5.1 Growth Drivers
- 5.1.1 Rising demand for interactive and engaging displays
- 5.1.2 Increasing adoption of digital signage
5.2 Market Opportunities
- 5.2.1 Adoption of smart displays in consumer electronics and smart homes
- 5.2.2 Growth in digital signage and retail environments
5.3 Future Trends
- 5.3.1 AI and machine learning integration in fire protection
- 5.3.2 Smarter, responsive fire safety solutions
5.4 Impact of Drivers and Restraints
6. Europe Smart Display Market Regional Analysis
6.1 Europe Smart Display Market Overview
6.2 Europe Smart Display Market Revenue 2020-2028 (US$ Million)
6.3 Europe Smart Display Market Forecast Analysis
7. Europe Smart Display Market Analysis – by Size
7.1 Up to 12 Inches
- 7.1.1 Overview
- 7.1.2 Up to 12 Inches: Europe Smart Display Market – Revenue and Forecast to 2031 (US$ Million)
7.2 Above 12 Inches-Up to 32 Inches
- 7.2.1 Overview
- 7.2.2 Above 12 Inches-Up to 32 Inches: Europe Smart Display Market – Revenue and Forecast to 2031 (US$ Million)
7.3 Above 32 Inches-Up to 52 Inches
- 7.3.1 Overview
- 7.3.2 Above 32 Inches-Up to 52 Inches: Europe Smart Display Market – Revenue and Forecast to 2031 (US$ Million)
7.4 Above 52 Inches
- 7.4.1 Overview
- 7.4.2 Above 52 Inches: Europe Smart Display Market – Revenue and Forecast to 2031 (US$ Million)
8. Europe Smart Display Market Analysis – by Type
8.1 Signage
- 8.1.1 Overview
- 8.1.2 Signage: Europe Smart Display Market – Revenue and Forecast to 2028 (US$ Million)
8.2 Display
- 8.2.1 Overview
- 8.2.2 Display: Europe Smart Display Market – Revenue and Forecast to 2028 (US$ Million)
8.3 Mirror
- 8.3.1 Overview
- 8.3.2 Mirror: Europe Smart Display Market – Revenue and Forecast to 2028 (US$ Million)
9. Europe Smart Display Market Analysis – by Resolution
9.1 Full High Definition
- 9.1.1 Overview
- 9.1.2 Mirror: Europe Smart Display Market – Revenue and Forecast to 2028 (US$ Million)
9.2 Ultra High Definition
- 9.2.1 Overview
- 9.2.2 Mirror: Europe Smart Display Market – Revenue and Forecast to 2028 (US$ Million)
10. Europe Smart Display Market – Europe Analysis
10.1 Europe
- 10.1.1 Europe Smart Display Market Breakdown, by Key
Country, 2023 and 2028 (%)
- 10.1.1.1 Europe Smart Display Market – Revenue and
Forecast Analysis – by Country
- 10.1.1.1 UK:
Europe Smart Display Market – Revenue and Forecast to 2028 (US$ Million)
- 10.1.1.1.1 UK: Europe Smart Display Market Breakdown, by Size
- 10.1.1.1.2 UK: Europe Smart Display Market Breakdown, by Type
- 10.1.1.1.3 UK: Europe Smart Display Market Breakdown, by Resolution
- 10.1.1.2 Germany:
Europe Smart Display Market – Revenue and Forecast to 2028 (US$ Million)
- 10.1.1.2.1 Germany: Europe Smart Display Market Breakdown, by Size
- 10.1.1.2.2 Germany: Europe Smart Display Market Breakdown, by Type
- 10.1.1.2.3 Germany: Europe Smart Display Market Breakdown, by Resolution
- 10.1.1.3 France:
Europe Smart Display Market – Revenue and Forecast to 2028 (US$ Million)
- 10.1.1.3.1 France: Europe Smart Display Market Breakdown, by Size
- 10.1.1.3.2 France: Europe Smart Display Market Breakdown, by Type
- 10.1.1.3.3 France: Europe Smart Display Market Breakdown, by Resolution
- 10.1.1.4 Russia:
Europe Smart Display Market – Revenue and Forecast to 2028 (US$ Million)
- 10.1.1.4.1 Russia: Europe Smart Display Market Breakdown, by Size
- 10.1.1.4.2 Russia: Europe Smart Display Market Breakdown, by Type
- 10.1.1.4.3 Russia: Europe Smart Display Market Breakdown, by Resolution
- 10.1.1.5 Italy:
Europe Smart Display Market – Revenue and Forecast to 2028 (US$ Million)
- 10.1.1.5.1 Italy: Europe Smart Display Market Breakdown, by Size
- 10.1.1.5.2 Italy: Europe Smart Display Market Breakdown, by Type
- 10.1.1.5.3 Italy: Europe Smart Display Market Breakdown, by Resolution
- 10.1.1.6 Rest of Europe:
Europe Smart Display Market – Revenue and Forecast to 2028 (US$ Million)
- 10.1.1.6.1 Rest of Europe: Europe Smart Display Market Breakdown, by Size
- 10.1.1.6.2 Rest of Europe: Europe Smart Display Market Breakdown, by Type
- 10.1.1.6.3 Rest of Europe: Europe Smart Display Market Breakdown, by Resolution
11. Competitive Landscape
11.1 Heat Map Analysis
11.2 Company Positioning and Concentration
12. Europe Smart Display Market Industry Landscape
12.1 Overview
12.2 Mergers and Acquisitions
12.3 Agreements, Collaborations, and Joint Ventures
12.4 New Product Launches
12.5 Expansions and Other Strategic Developments
13. Company Profiles
13.1 Alphabet Inc.
- 13.1.1 Key Facts
- 13.1.2 Business Description
- 13.1.3 Products and Services
- 13.1.4 Financial Overview
- 13.1.5 SWOT Analysis
- 13.1.6 Key Developments
13.2 Amazon.com, Inc.
- 13.2.1 Key Facts
- 13.2.2 Business Description
- 13.2.3 Products and Services
- 13.2.4 Financial Overview
- 13.2.5 SWOT Analysis
- 13.2.6 Key Developments
13.3 BenQ Corporation
- 13.3.1 Key Facts
- 13.3.2 Business Description
- 13.3.3 Products and Services
- 13.3.4 Financial Overview
- 13.3.5 SWOT Analysis
- 13.3.6 Key Developments
13.4 Lenovo Group Limited
- 13.4.1 Key Facts
- 13.4.2 Business Description
- 13.4.3 Products and Services
- 13.4.4 Financial Overview
- 13.4.5 SWOT Analysis
- 13.4.6 Key Developments
13.5 LG Electronics
- 13.5.1 Key Facts
- 13.5.2 Business Description
- 13.5.3 Products and Services
- 13.5.4 Financial Overview
- 13.5.5 SWOT Analysis
- 13.5.6 Key Developments
13.6 Magna International Inc
- 13.6.1 Key Facts
- 13.6.2 Business Description
- 13.6.3 Products and Services
- 13.6.4 Financial Overview
- 13.6.5 SWOT Analysis
- 13.6.6 Key Developments
13.7 NEXCOM International Co., Ltd.
- 13.7.1 Key Facts
- 13.7.2 Business Description
- 13.7.3 Products and Services
- 13.7.4 Financial Overview
- 13.7.5 SWOT Analysis
- 13.7.6 Key Developments
13.8 Panasonic Corporation
- 13.8.1 Key Facts
- 13.8.2 Business Description
- 13.8.3 Products and Services
- 13.8.4 Financial Overview
- 13.8.5 SWOT Analysis
- 13.8.6 Key Developments
13.9 Samsung Electronics Co., Ltd.
- 13.9.1 Key Facts
- 13.9.2 Business Description
- 13.9.3 Products and Services
- 13.9.4 Financial Overview
- 13.9.5 SWOT Analysis
- 13.9.6 Key Developments
13.10 Sony Corporation
- 13.10.1 Key Facts
- 13.10.2 Business Description
- 13.10.3 Products and Services
- 13.10.4 Financial Overview
- 13.10.5 SWOT Analysis
- 13.10.6 Key Developments
14. Appendix
14.1 About Business Market Insights


 Get Free Sample For Europe Smart Display Market

