1. Introduction
1.1 Business Market Insights Research Report Guidance
1.2 Market Segmentation
2. Executive Summary
2.1 Key Market Insights
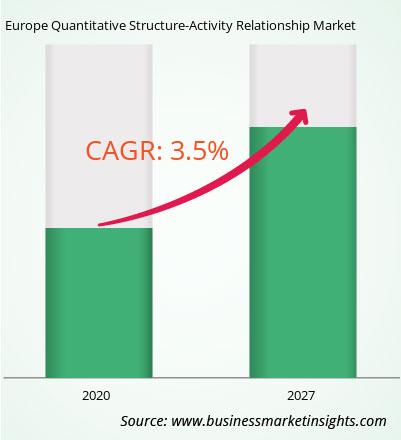
2.2 Market Attractiveness
3. Research Methodology
3.1 Secondary Research
3.2 Primary Research
- 3.2.1 Hypothesis formulation:
- 3.2.2 Macro-economic factor analysis:
- 3.2.3 Developing base number:
- 3.2.4 Data Triangulation:
- 3.2.5 Country level data:
4. Europe Quantitative Structure-Activity Relationship Market Landscape
4.1 Market Overview
4.2 Porter's Five Forces Analysis
- 4.2.1 Bargaining Power of Suppliers
- 4.2.2 Bargaining Power of Buyers
- 4.2.3 Threat of New Entrants
- 4.2.4 Competitive Rivalry
- 4.2.5 Threat of Substitutes
4.3 Ecosystem Analysis
- 4.3.1 Raw Material Suppliers
- 4.3.2 Manufacturers
- 4.3.3 Distributors/Suppliers
- 4.3.4 End Users
5. Europe Quantitative Structure-Activity Relationship Market – Key Market Dynamics
5.4 Impact of Drivers and Restraints
6. Europe Quantitative Structure-Activity Relationship Market Regional Analysis
6.1 Europe Quantitative Structure-Activity Relationship Market Overview
6.2 Europe Quantitative Structure-Activity Relationship Market Revenue 2018-2027 (US$ Million)
6.3 Europe Quantitative Structure-Activity Relationship Market Forecast Analysis
7. Europe Quantitative Structure-Activity Relationship Market Analysis – by Application
7.1 Drug Discovery
- 7.1.1 Overview
- 7.1.2 Drug Discovery: Europe Quantitative Structure-Activity Relationship Market – Revenue and Forecast to 2031 (US$ Million)
7.2 Molecular Modelling
- 7.2.1 Overview
- 7.2.2 Molecular Modelling: Europe Quantitative Structure-Activity Relationship Market – Revenue and Forecast to 2031 (US$ Million)
7.3 Chemical Screening
- 7.3.1 Overview
- 7.3.2 Chemical Screening: Europe Quantitative Structure-Activity Relationship Market – Revenue and Forecast to 2031 (US$ Million)
7.4 Regulatory and Decision-Making
- 7.4.1 Overview
- 7.4.2 Regulatory and Decision-Making: Europe Quantitative Structure-Activity Relationship Market – Revenue and Forecast to 2031 (US$ Million)
8. Europe Quantitative Structure-Activity Relationship Market Analysis – by Industry
8.1 Pharmaceuticals
- 8.1.1 Overview
- 8.1.2 Pharmaceuticals: Europe Quantitative Structure-Activity Relationship Market – Revenue and Forecast to 2027 (US$ Million)
8.2 Cosmetics
- 8.2.1 Overview
- 8.2.2 Cosmetics: Europe Quantitative Structure-Activity Relationship Market – Revenue and Forecast to 2027 (US$ Million)
8.3 Environmental
- 8.3.1 Overview
- 8.3.2 Environmental: Europe Quantitative Structure-Activity Relationship Market – Revenue and Forecast to 2027 (US$ Million)
8.4 Food & Beverage
- 8.4.1 Overview
- 8.4.2 Food & Beverage : Europe Quantitative Structure-Activity Relationship Market – Revenue and Forecast to 2027 (US$ Million)
9. Europe Quantitative Structure-Activity Relationship Market – Europe Analysis
9.1 Europe
- 9.1.1 Europe Quantitative Structure-Activity Relationship Market Breakdown, by Key
Country, 2021 and 2027 (%)
- 9.1.1.1 Europe Quantitative Structure-Activity Relationship Market – Revenue and
Forecast Analysis – by Country
- 9.1.1.1 UK:
Europe Quantitative Structure-Activity Relationship Market – Revenue and Forecast to 2027 (US$ Million)
- 9.1.1.1.1 UK: Europe Quantitative Structure-Activity Relationship Market Breakdown, by Application
- 9.1.1.1.2 UK: Europe Quantitative Structure-Activity Relationship Market Breakdown, by Industry
- 9.1.1.2 Germany:
Europe Quantitative Structure-Activity Relationship Market – Revenue and Forecast to 2027 (US$ Million)
- 9.1.1.2.1 Germany: Europe Quantitative Structure-Activity Relationship Market Breakdown, by Application
- 9.1.1.2.2 Germany: Europe Quantitative Structure-Activity Relationship Market Breakdown, by Industry
- 9.1.1.3 France:
Europe Quantitative Structure-Activity Relationship Market – Revenue and Forecast to 2027 (US$ Million)
- 9.1.1.3.1 France: Europe Quantitative Structure-Activity Relationship Market Breakdown, by Application
- 9.1.1.3.2 France: Europe Quantitative Structure-Activity Relationship Market Breakdown, by Industry
- 9.1.1.4 Russia:
Europe Quantitative Structure-Activity Relationship Market – Revenue and Forecast to 2027 (US$ Million)
- 9.1.1.4.1 Russia: Europe Quantitative Structure-Activity Relationship Market Breakdown, by Application
- 9.1.1.4.2 Russia: Europe Quantitative Structure-Activity Relationship Market Breakdown, by Industry
- 9.1.1.5 Italy:
Europe Quantitative Structure-Activity Relationship Market – Revenue and Forecast to 2027 (US$ Million)
- 9.1.1.5.1 Italy: Europe Quantitative Structure-Activity Relationship Market Breakdown, by Application
- 9.1.1.5.2 Italy: Europe Quantitative Structure-Activity Relationship Market Breakdown, by Industry
- 9.1.1.6 Rest of Europe:
Europe Quantitative Structure-Activity Relationship Market – Revenue and Forecast to 2027 (US$ Million)
- 9.1.1.6.1 Rest of Europe: Europe Quantitative Structure-Activity Relationship Market Breakdown, by Application
- 9.1.1.6.2 Rest of Europe: Europe Quantitative Structure-Activity Relationship Market Breakdown, by Industry
10. Competitive Landscape
10.1 Heat Map Analysis
10.2 Company Positioning and Concentration
11. Europe Quantitative Structure-Activity Relationship Market Industry Landscape
11.1 Overview
11.2 Mergers and Acquisitions
11.3 Agreements, Collaborations, and Joint Ventures
11.4 New Product Launches
11.5 Expansions and Other Strategic Developments
12. Company Profiles
12.1 ProtoQSAR SL
- 12.1.1 Key Facts
- 12.1.2 Business Description
- 12.1.3 Products and Services
- 12.1.4 Financial Overview
- 12.1.5 SWOT Analysis
- 12.1.6 Key Developments
12.2 Intertek Group Plc
- 12.2.1 Key Facts
- 12.2.2 Business Description
- 12.2.3 Products and Services
- 12.2.4 Financial Overview
- 12.2.5 SWOT Analysis
- 12.2.6 Key Developments
12.3 Dassault Systems SE
- 12.3.1 Key Facts
- 12.3.2 Business Description
- 12.3.3 Products and Services
- 12.3.4 Financial Overview
- 12.3.5 SWOT Analysis
- 12.3.6 Key Developments
12.4 Bibra Toxicology Advice & Consulting Ltd
- 12.4.1 Key Facts
- 12.4.2 Business Description
- 12.4.3 Products and Services
- 12.4.4 Financial Overview
- 12.4.5 SWOT Analysis
- 12.4.6 Key Developments
12.5 Laboratory Corporation of America Holdings
- 12.5.1 Key Facts
- 12.5.2 Business Description
- 12.5.3 Products and Services
- 12.5.4 Financial Overview
- 12.5.5 SWOT Analysis
- 12.5.6 Key Developments
12.6 QSAR LAB SP. Z O
- 12.6.1 Key Facts
- 12.6.2 Business Description
- 12.6.3 Products and Services
- 12.6.4 Financial Overview
- 12.6.5 SWOT Analysis
- 12.6.6 Key Developments
13. Appendix
13.1 About Business Market Insights


 Get Free Sample For Europe Quantitative Structure-Activity Relationship Market

