1. Introduction
1.1 Business Market Insights Research Report Guidance
1.2 Market Segmentation
2. Executive Summary
2.1 Key Market Insights
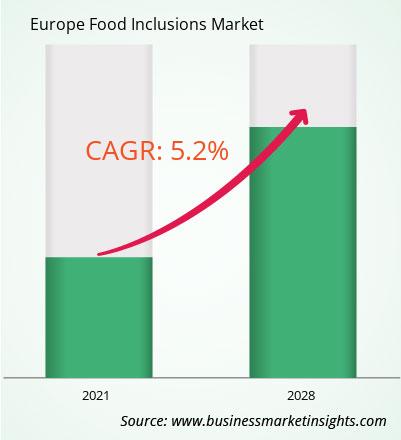
2.2 Market Attractiveness
3. Research Methodology
3.1 Secondary Research
3.2 Primary Research
- 3.2.1 Hypothesis formulation:
- 3.2.2 Macro-economic factor analysis:
- 3.2.3 Developing base number:
- 3.2.4 Data Triangulation:
- 3.2.5 Country level data:
4. Europe Food Inclusions Market Landscape
4.1 Market Overview
4.2 Porter's Five Forces Analysis
- 4.2.1 Bargaining Power of Suppliers
- 4.2.2 Bargaining Power of Buyers
- 4.2.3 Threat of New Entrants
- 4.2.4 Competitive Rivalry
- 4.2.5 Threat of Substitutes
4.3 Ecosystem Analysis
- 4.3.1 Raw Material Suppliers
- 4.3.2 Manufacturers
- 4.3.3 Distributors/Suppliers
- 4.3.4 End Users
5. Europe Food Inclusions Market – Key Market Dynamics
5.1 Growth Drivers
- 5.1.1 Rising consumer preference for healthier, functional foods
- 5.1.2 Growth in demand for premium and indulgent food products
5.2 Market Opportunities
- 5.2.1 Growth in plant-based and dairy-free food inclusions
- 5.2.2 Rising demand for functional food ingredients
5.3 Future Trends
- 5.3.1 Increasing popularity of fruit, nuts, and chocolate inclusions
- 5.3.2 Rising demand for inclusion-based functional foods and snacks
5.4 Impact of Drivers and Restraints
6. Europe Food Inclusions Market Regional Analysis
6.1 Europe Food Inclusions Market Overview
6.2 Europe Food Inclusions Market Revenue 2019-2028 (US$ Million)
6.3 Europe Food Inclusions Market Forecast Analysis
7. Europe Food Inclusions Market Analysis – by Type
7.1 Chocolates
- 7.1.1 Overview
- 7.1.2 Chocolates: Europe Food Inclusions Market – Revenue and Forecast to 2031 (US$ Million)
7.2 Fruit and Nuts
- 7.2.1 Overview
- 7.2.2 Fruit and Nuts: Europe Food Inclusions Market – Revenue and Forecast to 2031 (US$ Million)
7.3 Flavored Sugar and Caramels
- 7.3.1 Overview
- 7.3.2 Flavored Sugar and Caramels: Europe Food Inclusions Market – Revenue and Forecast to 2031 (US$ Million)
8. Europe Food Inclusions Market Analysis – by Form
8.1 Solid
- 8.1.1 Overview
- 8.1.2 Solid: Europe Food Inclusions Market – Revenue and Forecast to 2028 (US$ Million)
8.2 Semi-Solid
- 8.2.1 Overview
- 8.2.2 Semi-Solid: Europe Food Inclusions Market – Revenue and Forecast to 2028 (US$ Million)
9. Europe Food Inclusions Market Analysis – by Application
9.1 Dairy and Frozen Desserts
- 9.1.1 Overview
- 9.1.2 Semi-Solid: Europe Food Inclusions Market – Revenue and Forecast to 2028 (US$ Million)
9.2 Bakery Products
- 9.2.1 Overview
- 9.2.2 Semi-Solid: Europe Food Inclusions Market – Revenue and Forecast to 2028 (US$ Million)
9.3 Breakfast Cereals
- 9.3.1 Overview
- 9.3.2 Semi-Solid: Europe Food Inclusions Market – Revenue and Forecast to 2028 (US$ Million)
9.4 Chocolate
- 9.4.1 Overview
- 9.4.2 Semi-Solid: Europe Food Inclusions Market – Revenue and Forecast to 2028 (US$ Million)
9.5 Confectionery Products
- 9.5.1 Overview
- 9.5.2 Semi-Solid: Europe Food Inclusions Market – Revenue and Forecast to 2028 (US$ Million)
10. Europe Food Inclusions Market – Europe Analysis
10.1 Europe
- 10.1.1 Europe Food Inclusions Market Breakdown, by Key
Country, 2022 and 2028 (%)
- 10.1.1.1 Europe Food Inclusions Market – Revenue and
Forecast Analysis – by Country
- 10.1.1.1 UK:
Europe Food Inclusions Market – Revenue and Forecast to 2028 (US$ Million)
- 10.1.1.1.1 UK: Europe Food Inclusions Market Breakdown, by Type
- 10.1.1.1.2 UK: Europe Food Inclusions Market Breakdown, by Form
- 10.1.1.1.3 UK: Europe Food Inclusions Market Breakdown, by Application
- 10.1.1.2 Germany:
Europe Food Inclusions Market – Revenue and Forecast to 2028 (US$ Million)
- 10.1.1.2.1 Germany: Europe Food Inclusions Market Breakdown, by Type
- 10.1.1.2.2 Germany: Europe Food Inclusions Market Breakdown, by Form
- 10.1.1.2.3 Germany: Europe Food Inclusions Market Breakdown, by Application
- 10.1.1.3 France:
Europe Food Inclusions Market – Revenue and Forecast to 2028 (US$ Million)
- 10.1.1.3.1 France: Europe Food Inclusions Market Breakdown, by Type
- 10.1.1.3.2 France: Europe Food Inclusions Market Breakdown, by Form
- 10.1.1.3.3 France: Europe Food Inclusions Market Breakdown, by Application
- 10.1.1.4 Russia:
Europe Food Inclusions Market – Revenue and Forecast to 2028 (US$ Million)
- 10.1.1.4.1 Russia: Europe Food Inclusions Market Breakdown, by Type
- 10.1.1.4.2 Russia: Europe Food Inclusions Market Breakdown, by Form
- 10.1.1.4.3 Russia: Europe Food Inclusions Market Breakdown, by Application
- 10.1.1.5 Italy:
Europe Food Inclusions Market – Revenue and Forecast to 2028 (US$ Million)
- 10.1.1.5.1 Italy: Europe Food Inclusions Market Breakdown, by Type
- 10.1.1.5.2 Italy: Europe Food Inclusions Market Breakdown, by Form
- 10.1.1.5.3 Italy: Europe Food Inclusions Market Breakdown, by Application
- 10.1.1.6 Rest of Europe:
Europe Food Inclusions Market – Revenue and Forecast to 2028 (US$ Million)
- 10.1.1.6.1 Rest of Europe: Europe Food Inclusions Market Breakdown, by Type
- 10.1.1.6.2 Rest of Europe: Europe Food Inclusions Market Breakdown, by Form
- 10.1.1.6.3 Rest of Europe: Europe Food Inclusions Market Breakdown, by Application
11. Competitive Landscape
11.1 Heat Map Analysis
11.2 Company Positioning and Concentration
12. Europe Food Inclusions Market Industry Landscape
12.1 Overview
12.2 Mergers and Acquisitions
12.3 Agreements, Collaborations, and Joint Ventures
12.4 New Product Launches
12.5 Expansions and Other Strategic Developments
13. Company Profiles
13.1 ADM
- 13.1.1 Key Facts
- 13.1.2 Business Description
- 13.1.3 Products and Services
- 13.1.4 Financial Overview
- 13.1.5 SWOT Analysis
- 13.1.6 Key Developments
13.2 AGRANA Beteiligungs-AG
- 13.2.1 Key Facts
- 13.2.2 Business Description
- 13.2.3 Products and Services
- 13.2.4 Financial Overview
- 13.2.5 SWOT Analysis
- 13.2.6 Key Developments
13.3 Puratos
- 13.3.1 Key Facts
- 13.3.2 Business Description
- 13.3.3 Products and Services
- 13.3.4 Financial Overview
- 13.3.5 SWOT Analysis
- 13.3.6 Key Developments
13.4 Barry Callebaut
- 13.4.1 Key Facts
- 13.4.2 Business Description
- 13.4.3 Products and Services
- 13.4.4 Financial Overview
- 13.4.5 SWOT Analysis
- 13.4.6 Key Developments
13.5 Cargill, Incorporated.
- 13.5.1 Key Facts
- 13.5.2 Business Description
- 13.5.3 Products and Services
- 13.5.4 Financial Overview
- 13.5.5 SWOT Analysis
- 13.5.6 Key Developments
13.6 Kerry Group
- 13.6.1 Key Facts
- 13.6.2 Business Description
- 13.6.3 Products and Services
- 13.6.4 Financial Overview
- 13.6.5 SWOT Analysis
- 13.6.6 Key Developments
13.7 Georgia Nut Company
- 13.7.1 Key Facts
- 13.7.2 Business Description
- 13.7.3 Products and Services
- 13.7.4 Financial Overview
- 13.7.5 SWOT Analysis
- 13.7.6 Key Developments
13.8 Taura Natural Ingredients Ltd
- 13.8.1 Key Facts
- 13.8.2 Business Description
- 13.8.3 Products and Services
- 13.8.4 Financial Overview
- 13.8.5 SWOT Analysis
- 13.8.6 Key Developments
13.9 Sensient Technologies
- 13.9.1 Key Facts
- 13.9.2 Business Description
- 13.9.3 Products and Services
- 13.9.4 Financial Overview
- 13.9.5 SWOT Analysis
- 13.9.6 Key Developments
13.10 Meadow Foods
- 13.10.1 Key Facts
- 13.10.2 Business Description
- 13.10.3 Products and Services
- 13.10.4 Financial Overview
- 13.10.5 SWOT Analysis
- 13.10.6 Key Developments
14. Appendix
14.1 About Business Market Insights


 Get Free Sample For Europe Food Inclusions Market

