1. Introduction
1.1 Business Market Insights Research Report Guidance
1.2 Market Segmentation
2. Executive Summary
2.1 Key Market Insights
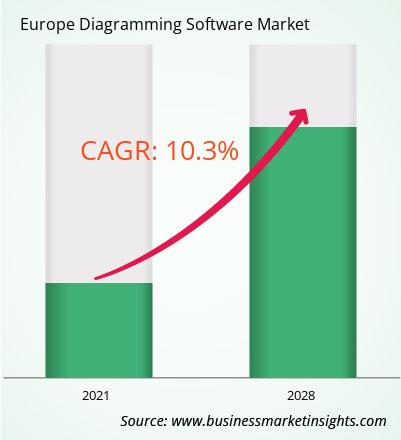
2.2 Market Attractiveness
3. Research Methodology
3.1 Secondary Research
3.2 Primary Research
- 3.2.1 Hypothesis formulation:
- 3.2.2 Macro-economic factor analysis:
- 3.2.3 Developing base number:
- 3.2.4 Data Triangulation:
- 3.2.5 Country level data:
4. Europe Diagramming Software Market Landscape
4.1 Market Overview
4.2 Porter's Five Forces Analysis
- 4.2.1 Bargaining Power of Suppliers
- 4.2.2 Bargaining Power of Buyers
- 4.2.3 Threat of New Entrants
- 4.2.4 Competitive Rivalry
- 4.2.5 Threat of Substitutes
4.3 Ecosystem Analysis
- 4.3.1 Raw Material Suppliers
- 4.3.2 Manufacturers
- 4.3.3 Distributors/Suppliers
- 4.3.4 End Users
5. Europe Diagramming Software Market – Key Market Dynamics
5.1 Growth Drivers
- 5.1.1 Growing adoption of cloud-based diagramming software
5.2 Market Opportunities
- 5.2.1 Benefits of diagramming tools in the corporate sector
5.3 Future Trends
- 5.3.1 Investment to digitalize the education sector in the developing nations
5.4 Impact of Drivers and Restraints
6. Europe Diagramming Software Market Regional Analysis
6.1 Europe Diagramming Software Market Overview
6.2 Europe Diagramming Software Market Revenue 2019-2028 (US$ Million)
6.3 Europe Diagramming Software Market Forecast Analysis
7. Europe Diagramming Software Market Analysis – by Deployment Type
7.1 Cloud
- 7.1.1 Overview
- 7.1.2 Cloud: Europe Diagramming Software Market – Revenue and Forecast to 2031 (US$ Million)
7.2 On-Premises
- 7.2.1 Overview
- 7.2.2 On-Premises: Europe Diagramming Software Market – Revenue and Forecast to 2031 (US$ Million)
8. Europe Diagramming Software Market Analysis – by Enterprise Size
8.1 Small & Medium-Size Enterprises
- 8.1.1 Overview
- 8.1.2 Small & Medium-Size Enterprises: Europe Diagramming Software Market – Revenue and Forecast to 2028 (US$ Million)
8.2 Large Enterprises
- 8.2.1 Overview
- 8.2.2 Large Enterprises: Europe Diagramming Software Market – Revenue and Forecast to 2028 (US$ Million)
9. Europe Diagramming Software Market Analysis – by Application
9.1 Educational Institutions
- 9.1.1 Overview
- 9.1.2 Large Enterprises: Europe Diagramming Software Market – Revenue and Forecast to 2028 (US$ Million)
9.2 Corporates
- 9.2.1 Overview
- 9.2.2 Large Enterprises: Europe Diagramming Software Market – Revenue and Forecast to 2028 (US$ Million)
9.3 Personal
- 9.3.1 Overview
- 9.3.2 Large Enterprises: Europe Diagramming Software Market – Revenue and Forecast to 2028 (US$ Million)
10. Europe Diagramming Software Market – Europe Analysis
10.1 Europe
- 10.1.1 Europe Diagramming Software Market Breakdown, by Key
Country, 2022 and 2028 (%)
- 10.1.1.1 Europe Diagramming Software Market – Revenue and
Forecast Analysis – by Country
- 10.1.1.1 UK:
Europe Diagramming Software Market – Revenue and Forecast to 2028 (US$ Million)
- 10.1.1.1.1 UK: Europe Diagramming Software Market Breakdown, by Deployment Type
- 10.1.1.1.2 UK: Europe Diagramming Software Market Breakdown, by Enterprise Size
- 10.1.1.1.3 UK: Europe Diagramming Software Market Breakdown, by Application
- 10.1.1.2 Germany:
Europe Diagramming Software Market – Revenue and Forecast to 2028 (US$ Million)
- 10.1.1.2.1 Germany: Europe Diagramming Software Market Breakdown, by Deployment Type
- 10.1.1.2.2 Germany: Europe Diagramming Software Market Breakdown, by Enterprise Size
- 10.1.1.2.3 Germany: Europe Diagramming Software Market Breakdown, by Application
- 10.1.1.3 France:
Europe Diagramming Software Market – Revenue and Forecast to 2028 (US$ Million)
- 10.1.1.3.1 France: Europe Diagramming Software Market Breakdown, by Deployment Type
- 10.1.1.3.2 France: Europe Diagramming Software Market Breakdown, by Enterprise Size
- 10.1.1.3.3 France: Europe Diagramming Software Market Breakdown, by Application
- 10.1.1.4 Russia:
Europe Diagramming Software Market – Revenue and Forecast to 2028 (US$ Million)
- 10.1.1.4.1 Russia: Europe Diagramming Software Market Breakdown, by Deployment Type
- 10.1.1.4.2 Russia: Europe Diagramming Software Market Breakdown, by Enterprise Size
- 10.1.1.4.3 Russia: Europe Diagramming Software Market Breakdown, by Application
- 10.1.1.5 Italy:
Europe Diagramming Software Market – Revenue and Forecast to 2028 (US$ Million)
- 10.1.1.5.1 Italy: Europe Diagramming Software Market Breakdown, by Deployment Type
- 10.1.1.5.2 Italy: Europe Diagramming Software Market Breakdown, by Enterprise Size
- 10.1.1.5.3 Italy: Europe Diagramming Software Market Breakdown, by Application
- 10.1.1.6 Rest of Europe:
Europe Diagramming Software Market – Revenue and Forecast to 2028 (US$ Million)
- 10.1.1.6.1 Rest of Europe: Europe Diagramming Software Market Breakdown, by Deployment Type
- 10.1.1.6.2 Rest of Europe: Europe Diagramming Software Market Breakdown, by Enterprise Size
- 10.1.1.6.3 Rest of Europe: Europe Diagramming Software Market Breakdown, by Application
11. Competitive Landscape
11.1 Heat Map Analysis
11.2 Company Positioning and Concentration
12. Europe Diagramming Software Market Industry Landscape
12.1 Overview
12.2 Mergers and Acquisitions
12.3 Agreements, Collaborations, and Joint Ventures
12.4 New Product Launches
12.5 Expansions and Other Strategic Developments
13. Company Profiles
13.1 CREATELY (CINERGIX PTY LTD)
- 13.1.1 Key Facts
- 13.1.2 Business Description
- 13.1.3 Products and Services
- 13.1.4 Financial Overview
- 13.1.5 SWOT Analysis
- 13.1.6 Key Developments
13.2 DRAW.IO (//SEIBERT/MEDIA GMBH)
- 13.2.1 Key Facts
- 13.2.2 Business Description
- 13.2.3 Products and Services
- 13.2.4 Financial Overview
- 13.2.5 SWOT Analysis
- 13.2.6 Key Developments
13.3 Edrawsoft
- 13.3.1 Key Facts
- 13.3.2 Business Description
- 13.3.3 Products and Services
- 13.3.4 Financial Overview
- 13.3.5 SWOT Analysis
- 13.3.6 Key Developments
13.4 Gliffy (Perforce Software, Inc.)
- 13.4.1 Key Facts
- 13.4.2 Business Description
- 13.4.3 Products and Services
- 13.4.4 Financial Overview
- 13.4.5 SWOT Analysis
- 13.4.6 Key Developments
13.5 Lucid Software Inc
- 13.5.1 Key Facts
- 13.5.2 Business Description
- 13.5.3 Products and Services
- 13.5.4 Financial Overview
- 13.5.5 SWOT Analysis
- 13.5.6 Key Developments
13.6 Microsoft Corporation
- 13.6.1 Key Facts
- 13.6.2 Business Description
- 13.6.3 Products and Services
- 13.6.4 Financial Overview
- 13.6.5 SWOT Analysis
- 13.6.6 Key Developments
13.7 Miro
- 13.7.1 Key Facts
- 13.7.2 Business Description
- 13.7.3 Products and Services
- 13.7.4 Financial Overview
- 13.7.5 SWOT Analysis
- 13.7.6 Key Developments
13.8 MYDRAW (NEVRON SOFTWARE LLC)
- 13.8.1 Key Facts
- 13.8.2 Business Description
- 13.8.3 Products and Services
- 13.8.4 Financial Overview
- 13.8.5 SWOT Analysis
- 13.8.6 Key Developments
13.9 Nulab Inc
- 13.9.1 Key Facts
- 13.9.2 Business Description
- 13.9.3 Products and Services
- 13.9.4 Financial Overview
- 13.9.5 SWOT Analysis
- 13.9.6 Key Developments
13.10 Samepage.io
- 13.10.1 Key Facts
- 13.10.2 Business Description
- 13.10.3 Products and Services
- 13.10.4 Financial Overview
- 13.10.5 SWOT Analysis
- 13.10.6 Key Developments
13.11 SmartDraw, LLC
- 13.11.1 Key Facts
- 13.11.2 Business Description
- 13.11.3 Products and Services
- 13.11.4 Financial Overview
- 13.11.5 SWOT Analysis
- 13.11.6 Key Developments
14. Appendix
14.1 About Business Market Insights


 Get Free Sample For Europe Diagramming Software Market

