1. Introduction
1.1 Business Market Insights Research Report Guidance
1.2 Market Segmentation
2. Executive Summary
2.1 Key Market Insights
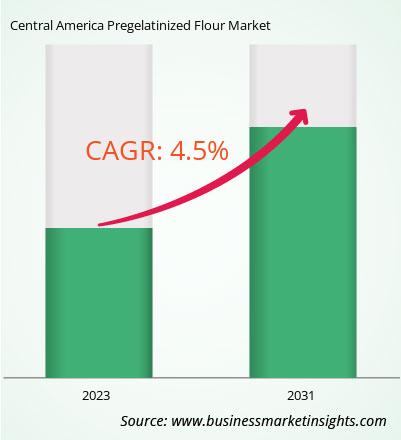
2.2 Market Attractiveness
3. Research Methodology
3.1 Secondary Research
3.2 Primary Research
- 3.2.1 Hypothesis formulation:
- 3.2.2 Macro-economic factor analysis:
- 3.2.3 Developing base number:
- 3.2.4 Data Triangulation:
- 3.2.5 Country level data:
4. Central America Pregelatinized Flour Market Landscape
4.1 Market Overview
4.2 Porter's Five Forces Analysis
- 4.2.1 Bargaining Power of Suppliers
- 4.2.2 Bargaining Power of Buyers
- 4.2.3 Threat of New Entrants
- 4.2.4 Competitive Rivalry
- 4.2.5 Threat of Substitutes
4.3 Ecosystem Analysis
- 4.3.1 Raw Material Suppliers
- 4.3.2 Manufacturers
- 4.3.3 Distributors/Suppliers
- 4.3.4 End Users
5. Central America Pregelatinized Flour Market – Key Market Dynamics
5.1 Growth Drivers
- 5.1.1 Growth in Food and Beverages Industry
- 5.1.2 Numerous Applications of Pregelatinized Flour in Pharmaceuticals and Nutraceuticals Industries
5.2 Market Opportunities
- 5.2.1 Growing Consumer Awareness and Preferences
5.3 Future Trends
- 5.3.1 Surging Demand for Organic Pregelatinized Flour
5.4 Impact of Drivers and Restraints
6. Central America Pregelatinized Flour Market Country Analysis
6.1 Central America Pregelatinized Flour Market Overview
6.2 Central America Pregelatinized Flour Market Revenue 2021-2031 (US$ Million)
6.3 Central America Pregelatinized Flour Market Forecast Analysis
7. Central America Pregelatinized Flour Market Analysis – by Nature
7.1 Organic
- 7.1.1 Overview
- 7.1.2 Organic: Central America Pregelatinized Flour Market – Revenue and Forecast to 2031 (US$ Million)
7.2 Conventional
- 7.2.1 Overview
- 7.2.2 Conventional: Central America Pregelatinized Flour Market – Revenue and Forecast to 2031 (US$ Million)
8. Central America Pregelatinized Flour Market Analysis – by Source
8.1 Wheat
- 8.1.1 Overview
- 8.1.2 Wheat: Central America Pregelatinized Flour Market – Revenue and Forecast to 2031 (US$ Million)
8.2 Rice
- 8.2.1 Overview
- 8.2.2 Rice: Central America Pregelatinized Flour Market – Revenue and Forecast to 2031 (US$ Million)
8.3 Corn
- 8.3.1 Overview
- 8.3.2 Corn: Central America Pregelatinized Flour Market – Revenue and Forecast to 2031 (US$ Million)
9. Central America Pregelatinized Flour Market Analysis – by Application
9.1 Food and Beverages
- 9.1.1 Overview
- 9.1.2 Corn: Central America Pregelatinized Flour Market – Revenue and Forecast to 2031 (US$ Million)
9.2 Animal Nutrition
- 9.2.1 Overview
- 9.2.2 Corn: Central America Pregelatinized Flour Market – Revenue and Forecast to 2031 (US$ Million)
10. Central America Pregelatinized Flour Market – Central America (Belize, Costa Rica, El Salvador, Guatemala, Honduras, Nicaragua, Panama) Analysis
10.1 Central America (Belize, Costa Rica, El Salvador, Guatemala, Honduras, Nicaragua, Panama)
- 10.1.1 Central America (Belize, Costa Rica, El Salvador, Guatemala, Honduras, Nicaragua, Panama): Central America Pregelatinized Flour Market – Revenue
and Forecast to 2031 (US$ Million)
- 10.1.1.1 Central America (Belize, Costa Rica, El Salvador, Guatemala, Honduras, Nicaragua, Panama):
Central America Pregelatinized Flour Market Breakdown, by Nature
- 10.1.1.2 Central America (Belize, Costa Rica, El Salvador, Guatemala, Honduras, Nicaragua, Panama):
Central America Pregelatinized Flour Market Breakdown, by Source
- 10.1.1.3 Central America (Belize, Costa Rica, El Salvador, Guatemala, Honduras, Nicaragua, Panama):
Central America Pregelatinized Flour Market Breakdown, by Application
11. Competitive Landscape
11.1 Heat Map Analysis
11.2 Company Positioning and Concentration
12. Central America Pregelatinized Flour Market Industry Landscape
12.1 Overview
12.2 Mergers and Acquisitions
12.3 Agreements, Collaborations, and Joint Ventures
12.4 New Product Launches
12.5 Expansions and Other Strategic Developments
13. Company Profiles
13.1 Cargill Inc
- 13.1.1 Key Facts
- 13.1.2 Business Description
- 13.1.3 Products and Services
- 13.1.4 Financial Overview
- 13.1.5 SWOT Analysis
- 13.1.6 Key Developments
13.2 Roquette Freres SA
- 13.2.1 Key Facts
- 13.2.2 Business Description
- 13.2.3 Products and Services
- 13.2.4 Financial Overview
- 13.2.5 SWOT Analysis
- 13.2.6 Key Developments
13.3 Agrana Beteiligungs AG
- 13.3.1 Key Facts
- 13.3.2 Business Description
- 13.3.3 Products and Services
- 13.3.4 Financial Overview
- 13.3.5 SWOT Analysis
- 13.3.6 Key Developments
13.4 Ingredion Inc
- 13.4.1 Key Facts
- 13.4.2 Business Description
- 13.4.3 Products and Services
- 13.4.4 Financial Overview
- 13.4.5 SWOT Analysis
- 13.4.6 Key Developments
13.5 Tate & Lyle Plc
- 13.5.1 Key Facts
- 13.5.2 Business Description
- 13.5.3 Products and Services
- 13.5.4 Financial Overview
- 13.5.5 SWOT Analysis
- 13.5.6 Key Developments
13.6 KMC Amba
- 13.6.1 Key Facts
- 13.6.2 Business Description
- 13.6.3 Products and Services
- 13.6.4 Financial Overview
- 13.6.5 SWOT Analysis
- 13.6.6 Key Developments
13.7 Associated British Foods Plc
- 13.7.1 Key Facts
- 13.7.2 Business Description
- 13.7.3 Products and Services
- 13.7.4 Financial Overview
- 13.7.5 SWOT Analysis
- 13.7.6 Key Developments
13.8 Codrico Rotterdam BV
- 13.8.1 Key Facts
- 13.8.2 Business Description
- 13.8.3 Products and Services
- 13.8.4 Financial Overview
- 13.8.5 SWOT Analysis
- 13.8.6 Key Developments
13.9 Les Moulins de Soulanges
- 13.9.1 Key Facts
- 13.9.2 Business Description
- 13.9.3 Products and Services
- 13.9.4 Financial Overview
- 13.9.5 SWOT Analysis
- 13.9.6 Key Developments
13.10 SMS Group
- 13.10.1 Key Facts
- 13.10.2 Business Description
- 13.10.3 Products and Services
- 13.10.4 Financial Overview
- 13.10.5 SWOT Analysis
- 13.10.6 Key Developments
14. Appendix
14.1 About Business Market Insights


 Get Free Sample For Central America Pregelatinized Flour Market

