1. Introduction
1.1 Business Market Insights Research Report Guidance
1.2 Market Segmentation
2. Executive Summary
2.1 Key Market Insights
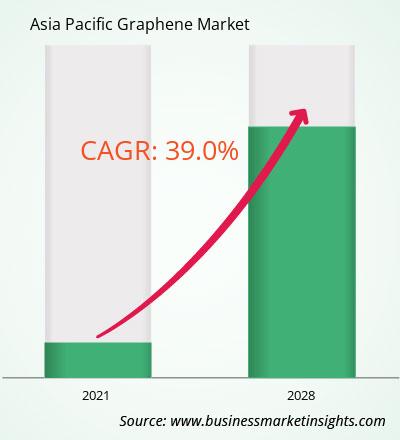
2.2 Market Attractiveness
3. Research Methodology
3.1 Secondary Research
3.2 Primary Research
- 3.2.1 Hypothesis formulation:
- 3.2.2 Macro-economic factor analysis:
- 3.2.3 Developing base number:
- 3.2.4 Data Triangulation:
- 3.2.5 Country level data:
4. Asia Pacific Graphene Market Landscape
4.1 Market Overview
4.2 Porter's Five Forces Analysis
- 4.2.1 Bargaining Power of Suppliers
- 4.2.2 Bargaining Power of Buyers
- 4.2.3 Threat of New Entrants
- 4.2.4 Competitive Rivalry
- 4.2.5 Threat of Substitutes
4.3 Ecosystem Analysis
- 4.3.1 Raw Material Suppliers
- 4.3.2 Manufacturers
- 4.3.3 Distributors/Suppliers
- 4.3.4 End Users
5. Asia Pacific Graphene Market – Key Market Dynamics
5.1 Growth Drivers
- 5.1.1 Advancements in electronic applications
- 5.1.2 Increased demand for flexible electronics
- 5.1.3 Growth in energy storage solutions
5.2 Market Opportunities
- 5.2.1 Emerging use in batteries and supercapacitors
- 5.2.2 Innovations in composite materials
- 5.2.3 Expansion in medical device applications
5.3 Future Trends
- 5.3.1 Higher production efficiency development
- 5.3.2 Increased use in nanocomposites
- 5.3.3 Advanced graphene-based sensors
5.4 Impact of Drivers and Restraints
6. Asia Pacific Graphene Market Regional Analysis
6.1 Asia Pacific Graphene Market Overview
6.2 Asia Pacific Graphene Market Revenue 2019-2028 (US$ Million)
6.3 Asia Pacific Graphene Market Forecast Analysis
7. Asia Pacific Graphene Market Analysis – by Type
7.1 Monolayer and Bilayer
- 7.1.1 Overview
- 7.1.2 Monolayer and Bilayer: Asia Pacific Graphene Market – Revenue and Forecast to 2031 (US$ Million)
7.2 Graphene Nano-platelets
- 7.2.1 Overview
- 7.2.2 Graphene Nano-platelets: Asia Pacific Graphene Market – Revenue and Forecast to 2031 (US$ Million)
7.3 Graphene Oxide
- 7.3.1 Overview
- 7.3.2 Graphene Oxide: Asia Pacific Graphene Market – Revenue and Forecast to 2031 (US$ Million)
8. Asia Pacific Graphene Market Analysis – by Application
8.1 Composites
- 8.1.1 Overview
- 8.1.2 Composites: Asia Pacific Graphene Market – Revenue and Forecast to 2028 (US$ Million)
8.2 Functional Inks
- 8.2.1 Overview
- 8.2.2 Functional Inks: Asia Pacific Graphene Market – Revenue and Forecast to 2028 (US$ Million)
8.3 Paints & Coatings
- 8.3.1 Overview
- 8.3.2 Paints & Coatings: Asia Pacific Graphene Market – Revenue and Forecast to 2028 (US$ Million)
8.4 Energy Storage
- 8.4.1 Overview
- 8.4.2 Energy Storage: Asia Pacific Graphene Market – Revenue and Forecast to 2028 (US$ Million)
8.5 Electronics
- 8.5.1 Overview
- 8.5.2 Electronics: Asia Pacific Graphene Market – Revenue and Forecast to 2028 (US$ Million)
8.6 Polymer Additives
- 8.6.1 Overview
- 8.6.2 Polymer Additives: Asia Pacific Graphene Market – Revenue and Forecast to 2028 (US$ Million)
8.7 RFID
- 8.7.1 Overview
- 8.7.2 RFID: Asia Pacific Graphene Market – Revenue and Forecast to 2028 (US$ Million)
9. Asia Pacific Graphene Market – Asia-Pacific Analysis
9.1 Asia-Pacific
- 9.1.1 Asia Pacific Graphene Market Breakdown, by Key
Country, 2022 and 2028 (%)
- 9.1.1.1 Asia Pacific Graphene Market – Revenue and
Forecast Analysis – by Country
- 9.1.1.1 China:
Asia Pacific Graphene Market – Revenue and Forecast to 2028 (US$ Million)
- 9.1.1.1.1 China: Asia Pacific Graphene Market Breakdown, by Type
- 9.1.1.1.2 China: Asia Pacific Graphene Market Breakdown, by Application
- 9.1.1.2 India:
Asia Pacific Graphene Market – Revenue and Forecast to 2028 (US$ Million)
- 9.1.1.2.1 India: Asia Pacific Graphene Market Breakdown, by Type
- 9.1.1.2.2 India: Asia Pacific Graphene Market Breakdown, by Application
- 9.1.1.3 Japan:
Asia Pacific Graphene Market – Revenue and Forecast to 2028 (US$ Million)
- 9.1.1.3.1 Japan: Asia Pacific Graphene Market Breakdown, by Type
- 9.1.1.3.2 Japan: Asia Pacific Graphene Market Breakdown, by Application
- 9.1.1.4 Australia:
Asia Pacific Graphene Market – Revenue and Forecast to 2028 (US$ Million)
- 9.1.1.4.1 Australia: Asia Pacific Graphene Market Breakdown, by Type
- 9.1.1.4.2 Australia: Asia Pacific Graphene Market Breakdown, by Application
- 9.1.1.5 Rest of Asia-Pacific :
Asia Pacific Graphene Market – Revenue and Forecast to 2028 (US$ Million)
- 9.1.1.5.1 Rest of Asia-Pacific : Asia Pacific Graphene Market Breakdown, by Type
- 9.1.1.5.2 Rest of Asia-Pacific : Asia Pacific Graphene Market Breakdown, by Application
10. Competitive Landscape
10.1 Heat Map Analysis
10.2 Company Positioning and Concentration
11. Asia Pacific Graphene Market Industry Landscape
11.1 Overview
11.2 Mergers and Acquisitions
11.3 Agreements, Collaborations, and Joint Ventures
11.4 New Product Launches
11.5 Expansions and Other Strategic Developments
12. Company Profiles
12.1 XG Sciences
- 12.1.1 Key Facts
- 12.1.2 Business Description
- 12.1.3 Products and Services
- 12.1.4 Financial Overview
- 12.1.5 SWOT Analysis
- 12.1.6 Key Developments
12.2 The Sixth Element Materials Technology Co., Ltd
- 12.2.1 Key Facts
- 12.2.2 Business Description
- 12.2.3 Products and Services
- 12.2.4 Financial Overview
- 12.2.5 SWOT Analysis
- 12.2.6 Key Developments
12.3 Global Graphene Group
- 12.3.1 Key Facts
- 12.3.2 Business Description
- 12.3.3 Products and Services
- 12.3.4 Financial Overview
- 12.3.5 SWOT Analysis
- 12.3.6 Key Developments
12.4 Graphenea, Inc.
- 12.4.1 Key Facts
- 12.4.2 Business Description
- 12.4.3 Products and Services
- 12.4.4 Financial Overview
- 12.4.5 SWOT Analysis
- 12.4.6 Key Developments
12.5 Directa Plus S.P.A
- 12.5.1 Key Facts
- 12.5.2 Business Description
- 12.5.3 Products and Services
- 12.5.4 Financial Overview
- 12.5.5 SWOT Analysis
- 12.5.6 Key Developments
12.6 AVANZARE INNOVACION TECNOLOGICA S.L.
- 12.6.1 Key Facts
- 12.6.2 Business Description
- 12.6.3 Products and Services
- 12.6.4 Financial Overview
- 12.6.5 SWOT Analysis
- 12.6.6 Key Developments
12.7 Thomas Swan & Co. Ltd.
- 12.7.1 Key Facts
- 12.7.2 Business Description
- 12.7.3 Products and Services
- 12.7.4 Financial Overview
- 12.7.5 SWOT Analysis
- 12.7.6 Key Developments
12.8 Morsh
- 12.8.1 Key Facts
- 12.8.2 Business Description
- 12.8.3 Products and Services
- 12.8.4 Financial Overview
- 12.8.5 SWOT Analysis
- 12.8.6 Key Developments
12.9 Perpetuus Advanced Materials PLC
- 12.9.1 Key Facts
- 12.9.2 Business Description
- 12.9.3 Products and Services
- 12.9.4 Financial Overview
- 12.9.5 SWOT Analysis
- 12.9.6 Key Developments
13. Appendix
13.1 About Business Market Insights


 Get Free Sample For Asia Pacific Graphene Market

