1. Introduction
1.1 Business Market Insights Research Report Guidance
1.2 Market Segmentation
2. Executive Summary
2.1 Key Market Insights
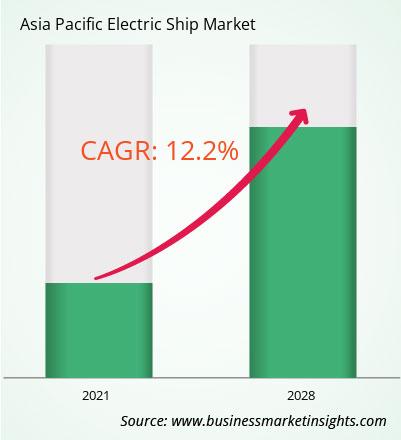
2.2 Market Attractiveness
3. Research Methodology
3.1 Secondary Research
3.2 Primary Research
- 3.2.1 Hypothesis formulation:
- 3.2.2 Macro-economic factor analysis:
- 3.2.3 Developing base number:
- 3.2.4 Data Triangulation:
- 3.2.5 Country level data:
4. Asia Pacific Electric Ship Market Landscape
4.1 Market Overview
4.2 Porter's Five Forces Analysis
- 4.2.1 Bargaining Power of Suppliers
- 4.2.2 Bargaining Power of Buyers
- 4.2.3 Threat of New Entrants
- 4.2.4 Competitive Rivalry
- 4.2.5 Threat of Substitutes
4.3 Ecosystem Analysis
- 4.3.1 Raw Material Suppliers
- 4.3.2 Manufacturers
- 4.3.3 Distributors/Suppliers
- 4.3.4 End Users
5. Asia Pacific Electric Ship Market – Key Market Dynamics
5.1 Growth Drivers
- 5.1.1
- 5.1.2 Increasing environmental concerns
- 5.1.3 Rising fuel costs
- 5.1.4 Government incentives
- 5.1.5 Technological advancements
- 5.1.6 Growing demand for sustainable shipping
- 5.1.7 Expanding maritime trade
- 5.1.8 Stricter emission regulations
5.2 Market Opportunities
- 5.2.1
- 5.2.2 Development of advanced battery technologies
- 5.2.3 Infrastructure development for charging and refueling
- 5.2.4 Government support and policies
- 5.2.5 Collaboration between industry players
- 5.2.6 Research and development in electric propulsion systems
- 5.2.7 Expansion of the electric ship market to various segments
- 5.2.8 Integration of renewable energy sources
5.3 Future Trends
- 5.3.1
- 5.3.2 Autonomous and remote-controlled electric ships
- 5.3.3 Integration of artificial intelligence and machine learning
- 5.3.4 Development of hydrogen-powered electric ships
- 5.3.5 Increased use of renewable energy sources for propulsion
- 5.3.6 Advancements in battery technology and energy storage systems
- 5.3.7 Expansion of electric ship operations to new markets and regions
- 5.3.8 Collaborative efforts between industry, academia, and government to accelerate innovation
5.4 Impact of Drivers and Restraints
6. Asia Pacific Electric Ship Market Regional Analysis
6.1 Asia Pacific Electric Ship Market Overview
6.2 Asia Pacific Electric Ship Market Revenue 2019-2028 (US$ Million)
6.3 Asia Pacific Electric Ship Market Forecast Analysis
7. Asia Pacific Electric Ship Market Analysis – by Type
7.1 Battery Electric Ships
- 7.1.1 Overview
- 7.1.2 Battery Electric Ships: Asia Pacific Electric Ship Market – Revenue and Forecast to 2031 (US$ Million)
7.2 Plug-In Hybrid Electric Ships
- 7.2.1 Overview
- 7.2.2 Plug-In Hybrid Electric Ships: Asia Pacific Electric Ship Market – Revenue and Forecast to 2031 (US$ Million)
7.3 Hybrid Electric Ships
- 7.3.1 Overview
- 7.3.2 Hybrid Electric Ships: Asia Pacific Electric Ship Market – Revenue and Forecast to 2031 (US$ Million)
8. Asia Pacific Electric Ship Market Analysis – by Power
8.1 Less than 75 Kw
- 8.1.1 Overview
- 8.1.2 Less than 75 Kw: Asia Pacific Electric Ship Market – Revenue and Forecast to 2028 (US$ Million)
8.2 75-150 Kw
- 8.2.1 Overview
- 8.2.2 75-150 Kw: Asia Pacific Electric Ship Market – Revenue and Forecast to 2028 (US$ Million)
8.3 151-745 Kw
- 8.3.1 Overview
- 8.3.2 151-745 Kw: Asia Pacific Electric Ship Market – Revenue and Forecast to 2028 (US$ Million)
8.4 746-7560 Kw
- 8.4.1 Overview
- 8.4.2 746-7560 Kw: Asia Pacific Electric Ship Market – Revenue and Forecast to 2028 (US$ Million)
8.5 More than 7560 Kw
- 8.5.1 Overview
- 8.5.2 More than 7560 Kw: Asia Pacific Electric Ship Market – Revenue and Forecast to 2028 (US$ Million)
9. Asia Pacific Electric Ship Market Analysis – by Range
9.1 Less than 50 Km
- 9.1.1 Overview
- 9.1.2 More than 7560 Kw: Asia Pacific Electric Ship Market – Revenue and Forecast to 2028 (US$ Million)
9.2 50-100 Km
- 9.2.1 Overview
- 9.2.2 More than 7560 Kw: Asia Pacific Electric Ship Market – Revenue and Forecast to 2028 (US$ Million)
9.3 101-1000 Km
- 9.3.1 Overview
- 9.3.2 More than 7560 Kw: Asia Pacific Electric Ship Market – Revenue and Forecast to 2028 (US$ Million)
9.4 More than 1000 Km
- 9.4.1 Overview
- 9.4.2 More than 7560 Kw: Asia Pacific Electric Ship Market – Revenue and Forecast to 2028 (US$ Million)
10. Asia Pacific Electric Ship Market – Asia-Pacific Analysis
10.1 Asia-Pacific
- 10.1.1 Asia Pacific Electric Ship Market Breakdown, by Key
Country, 2022 and 2028 (%)
- 10.1.1.1 Asia Pacific Electric Ship Market – Revenue and
Forecast Analysis – by Country
- 10.1.1.1 China:
Asia Pacific Electric Ship Market – Revenue and Forecast to 2028 (US$ Million)
- 10.1.1.1.1 China: Asia Pacific Electric Ship Market Breakdown, by Type
- 10.1.1.1.2 China: Asia Pacific Electric Ship Market Breakdown, by Power
- 10.1.1.1.3 China: Asia Pacific Electric Ship Market Breakdown, by Range
- 10.1.1.2 India:
Asia Pacific Electric Ship Market – Revenue and Forecast to 2028 (US$ Million)
- 10.1.1.2.1 India: Asia Pacific Electric Ship Market Breakdown, by Type
- 10.1.1.2.2 India: Asia Pacific Electric Ship Market Breakdown, by Power
- 10.1.1.2.3 India: Asia Pacific Electric Ship Market Breakdown, by Range
- 10.1.1.3 Japan:
Asia Pacific Electric Ship Market – Revenue and Forecast to 2028 (US$ Million)
- 10.1.1.3.1 Japan: Asia Pacific Electric Ship Market Breakdown, by Type
- 10.1.1.3.2 Japan: Asia Pacific Electric Ship Market Breakdown, by Power
- 10.1.1.3.3 Japan: Asia Pacific Electric Ship Market Breakdown, by Range
- 10.1.1.4 Australia:
Asia Pacific Electric Ship Market – Revenue and Forecast to 2028 (US$ Million)
- 10.1.1.4.1 Australia: Asia Pacific Electric Ship Market Breakdown, by Type
- 10.1.1.4.2 Australia: Asia Pacific Electric Ship Market Breakdown, by Power
- 10.1.1.4.3 Australia: Asia Pacific Electric Ship Market Breakdown, by Range
- 10.1.1.5 Rest of Asia-Pacific :
Asia Pacific Electric Ship Market – Revenue and Forecast to 2028 (US$ Million)
- 10.1.1.5.1 Rest of Asia-Pacific : Asia Pacific Electric Ship Market Breakdown, by Type
- 10.1.1.5.2 Rest of Asia-Pacific : Asia Pacific Electric Ship Market Breakdown, by Power
- 10.1.1.5.3 Rest of Asia-Pacific : Asia Pacific Electric Ship Market Breakdown, by Range
11. Competitive Landscape
11.1 Heat Map Analysis
11.2 Company Positioning and Concentration
12. Asia Pacific Electric Ship Market Industry Landscape
12.1 Overview
12.2 Mergers and Acquisitions
12.3 Agreements, Collaborations, and Joint Ventures
12.4 New Product Launches
12.5 Expansions and Other Strategic Developments
13. Company Profiles
13.1 BAE System
- 13.1.1 Key Facts
- 13.1.2 Business Description
- 13.1.3 Products and Services
- 13.1.4 Financial Overview
- 13.1.5 SWOT Analysis
- 13.1.6 Key Developments
13.2 MAN Energy Solution
- 13.2.1 Key Facts
- 13.2.2 Business Description
- 13.2.3 Products and Services
- 13.2.4 Financial Overview
- 13.2.5 SWOT Analysis
- 13.2.6 Key Developments
13.3 Siemens Energy
- 13.3.1 Key Facts
- 13.3.2 Business Description
- 13.3.3 Products and Services
- 13.3.4 Financial Overview
- 13.3.5 SWOT Analysis
- 13.3.6 Key Developments
13.4 Vard AS
- 13.4.1 Key Facts
- 13.4.2 Business Description
- 13.4.3 Products and Services
- 13.4.4 Financial Overview
- 13.4.5 SWOT Analysis
- 13.4.6 Key Developments
14. Appendix
14.1 About Business Market Insights


 Get Free Sample For Asia Pacific Electric Ship Market

