analysis - by Component (Software and Service), Type (Descriptive Analytics, Predictive Analytics, and Prescriptive Analytics), Deployment (On-Premise and Cloud), and Application (Financial Management, Risk Management, Governance and Compliance Management, Supplier Sourcing and Performance Management, Demand and Supply Forecasting, and Others)
No. of Pages:
78
|
Report Code:
BMIRE00030563
|
Category:
Technology, Media and Telecommunications
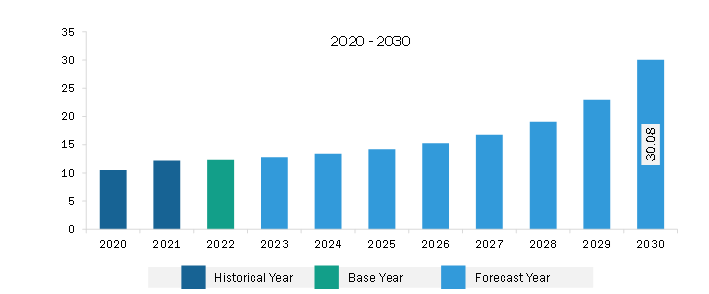
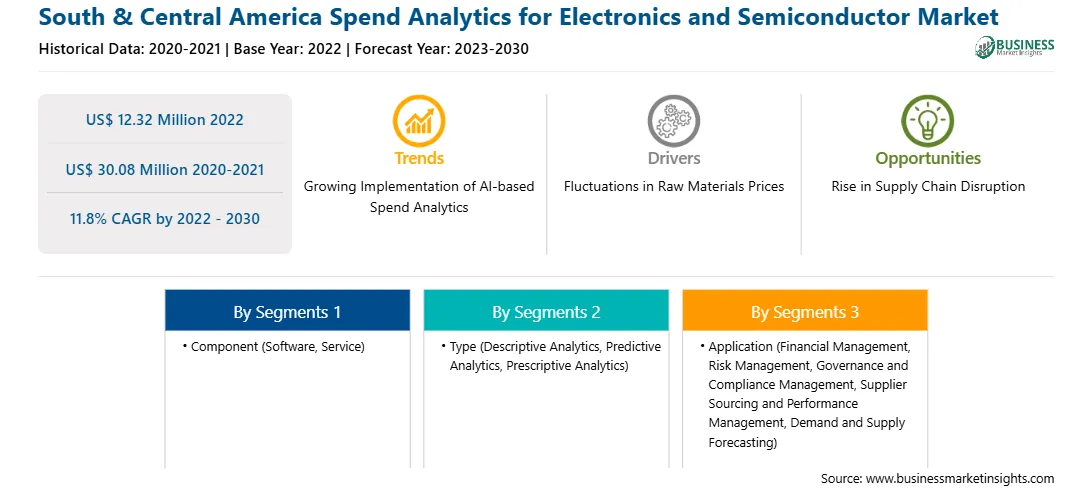
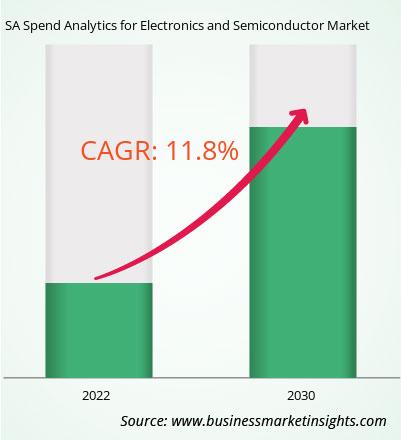
The South & Central America spend analytics for electronics and semiconductor market was valued at US$ 12.32 million in 2022 and is expected to reach US$ 30.08 million by 2030; it is estimated to register a CAGR of 11.8% from 2022 to 2030.
Rise in Supply Chain Disruption Fuels South & Central America Spend Analytics for Electronics and Semiconductor Market.
Supply chain disruptions can result in changes in supplier availability, pricing, and lead time. In June 2023, the CEO of Macronix, prominent semiconductor manufacturer in Taiwan stated that a military conflict involving the country would have severe repercussions on the global economy. The disruption caused to the supply chain of critical semiconductors is expected to be extremely significant, and it might set the global economy back by several decades. By utilizing spend analytics, companies can analyze spending patterns and identify alternative suppliers or cost-saving opportunities. This allows them to adapt to modifying market conditions and optimize their procurement strategies. Spend analytics can help companies assess vulnerabilities in their supply chains and identify areas that require improvement. By analyzing spending data, companies can identify potential bottlenecks, single-source dependencies, or areas prone to disruptions. This allows them to proactively deliver these issues and build a more resilient supply chain. Spend analytics provides insights into supplier performance, financial stability, and risk exposure. By monitoring and analyzing spending data, companies can identify high-risk suppliers and take appropriate measures to mitigate potential disruptions. This includes diversifying the supplier base, establishing backup suppliers, or implementing contingency plans to minimize the impact of future disruptions. Supply chain disruptions can lead to fluctuations in demand and supply. Companies can optimize inventory management strategies by analyzing spending data and demand patterns. This includes identifying slow-moving or excess inventory, adjusting reorder points, and implementing just-in-time inventory practices. These measures help companies reduce carrying costs and improve overall supply chain efficiency. Thus, the rise in supply chain disruptions is anticipated to create opportunities for the spend analytics for electronics and semiconductor market growth during the forecast period.
South & Central America Spend Analytics for Electronics and Semiconductor Market Overview
The consumer electronics industry heavily relies on complex global supply chains. Spend analytics solutions can provide companies in this industry with enhanced visibility into their supply chains, enabling them to track and monitor supplier performance, identify bottlenecks, and mitigate risks. This visibility helps ensure a reliable supply of electronic components and products, optimize inventory management, and improve overall supply chain efficiency. By analyzing spending data, companies can know more about their buying patterns, supplier performance, and product quality, enabling them to make data-driven decisions. This data-driven approach can help identify opportunities for cost savings and improve supplier relationships, in turn, enhancing the overall effectiveness of products.
It is important for companies in the consumer electronics industry to effectively monitor risk, implement mitigation strategies, and establish business continuity plans within their supply chain operations. This is particularly crucial given the perishability of certain products, the short product life cycles, and the need to adapt to unpredictable consumer demand. By leveraging spend analytics, companies can comprehensively understand their supply chain ecosystem, identify vulnerabilities, and take proactive measures to ensure resilience and competitiveness.
South & Central America Spend Analytics for Electronics and Semiconductor Market Revenue and Forecast to 2030 (US$ Million)
Get more information on this report
South & Central America Spend Analytics for Electronics and Semiconductor Strategic Insights
Strategic insights for the South & Central America Spend Analytics for Electronics and Semiconductor provides data-driven analysis of the industry landscape, including current trends, key players, and regional nuances. These insights offer actionable recommendations, enabling readers to differentiate themselves from competitors by identifying untapped segments or developing unique value propositions. Leveraging data analytics, these insights help industry players anticipate the market shifts, whether investors, manufacturers, or other stakeholders. A future-oriented perspective is essential, helping stakeholders anticipate market shifts and position themselves for long-term success in this dynamic region. Ultimately, effective strategic insights empower readers to make informed decisions that drive profitability and achieve their business objectives within the market.
Get more information on this report
South & Central America Spend Analytics for Electronics and Semiconductor Report Scope
Report Attribute
Details
Market size in 2022
US$ 12.32 Million
Market Size by 2030
US$ 30.08 Million
Global CAGR (2022 - 2030)
11.8%
Historical Data
2020-2021
Forecast period
2023-2030
Segments Covered
By Component
Software
Service
By Type
Descriptive Analytics
Predictive Analytics
Prescriptive Analytics
By Application
Financial Management
Risk Management
Governance and Compliance Management
Supplier Sourcing and Performance Management
Demand and Supply Forecasting
Regions and Countries Covered
South and Central America
Brazil
Argentina
Rest of South and Central America
Market leaders and key company profiles
Coupa Software Inc
International Business Machines Corp
Ivalua Inc
NB Ventures Inc
SAP SE
Synertrade Inc
Get more information on this report
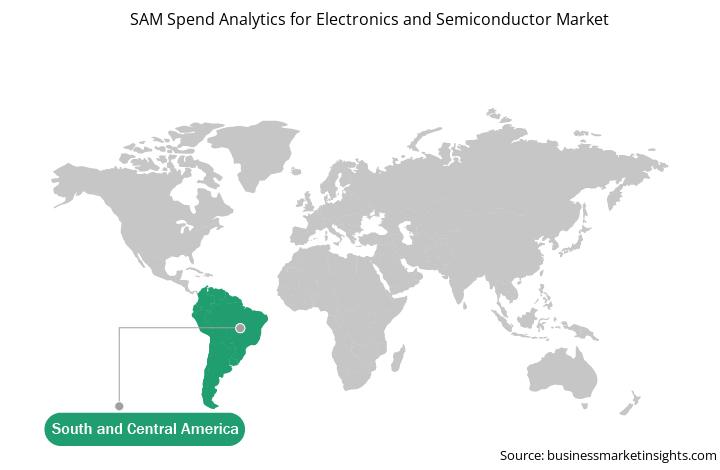
South & Central America Spend Analytics for Electronics and Semiconductor Regional Insights
The geographic scope of the South & Central America Spend Analytics for Electronics and Semiconductor refers to the specific areas in which a business operates and competes. Understanding local distinctions, such as diverse consumer preferences (e.g., demand for specific plug types or battery backup durations), varying economic conditions, and regulatory environments, is crucial for tailoring strategies to specific markets. Businesses can expand their reach by identifying underserved areas or adapting their offerings to meet local demands. A clear market focus allows for more effective resource allocation, targeted marketing campaigns, and better positioning against local competitors, ultimately driving growth in those targeted areas.
Get more information on this report
South & Central America Spend Analytics for Electronics and Semiconductor Market Segmentation
The South & Central America spend analytics for electronics and semiconductor market is segmented based on component, type, deployment, application, and country. Based on component, the South & Central America spend analytics for electronics and semiconductor market is bifurcated into software and services. The software services held a larger market share in 2022.
Based on type, the South & Central America spend analytics for electronics and semiconductor market is segmented into descriptive analytics, predictive analytics, and prescriptive analytics. The predictive analytics held the largest market share in 2022.
Based on deployment, the South & Central America spend analytics for electronics and semiconductor market is bifurcated into on-premise and cloud. The cloud held a larger market share in 2022.
Based on application, the South & Central America spend analytics for electronics and semiconductor market is segmented into financial management, risk management, governance & compliance management, supplier sourcing & performance management, demand & supply forecasting, and others. The supplier sourcing & performance management held the largest market share in 2022.
Based on country, the South & Central America spend analytics for electronics and semiconductor market is segmented into Brazil, Argentina, and the Rest of South & Central America. Brazil dominated the South & Central America spend analytics for electronics and semiconductor market share in 2022.
Coupa Software Inc, International Business Machines Corp, NB Ventures Inc, SAP SE, Ivalua Inc, and Synertrade Inc are some of the leading companies operating in the South & Central America spend analytics for electronics and semiconductor market.
Identical Market Reports with other Region/Countries
The List of Companies - South & Central America Spend Analytics for Electronics and Semiconductor Market
1. Coupa Software Inc 2. International Business Machines Corp 3. Ivalua Inc 4. NB Ventures Inc 5. SAP SE 6. Synertrade Inc
Frequently Asked Questions
How big is the South & Central America Spend Analytics for Electronics and Semiconductor Market?
The South & Central America Spend Analytics for Electronics and Semiconductor Market is valued at US$ 12.32 Million in 2022, it is projected to reach US$ 30.08 Million by 2030.
What is the CAGR for South & Central America Spend Analytics for Electronics and Semiconductor Market by (2022 - 2030)?
As per our report South & Central America Spend Analytics for Electronics and Semiconductor Market, the market size is valued at US$ 12.32 Million in 2022, projecting it to reach US$ 30.08 Million by 2030. This translates to a CAGR of approximately 11.8% during the forecast period.
What segments are covered in this report?
The South & Central America Spend Analytics for Electronics and Semiconductor Market report typically cover these key segments-
Component (Software, Service)
Type (Descriptive Analytics, Predictive Analytics, Prescriptive Analytics)
Application (Financial Management, Risk Management, Governance and Compliance Management, Supplier Sourcing and Performance Management, Demand and Supply Forecasting)
What is the historic period, base year, and forecast period taken for South & Central America Spend Analytics for Electronics and Semiconductor Market?
The historic period, base year, and forecast period can vary slightly depending on the specific market research report. However, for the South & Central America Spend Analytics for Electronics and Semiconductor Market report:
Historic Period : 2020-2021
Base Year : 2022
Forecast Period : 2023-2030
Who are the major players in South & Central America Spend Analytics for Electronics and Semiconductor Market?
The South & Central America Spend Analytics for Electronics and Semiconductor Market is populated by several key players, each contributing to its growth and innovation. Some of the major players include:
Coupa Software Inc
International Business Machines Corp
Ivalua Inc
NB Ventures Inc
SAP SE
Synertrade Inc
Who should buy this report?
The South & Central America Spend Analytics for Electronics and Semiconductor Market report is valuable for diverse stakeholders, including:
Investors: Provides insights for investment decisions pertaining to market growth, companies, or industry insights. Helps assess market attractiveness and potential returns.
Industry Players: Offers competitive intelligence, market sizing, and trend analysis to inform strategic planning, product development, and sales strategies.
Suppliers and Manufacturers: Helps understand market demand for components, materials, and services related to concerned industry.
Researchers and Consultants: Provides data and analysis for academic research, consulting projects, and market studies.
Financial Institutions: Helps assess risks and opportunities associated with financing or investing in the concerned market.
Essentially, anyone involved in or considering involvement in the South & Central America Spend Analytics for Electronics and Semiconductor Market value chain can benefit from the information contained in a comprehensive market report.
Get Free Sample For South & Central America Spend Analytics for Electronics and Semiconductor Market
1. Complete the form
2. Check your inbox (and spam/junk folder)
3. Your Personal Data is Secure with us
GDPR + CCPA Compliant
Personal & transactional information is kept safe from unauthorized use.
WHAT'S INCLUDED IN FULL REPORT : Market Dynamics,
Competitive Analysis and Assessment, Define Business Strategies, Market Outlook and
Trends, Market Size and Share Analysis, Growth Driving Factors, Future Commercial
Potential, Identify Regional Growth Engines


 Get Free Sample For South & Central America Spend Analytics for Electronics and Semiconductor Market
