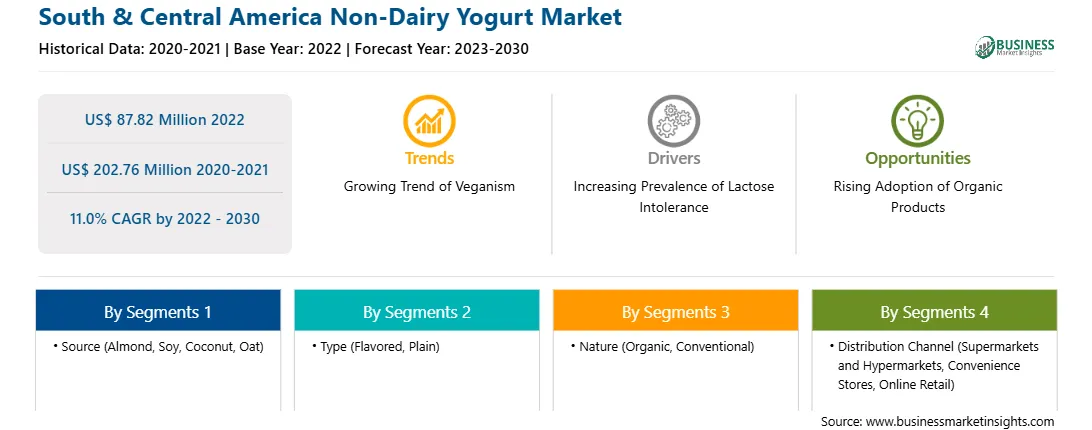
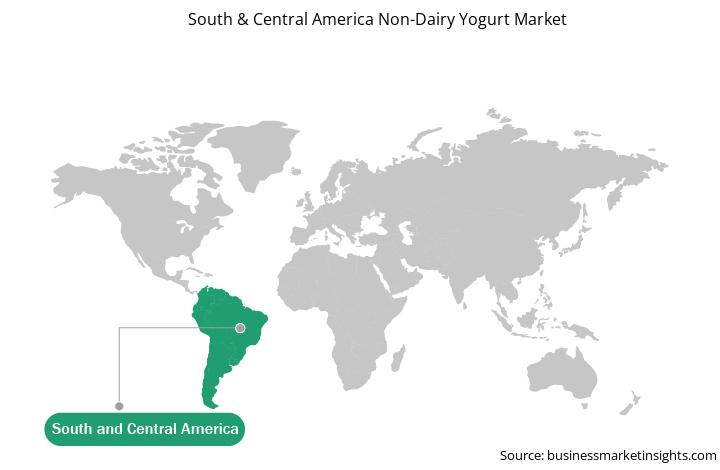
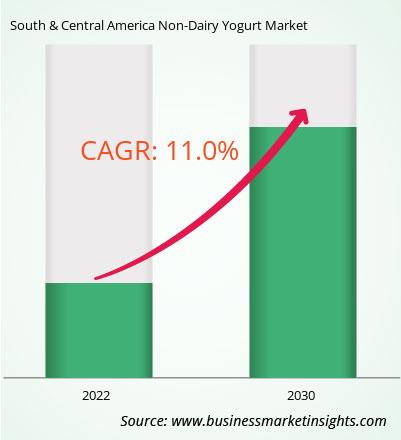
South & Central America Non-Dairy Yogurt Market
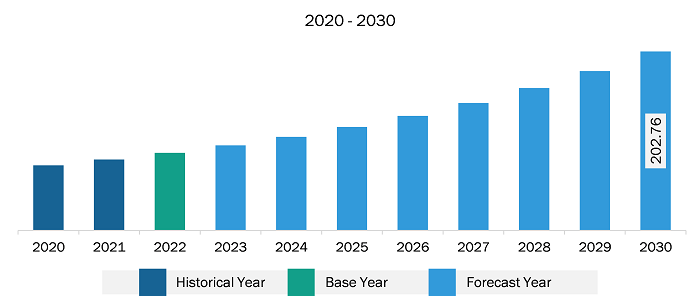
The South & Central America non-dairy yogurt market was valued at US$ 87.82 million in 2022 and is expected to reach US$ 202.76 million by 2030; it is estimated to grow at a CAGR of 11.0% from 2022 to 2030.
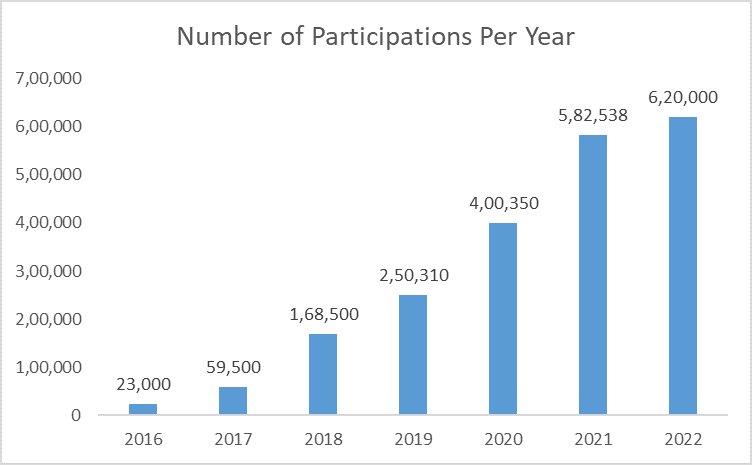
The vegan population has grown significantly over the past few years. According to Veganuary (a nonprofit organization that encourages individuals worldwide to become vegan for the entire month of January), in 2022, more than 620,000 people registered for the Veganuary campaign, and the registrations increased by 200% in the last three years.
The following figure shows the number of participants across the world in the ‘Veganuary Campaign’ from 2016 to 2022:
Strategic insights for the South & Central America Non-Dairy Yogurt provides data-driven analysis of the industry landscape, including current trends, key players, and regional nuances. These insights offer actionable recommendations, enabling readers to differentiate themselves from competitors by identifying untapped segments or developing unique value propositions. Leveraging data analytics, these insights help industry players anticipate the market shifts, whether investors, manufacturers, or other stakeholders. A future-oriented perspective is essential, helping stakeholders anticipate market shifts and position themselves for long-term success in this dynamic region. Ultimately, effective strategic insights empower readers to make informed decisions that drive profitability and achieve their business objectives within the market.
| Report Attribute | Details |
|---|---|
| Market size in 2022 | US$ 87.82 Million |
| Market Size by 2030 | US$ 202.76 Million |
| Global CAGR (2022 - 2030) | 11.0% |
| Historical Data | 2020-2021 |
| Forecast period | 2023-2030 |
| Segments Covered |
By Source
|
| Regions and Countries Covered | South and Central America
|
| Market leaders and key company profiles |
The geographic scope of the South & Central America Non-Dairy Yogurt refers to the specific areas in which a business operates and competes. Understanding local distinctions, such as diverse consumer preferences (e.g., demand for specific plug types or battery backup durations), varying economic conditions, and regulatory environments, is crucial for tailoring strategies to specific markets. Businesses can expand their reach by identifying underserved areas or adapting their offerings to meet local demands. A clear market focus allows for more effective resource allocation, targeted marketing campaigns, and better positioning against local competitors, ultimately driving growth in those targeted areas.
Source: Veganuary 2022 Campaign Review
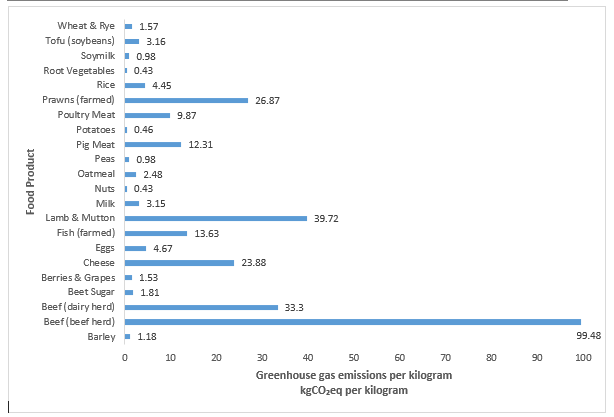
The livestock industry is one of the significant contributors to the total anthropogenic greenhouse gas emissions. According to the Food and Agriculture Organization (FAO), the global livestock industry emits 7.1 gigatons of carbon dioxide per year, accounting for 14.5% of all human-caused greenhouse gas emissions. The dairy sector is responsible for 30% of the total livestock emissions.
The following figure shows annual greenhouse gas emissions per kilogram of food products:
Strategic insights for the South & Central America Non-Dairy Yogurt provides data-driven analysis of the industry landscape, including current trends, key players, and regional nuances. These insights offer actionable recommendations, enabling readers to differentiate themselves from competitors by identifying untapped segments or developing unique value propositions. Leveraging data analytics, these insights help industry players anticipate the market shifts, whether investors, manufacturers, or other stakeholders. A future-oriented perspective is essential, helping stakeholders anticipate market shifts and position themselves for long-term success in this dynamic region. Ultimately, effective strategic insights empower readers to make informed decisions that drive profitability and achieve their business objectives within the market.
| Report Attribute | Details |
|---|---|
| Market size in 2022 | US$ 87.82 Million |
| Market Size by 2030 | US$ 202.76 Million |
| Global CAGR (2022 - 2030) | 11.0% |
| Historical Data | 2020-2021 |
| Forecast period | 2023-2030 |
| Segments Covered |
By Source
|
| Regions and Countries Covered | South and Central America
|
| Market leaders and key company profiles |
The geographic scope of the South & Central America Non-Dairy Yogurt refers to the specific areas in which a business operates and competes. Understanding local distinctions, such as diverse consumer preferences (e.g., demand for specific plug types or battery backup durations), varying economic conditions, and regulatory environments, is crucial for tailoring strategies to specific markets. Businesses can expand their reach by identifying underserved areas or adapting their offerings to meet local demands. A clear market focus allows for more effective resource allocation, targeted marketing campaigns, and better positioning against local competitors, ultimately driving growth in those targeted areas.
Source: Poore & Nemecek, 2018
As can be seen from the figure above, beef (beef herd), beef (dairy herd), and lamb and mutton products have the highest greenhouse gas emission. Many studies have shown that shifting to a vegan diet can significantly lower carbon dioxide emissions. Moreover, the United Nations, PETA, Good Food Institute, and many organizations believe that veganism can help save the planet from the climate crisis. Awareness regarding the harmful effects of the livestock industry on environment is increasing among consumers. The consumption of plant-based dairy products helps minimize carbon footprints, save water and other natural resources, and reduce the overall environmental impacts. Therefore, consumers are rapidly switching to plant-based dairy and meat products. Therefore, people are increasingly switching to a vegan diet due to rising sustainability and environmental concerns.
The non-dairy yogurt market in South & Central America is segmented into Brazil, Argentina, and the Rest of South & Central America. A shift in consumer lifestyle and dietary patterns is a major factor driving the growth of the non-dairy yogurt market in South & Central America, especially in Brazil. The rising population and continuous technological improvements are among the factors boosting the economic growth of Brazil and Argentina. Plant-based dairy products are a good energy source and help lower the risk of cardiovascular diseases. Moreover, the increasing milk allergies, which result in adverse immune reactions after ingesting animal milk among the population, particularly children and infants, is a major factor driving market growth.
Lactose intolerance and primary lactose malabsorption are the most common symptoms of adult-type hypolactasia (lactase deficiency) in Argentina, Brazil, and Ecuador. As a result, consumers are moving toward dairy-free products. Allergies and intolerances are major reasons behind the shift toward dairy-free products, especially considering the Food Allergy Initiative's statistics, which state that cow milk allergy is the leading food allergy in both infants and adults in South America. This factor is majorly driving the demand for non-dairy yogurt.
Strategic insights for the South & Central America Non-Dairy Yogurt provides data-driven analysis of the industry landscape, including current trends, key players, and regional nuances. These insights offer actionable recommendations, enabling readers to differentiate themselves from competitors by identifying untapped segments or developing unique value propositions. Leveraging data analytics, these insights help industry players anticipate the market shifts, whether investors, manufacturers, or other stakeholders. A future-oriented perspective is essential, helping stakeholders anticipate market shifts and position themselves for long-term success in this dynamic region. Ultimately, effective strategic insights empower readers to make informed decisions that drive profitability and achieve their business objectives within the market.
| Report Attribute | Details |
|---|---|
| Market size in 2022 | US$ 87.82 Million |
| Market Size by 2030 | US$ 202.76 Million |
| Global CAGR (2022 - 2030) | 11.0% |
| Historical Data | 2020-2021 |
| Forecast period | 2023-2030 |
| Segments Covered |
By Source
|
| Regions and Countries Covered | South and Central America
|
| Market leaders and key company profiles |
The geographic scope of the South & Central America Non-Dairy Yogurt refers to the specific areas in which a business operates and competes. Understanding local distinctions, such as diverse consumer preferences (e.g., demand for specific plug types or battery backup durations), varying economic conditions, and regulatory environments, is crucial for tailoring strategies to specific markets. Businesses can expand their reach by identifying underserved areas or adapting their offerings to meet local demands. A clear market focus allows for more effective resource allocation, targeted marketing campaigns, and better positioning against local competitors, ultimately driving growth in those targeted areas.
The South & Central America non-dairy yogurt market is segmented based on source, type, nature, and distribution channel.
Based on source, the South & Central America non-dairy yogurt market is segmented into almond, soy, coconut, oat, and others. The coconut segment held the largest share in 2022.
Based on type, the South & Central America non-dairy yogurt market is bifurcated into flavored and plain. The flavored segment held a larger share in 2022.
Based on nature, the South & Central America non-dairy yogurt market is bifurcated into organic and conventional. The conventional segment held a larger share in 2022.
Based on distribution channel, the South & Central America non-dairy yogurt market is segmented into supermarkets & hypermarkets, convenience stores, online retail, and others. The supermarkets & hypermarkets segment held the largest share in 2022.
Based on country, the South & Central America non-dairy yogurt market is categorized into Brazil, Argentina, the Rest of South & Central America. The Rest of South & Central America dominated the South & Central America non-dairy yogurt market in 2022.
Danone SA, Cocojune Products, Forager Project, The Icelandic Milk and Skyr Corporation are some of the leading companies operating in the South & Central America non-dairy yogurt market.
1. Danone SA
2. Cocojune Products
3. Forager Project LLC
4. The Icelandic Milk and Skyr Corporation
The South & Central America Non-Dairy Yogurt Market is valued at US$ 87.82 Million in 2022, it is projected to reach US$ 202.76 Million by 2030.
As per our report South & Central America Non-Dairy Yogurt Market, the market size is valued at US$ 87.82 Million in 2022, projecting it to reach US$ 202.76 Million by 2030. This translates to a CAGR of approximately 11.0% during the forecast period.
The South & Central America Non-Dairy Yogurt Market report typically cover these key segments-
The historic period, base year, and forecast period can vary slightly depending on the specific market research report. However, for the South & Central America Non-Dairy Yogurt Market report:
The South & Central America Non-Dairy Yogurt Market is populated by several key players, each contributing to its growth and innovation. Some of the major players include:
The South & Central America Non-Dairy Yogurt Market report is valuable for diverse stakeholders, including:
Essentially, anyone involved in or considering involvement in the South & Central America Non-Dairy Yogurt Market value chain can benefit from the information contained in a comprehensive market report.
Office No. 1011, First floor, Farena Corporate Park, Magarpatta-Mundhwa road, Pune - 411028, Maharashtra, India
US:+16467917070
sales@businessmarketinsights.com


 Get Free Sample For South & Central America Non-Dairy Yogurt Market
