South & Central America Bioreactors Market
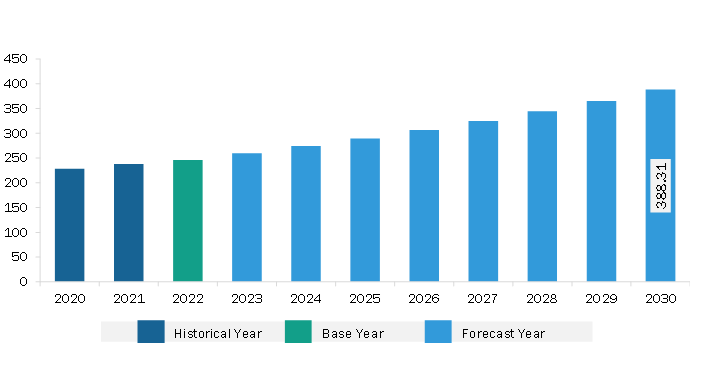
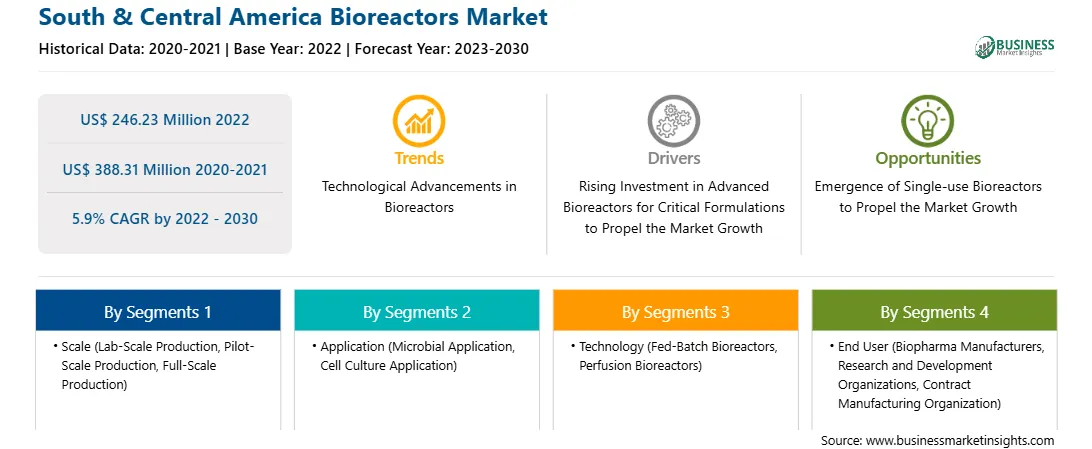
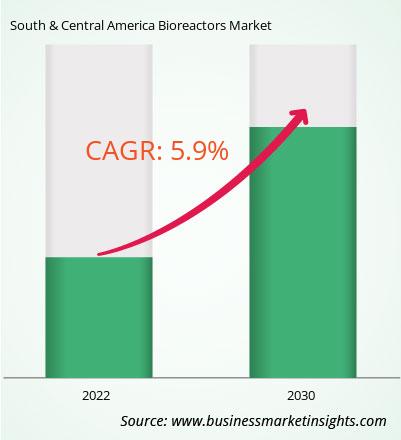
The South & Central America bioreactors market was valued at US$ 246.23 million in 2022 and is expected to reach US$ 388.31 million by 2030; it is estimated to grow at a CAGR of 5.9% from 2022 to 2030.
Rapid Growth of Pharmaceutical and Biotechnology Industry Fuels South & Central America Bioreactors Market
In recent years, the pharmaceutical industry has been growing at an unprecedented pace. Big pharmaceutical companies and contract research organizations (CROs) are coming up with new medicines and therapy forms to treat a wide range of indications. The biopharmaceuticals market is increasing. The strong demand for biologics and biosimilars has driven the growth of the industry. The biopharmaceutical industry is one of the most significant contributors to the economy. With 105 events approved, Brazil is the world's second-largest producer of biotech crops. According to FAS Brasilia, 68 million hectares will be planted with GE traits during the 2022–2023 agricultural season. Besides growing economies, rapid growth is witnessed in the research environment in emerging economies such as Brazil, China, and India. Factors such as increasing biologics approval, growing biosimilar pipeline, and rising investment in research activities are facilitating the growth of the industry.
Biopharmaceutical research activities are gaining pace in emerging economies such as Brazil, China, and India and offering lucrative opportunities to the market. Apart from this, increasing approvals in gene and cell therapies are favoring market growth. The approved gene therapies are Glybera-used to treat Lipoprotein Lipase Deficiency and Strimvelis- treating ADA-Severe Combined Immuno Deficiency. Thus, the factors mentioned above are increasing the demand for the large-scale production of various therapeutics, thereby facilitating the growth of the bioreactors market globally.
Brazil has manufacturing plants for a large number of pharmaceutical companies. In addition, many foreign companies often collaborate and partner with Brazilian laboratories and local companies for the development of biotechnology-based medicines. The collaborative efforts are expected to yield the development of novel products in Brazil during the forecast year.
The majority of research is conducted in universities and other federal state institutions in Brazil. As per the DWIH São Paulo, biotechnology research is one of the first-tier priorities in Brazil. Many studies are being carried out in research centers in Brazil to develop advanced bioreactors for their various applications in the biotechnology sector. For instance, in an article published by MDPI in August 2022, a study was conducted by research departments of universities in Brazil. The study presented a mathematical model that was developed to describe and analyze the bioreactor's dynamic behavior during fermentation, taking into account temperature control via refrigerant fluid flow through the reactor jacket.
Similarly, another study, "Development of a Novel Pilot-Scale Tray Bioreactor for Solid-State Fermentation Aiming at Process Intensification," was carried out by researchers in Brazilian universities in November 2023. These research and development activities are anticipated to boost the bioreactor market in Brazil.
Strategic insights for the South & Central America Bioreactors provides data-driven analysis of the industry landscape, including current trends, key players, and regional nuances. These insights offer actionable recommendations, enabling readers to differentiate themselves from competitors by identifying untapped segments or developing unique value propositions. Leveraging data analytics, these insights help industry players anticipate the market shifts, whether investors, manufacturers, or other stakeholders. A future-oriented perspective is essential, helping stakeholders anticipate market shifts and position themselves for long-term success in this dynamic region. Ultimately, effective strategic insights empower readers to make informed decisions that drive profitability and achieve their business objectives within the market.
| Report Attribute | Details |
|---|---|
| Market size in 2022 | US$ 246.23 Million |
| Market Size by 2030 | US$ 388.31 Million |
| Global CAGR (2022 - 2030) | 5.9% |
| Historical Data | 2020-2021 |
| Forecast period | 2023-2030 |
| Segments Covered |
By Scale
|
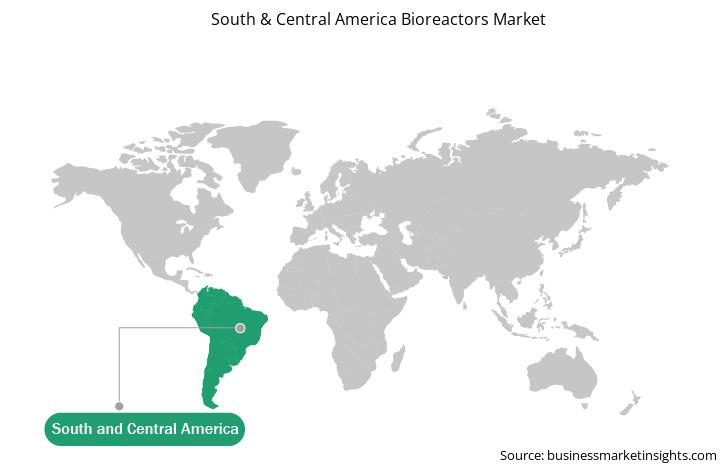
| Regions and Countries Covered | South and Central America
|
| Market leaders and key company profiles |
The geographic scope of the South & Central America Bioreactors refers to the specific areas in which a business operates and competes. Understanding local distinctions, such as diverse consumer preferences (e.g., demand for specific plug types or battery backup durations), varying economic conditions, and regulatory environments, is crucial for tailoring strategies to specific markets. Businesses can expand their reach by identifying underserved areas or adapting their offerings to meet local demands. A clear market focus allows for more effective resource allocation, targeted marketing campaigns, and better positioning against local competitors, ultimately driving growth in those targeted areas.
The South & Central America bioreactors market is segmented based on scale, application, technology, end user, and country. Based on scale, the South & Central America bioreactors market is segmented into lab-scale production, pilot-scale production, and full-scale production. The pilot-scale production segment held the largest market share in 2022.
In terms of application, the South & Central America bioreactors market is segmented into microbial application, cell culture application, and others. The cell culture application segment held the largest market share in 2022.
By technology, the South & Central America bioreactors market is bifurcated into fed-batch bioreactors and perfusion bioreactors. The fed-batch bioreactors segment held a larger market share in 2022.
Based on end user, the South & Central America bioreactors market is categorized into biopharma manufacturers, research and development organizations, and contract manufacturing organization. The research and development organizations segment held the largest market share in 2022.
Based on country, the South & Central America bioreactors market is segmented into Brazil, Argentina, and the Rest of South & Central America. Brazil dominated the South & Central America bioreactors market share in 2022.
General Electric Co, Merck KGaA, Pall Corp, PBS Biotech Inc, Sartorius AG, Solaris Biotechnology SRL, and Thermo Fisher Scientific Inc are some of the leading players operating in the South & Central America bioreactors market.
1. General Electric Co
2. Merck KGaA
3. Pall Corp
4. PBS Biotech Inc
5. Sartorius AG
6. Solaris Biotechnology SRL
7. Thermo Fisher Scientific Inc
The South & Central America Bioreactors Market is valued at US$ 246.23 Million in 2022, it is projected to reach US$ 388.31 Million by 2030.
As per our report South & Central America Bioreactors Market, the market size is valued at US$ 246.23 Million in 2022, projecting it to reach US$ 388.31 Million by 2030. This translates to a CAGR of approximately 5.9% during the forecast period.
The South & Central America Bioreactors Market report typically cover these key segments-
The historic period, base year, and forecast period can vary slightly depending on the specific market research report. However, for the South & Central America Bioreactors Market report:
The South & Central America Bioreactors Market is populated by several key players, each contributing to its growth and innovation. Some of the major players include:
The South & Central America Bioreactors Market report is valuable for diverse stakeholders, including:
Essentially, anyone involved in or considering involvement in the South & Central America Bioreactors Market value chain can benefit from the information contained in a comprehensive market report.
Office No. 1011, First floor, Farena Corporate Park, Magarpatta-Mundhwa road, Pune - 411028, Maharashtra, India
US:+16467917070
sales@businessmarketinsights.com


 Get Free Sample For South & Central America Bioreactors Market
