South America Aquaculture Market Forecast to 2028 - COVID-19 Impact and Regional Analysis By Product Type (Aquatic Plants, Fish, Crustaceans, Mollusca, and Others) and Culture Environment (Fresh Water, Brackish Water, and Marine Water)

TIPRE00028623 | Pages: 87 | Food and Beverages | Apr 2022 | Type: Regional | Status: Published

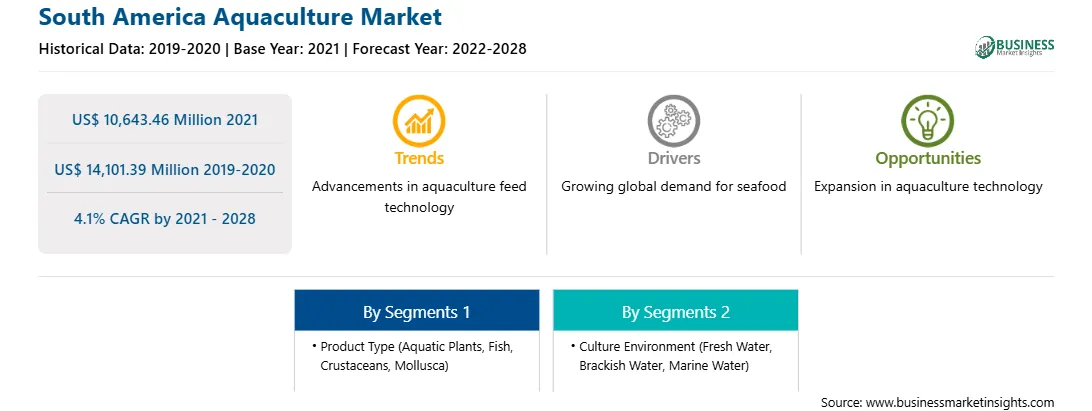
The aquaculture market in SAM is expected to grow from US$ 10,643.46 million in 2021 to US$ 14,101.39 million by 2028; it is estimated to grow at a CAGR of 4.1% from 2021 to 2028.

Seafood, specifically fish, is part of traditional food in many regions. Also, fish is largely consumed owing to its nutritional benefits and several health benefits. It is considered a good source of fatty acids, vitamins, minerals, protein, and essential micronutrients. An increase in disposable income and spending power of consumers encourage them to spend on animal proteins such as seafood. Currently, high growth in population and increased popularity of seafood as a healthy source of protein have fueled the growth of the aquaculture market. Wild fisheries are not sufficient to meet the total seafood demand generated in SAM, and the issue can be addressed by acquiring aquaculture practices. Aquaculture is the practice of farming aquatic animals such as fish, crustaceans, and mollusks in a controlled environment in man-made tanks and ponds, or water bodies in coastal areas. The yield of aquaculture accounts for more than half of the seafood consumption across the region. Overfishing in the oceans has created a need for the development of alternative methods for the production of seafood. Aquaculture is a sustainable solution that has emerged as an environmentally friendly alternative to wild fishing. It is the controlled process of farming aquatic organisms in inland and coastal areas. Aquaculture is carried out by multinational companies as well as small-scale fisheries. Also, the Food and Agriculture Organization (FAO) has predicted that fish consumption by humans is expected to increase by 50% in the next 15 years. 

Brazil has reported the highest number of COVID-19 confirmed cases in SAM, followed by Argentina, Peru, Chile, and Ecuador. Governments have taken several actions to protect their citizens and contain the spread of SARS-CoV-2. Containment measures in several SAM countries reduced economic activity in the manufacturing sector in 2020. However, as the economies are recovering from losses, the aquaculture market is also projected to witness resurgence in the next few years. Moreover, with the growing demand for seafood from both the food retail and foodservice sector in the region, the aquaculture market is projected to grow at a notable pace during the forecast period.

With the new features and technologies, vendors can attract new customers and expand their footprints in emerging markets. This factor is likely to drive the SAM aquaculture market at a good CAGR during the forecast period.


SAM Aquaculture
Market Revenue and Forecast to 2028 (US$ Million)

SAM Aquaculture Market Revenue and Forecast to 2028 (US$ Million)

Get more information on this report :


SAM Aquaculture Market Segmentation

Market, by Product

  • Aquatic Plants
  • Fish
  • Crustaceans
  • Mollusca
  • Others

Market, by Culture Environment

  • Fresh Water
  • Brackish Water
  • Marine Water

Market, by Country

  • Brazil
  • Argentina
  • Rest of SAM

Companies Mentioned

  • Cermaq Group AS
  • JBS S.A.
  • Mowi ASA
  • Thai Union Group PCL


1.           Introduction

1.1         Scope of the Study

1.2         The Insight Partners Research Report Guidance

1.3         Market Segmentation

2.           Key Takeaways

3.        Research Methodology

3.1         Coverage

3.2         Secondary Research

3.3         Primary Research

4.           SAM Aquaculture Market Landscape

4.1         Market Overview

4.2.1        Bargaining Power of Suppliers

4.2.2        Bargaining Power of Buyers

4.2.3        Threat of New Entrants

4.2.4        Competitive Rivalry

4.2.5        Threat of Substitutes

4.3         Expert Opinions

5.           SAM Aquaculture Market – Key Industry Dynamics

5.1         Key Market Drivers

5.1.1        Consumption of Seafood Increasing Significantly

5.1.2        Various Government Steps Boosting the Adoption of Aquaculture in SAM

5.2         Restraints

5.2.1        Harmful Impact on the Environment

5.3         Opportunity

5.3.1        Rising Popularity of RAS Technology

5.4         Future trends

5.4.1        Application of Fish Oil in Several Industries is Expected to Boost the Demand for Aquaculture

5.5         Impact Analysis of Drivers and Restraints

6.           Aquaculture Market – SAM Analysis

6.1         SAM Aquaculture Market Overview

6.2         SAM Aquaculture Market Forecast and Analysis

7.           SAM Aquaculture Market Analysis – by Product Type

7.1         Overview

7.2         SAM Aquaculture Market Breakdown, By Product Type, 2020 & 2028

7.3         Aquatic Plants

7.3.1        Overview

7.3.2        SAM Aquatic Plants Market Revenue Forecasts To 2028 (US$ Million)

7.4         Fish

7.4.1        Overview

7.4.2        SAM Fish Market Revenue Forecasts To 2028 (US$ Million)

7.5         Crustaceans

7.5.1        Overview

7.5.2        SAM Crustaceans Market Revenue Forecasts To 2028 (US$ Million)

7.6         Mollusca

7.6.1        Overview

7.6.2        SAM Mollusca Market Revenue Forecasts To 2028 (US$ Million)

7.7         Others

7.7.1        Overview

7.7.2        SAM Others Market Revenue Forecasts To 2028 (US$ Million)

8.           SAM Aquaculture Market Analysis – By Culture Environment

8.1         Overview

8.2         SAM Aquaculture Market Breakdown, By Culture Environment, 2020 & 2028

8.3         Fresh Water

8.3.1        Overview

8.3.2        SAM Fresh Water Aquaculture Market Revenue Forecasts To 2028 (US$ Million)

8.4         Brackish Water

8.4.1        Overview

8.4.2        SAM Brackish Water Aquaculture Market Revenue Forecasts To 2028 (US$ Million)

8.5         Marine Water

8.5.1        Overview

8.5.2        SAM Marine Water Aquaculture Market Revenue Forecasts To 2028 (US$ Million)

9.           SAM Aquaculture Market – Country Analysis

9.1         Overview

9.1.1        SAM Aquaculture Market Breakdown, by Key Countries

9.1.1.1          Brazil Aquaculture Market Revenue Forecasts to 2028 (US$ Million)

9.1.1.1.1          Brazil Aquaculture Market Breakdown by Product Type

9.1.1.1.2          Brazil Aquaculture Market Breakdown by Culture Environment

9.1.1.2          Argentina Aquaculture Market Revenue Forecasts to 2028 (US$ Million)

9.1.1.2.1          Argentina Aquaculture Market Breakdown by Product Type

9.1.1.2.2          Argentina Aquaculture Market Breakdown by Culture Environment

9.1.1.3          Rest of SAM Aquaculture Market Revenue Forecasts to 2028 (US$ Million)

9.1.1.3.1          Rest of SAM Aquaculture Market Breakdown by Product Type

9.1.1.3.2          Rest of SAM Aquaculture Market Breakdown by Culture Environment

10.        Impact of COVID-19 Pandemic on Global Aquaculture Market

10.1      SAM: Impact Assessment of COVID-19 Pandemic

11.        Company Profiles

11.1      JBS S.A.

11.1.1     Key Facts

11.1.2     Business Description

11.1.3     Products and Services

11.1.4     Financial Overview

11.1.5     SWOT Analysis

11.1.6     Key Developments

11.2      Cermaq Group AS

11.2.1     Key Facts

11.2.2     Business Description

11.2.3     Products and Services

11.2.4     Financial Overview

11.2.5     SWOT Analysis

11.2.6     Key Developments

11.3      Mowi ASA

11.3.1     Key Facts

11.3.2     Business Description

11.3.3     Products and Services

11.3.4     Financial Overview

11.3.5     SWOT Analysis

11.3.6     Key Developments

11.4      Thai Union Group PCL.

11.4.1     Key Facts

11.4.2     Business Description

11.4.3     Products and Services

11.4.4     Financial Overview

11.4.5     SWOT Analysis

11.4.6     Key Developments

12.        Appendix

12.1      About The Insight Partners

12.2      Glossary


LIST OF TABLES

Table 1.             SAM Aquaculture Market Revenue Forecasts to 2028 (US$ Million)

Table 2.             Brazil Aquaculture Market Revenue and Forecasts to 2028 – By Product Type (US$ Million)

Table 3.             Brazil Aquaculture Market Revenue and Forecasts to 2028 – By Culture Environment (US$ Million)

Table 4.             Argentina Aquaculture Market Revenue and Forecasts to 2028 – By Product Type (US$ Million)

Table 5.             Argentina Aquaculture Market Revenue and Forecasts to 2028 – By Culture Environment (US$ Million)

Table 6.             Rest of SAM Aquaculture Market Revenue and Forecasts to 2028 – By Product Type (US$ Million)

Table 7.             Rest of SAM Aquaculture Market Revenue and Forecasts to 2029 – By Culture Environment (US$ Million)

Table 8.             Glossary of terms, SAM Aquaculture Market


LIST OF FIGURES

Figure 1.           SAM Aquaculture Market Segmentation

Figure 2.           SAM Aquaculture Market Segmentation – By Country

Figure 3.           SAM Aquaculture Market Overview

Figure 4.           Marine Water Segment Held Largest Share in the SAM Aquaculture Market

Figure 5.           Rest of SAM Held the Largest Share in the SAM Aquaculture Market

Figure 6.           Porter's Five Forces Analysis

Figure 7.           Expert Opinion

Figure 8.           SAM Aquaculture Market Impact Analysis of Driver and Restraints

Figure 9.           SAM Aquaculture Market Forecast and Analysis, (US$ Million)

Figure 10.        SAM Aquaculture Market Breakdown by Product Type, 2020 & 2028 (%)

Figure 11.        SAM Aquatic Plants Market Revenue Forecasts To 2028 (US$ Million)

Figure 12.        SAM Fish Market Revenue Forecasts To 2028 (US$ Million)

Figure 13.        SAM Crustaceans Market Revenue Forecasts To 2028 (US$ Million)

Figure 14.        SAM Mollusca Market Revenue Forecasts To 2028 (US$ Million)

Figure 15.        SAM Others Market Revenue Forecasts To 2028 (US$ Million)

Figure 16.        SAM Aquaculture Market Breakdown by Culture Environment, 2020 & 2028 (%)

Figure 17.        SAM Fresh Water Aquaculture Market Revenue Forecasts To 2028 (US$ Million)

Figure 18.        SAM Brackish Water Aquaculture Market Revenue Forecasts To 2028 (US$ Million)

Figure 19.        SAM Marine Water Aquaculture Market Revenue Forecasts To 2028 (US$ Million)

Figure 20.        SAM Aquaculture Market, by Key Country - Revenue (2020) (US$ Million)

Figure 21.        SAM Aquaculture Market Breakdown by Key Countries, 2020 & 2028 (%)

Figure 22.        Brazil Aquaculture Market Forecasts to 2028 (US$ Million)

Figure 23.        Argentina Aquaculture Market Forecasts to 2028 (US$ Million)

Figure 24.        Rest of SAM Aquaculture Market Forecasts to 2028 (US$ Million)

Figure 25.        Impact of COVID-19 Pandemic in SAM Country Markets


  1. Cermaq Group AS
  2. JBS S.A.
  3. Mowi ASA
  4. Thai Union Group PCL
  • Save and reduce time carrying out entry-level research by identifying the growth, size, leading players and segments in the SAM aquaculture market
  • Highlights key business priorities in order to assist companies to realign their business strategies
  • The key findings and recommendations highlight crucial progressive industry trends in the SAM aquaculture market, thereby allowing players across the value chain to develop effective long-term strategies
  • Develop/modify business expansion plans by using substantial growth offering developed and emerging markets
  • Scrutinize in-depth SAM market trends and outlook coupled with the factors driving the aquaculture market, as well as those hindering it
  • Enhance the decision-making process by understanding the strategies that underpin commercial interest with respect to client products, segmentation, pricing and distribution
Report Code
Full Name
Country Name
Email Id
Phone Number
Job Title
Company
Requirement

Note : Your data will never be shared with third parties, however, we may send you information from time to time about our products that may be of interest to you. By submitting your details, you agree to be contacted by us. You may contact us at any time to opt-out.


Purchase Options
Single User License
$3000
$1500
Site License
$4000
$2000
Enterprise License
$5000
$2500