North America Spend Analytics for Electronics and Semiconductor Market Forecast to 2030 - Regional analysis - by Component (Software and Service), Type (Descriptive Analytics, Predictive Analytics, and Prescriptive Analytics), Deployment (On-Premise and Cloud), and Application (Financial Management, Risk Management, Governance and Compliance Management, Supplier Sourcing and Performance Management, Demand and Supply Forecasting, and Others)

BMIRE00030524 | Pages: 87 | Electronics and Semiconductor | Jul 2024 | Type: Regional | Status: Published

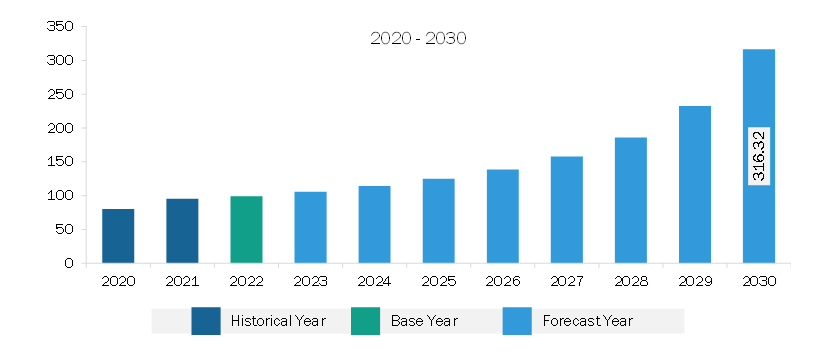
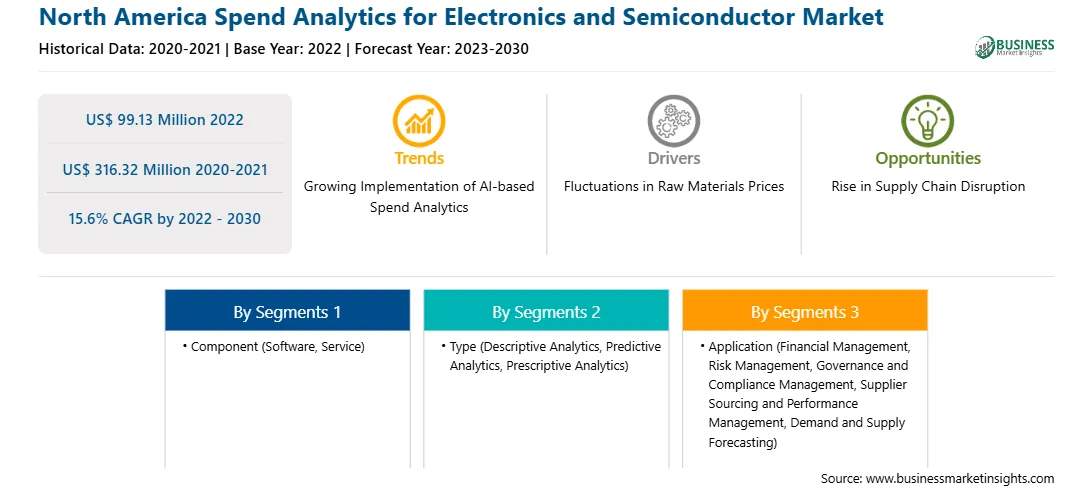
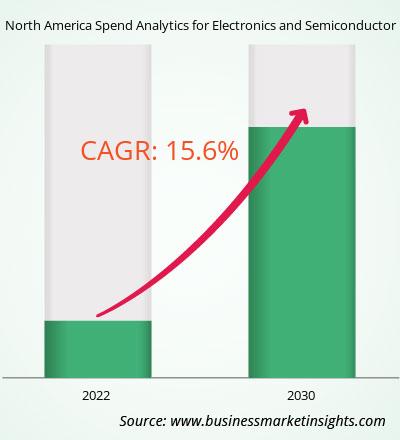
The North America spend analytics for electronics and semiconductor market was valued at US$ 99.13 million in 2022 and is expected to reach US$ 316.32 million by 2030; it is estimated to register a CAGR of 15.6% from 2022 to 2030.

Rise in Demand for Consumer Electronics Fuels North America Spend Analytics for Electronics and Semiconductor Market

The electronics and semiconductor market experienced a significant surge in demand for smartphones, tablets, wearable devices, and other consumer electronics. This increase in demand highlighted the necessity for spending analytics within the industry. As the consumer electronics market expanded, companies in this sector faced the challenge of efficiently managing their expenditures to maintain competitiveness and meet their customers' changing preferences. The adoption of spend analytics solutions became crucial as it provided valuable insights into spending patterns, identified opportunities for cost optimization, and facilitated informed decision-making to ensure companies remained adaptable and responsive in this fast-paced market. Also, spend analytics help companies streamline their procurement processes, identify potential areas for cost reduction, and strategically allocate resources to meet the growing demand for consumer electronics, which boosts the spend analytics for electronics and semiconductor market growth.

North America Spend Analytics for Electronics and Semiconductor Market Overview

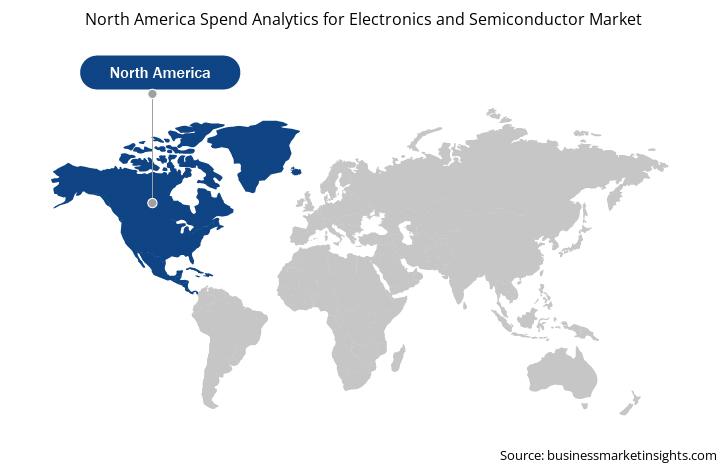
The spend analytics for electronics and semiconductor market in North America is a well-established and mature one, exhibiting a high level of adoption and strong focus on leveraging analytics to optimize procurement processes as well as drive cost savings. Particularly, the US has significant presence in the global and North American spend analytics for electronics and semiconductor market. IBM Corporation, Lytica Inc, SAP, and Zycus are among the established players operating in the US that offer sophisticated analytics solutions tailored to the needs of their client organizations. These players have a deep understanding of the market dynamics and provide comprehensive analytics tools that allow businesses to gain valuable perceptions of their spending patterns and make informed decisions, further contributing to the growth of spend analytics for electronics and semiconductor market. In June 2023, Kearney, a global management consulting firm, led the investment round for Simfoni, raising the investment amount of ~US$ 8 million. Simfoni (based in San Francisco) provides solutions for spend analytics, e-sourcing, and tail spend management. This investment round, known as Series A-2, signifies Kearney's confidence and support in Simfoni's offerings and potential for growth in the spend analytics for electronics and semiconductor market.

North America Spend Analytics for Electronics and Semiconductor Market Revenue and Forecast to 2030 (US$ Million)

Get more information on this report :

North America Spend Analytics for Electronics and Semiconductor Market Segmentation 

The North America spend analytics for electronics and semiconductor market is segmented based on component, type, deployment, application, and country. Based on component, the North America spend analytics for electronics and semiconductor market is bifurcated into software and services. The software services held a larger market share in 2022.

Based on type, the North America spend analytics for electronics and semiconductor market is segmented into descriptive analytics, predictive analytics, and prescriptive analytics. The predictive analytics held the largest market share in 2022.

In terms of deployment, the North America spend analytics for electronics and semiconductor market is bifurcated into on-premise and cloud. The cloud held a larger market share in 2022.

By application, the North America spend analytics for electronics and semiconductor market is segmented into financial management, risk management, governance & compliance management, supplier sourcing & performance management, demand & supply forecasting, and others. The supplier sourcing & performance management held the largest market share in 2022.

Based on country, the North America spend analytics for electronics and semiconductor market is segmented into the US, Canada, and Mexico. The US dominated the North America spend analytics for electronics and semiconductor market share in 2022.

Coupa Software Inc, International Business Machines Corp, Ivalua Inc, Lytica Inc, NB Ventures Inc, SAP SE, Scanmarket AS, Synertrade Inc, and Zycus Inc are some of the leading companies operating in the North America spend analytics for electronics and semiconductor market.

TABLE OF CONTENTS


1. Introduction

1.1 The Insight Partners Research Report Guidance

1.2 Market Segmentation

2. Executive Summary

2.1 Key Insights

2.2 Market Attractiveness

3. Research Methodology

3.1 Coverage

3.2 Secondary Research

3.3 Primary Research

4. Spend Analytics for Electronics and Semiconductor Market Landscape

4.1 Overview

4.2 Ecosystem Analysis

5. North America Spend Analytics for Electronics and Semiconductor Market - Key Market Dynamics

5.1 Market Drivers

5.1.1 Rise in Demand for Consumer Electronics

5.1.2 Fluctuations in Raw Materials Prices

5.2 Market Restraints

5.2.1 Technological Complexity

5.3 Market Opportunities

5.3.1 Rise in Supply Chain Disruption

5.3.2 Incorporation of Miniaturized Electronic Devices

5.4 Future Trends

5.4.1 Growing Implementation of AI-based Spend Analytics

5.5 Impact of Drivers and Restraints:

6. North America Spend Analytics for Electronics and Semiconductor Market -Market Analysis

6.1 Spend Analytics for Electronics and Semiconductor Market Revenue (US$ Million), 2022-2030

6.2 Spend Analytics for Electronics and Semiconductor Market Forecast Analysis

7. North America Spend Analytics for Electronics and Semiconductor Market Analysis - by Component

7.1 Software

7.1.1 Overview

7.1.2 Software: Spend Analytics for Electronics and Semiconductor Market - Revenue and Forecast to 2030 (US$ Million)

7.2 Service

7.2.1 Overview

7.2.2 Service: Spend Analytics for Electronics and Semiconductor Market - Revenue and Forecast to 2030 (US$ Million)

8. North America Spend Analytics for Electronics and Semiconductor Market Analysis - by Type

8.1 Descriptive Analytics

8.1.1 Overview

8.1.2 Descriptive Analytics: Spend Analytics for Electronics and Semiconductor Market - Revenue and Forecast to 2030 (US$ Million)

8.2 Predictive Analytics

8.2.1 Overview

8.2.2 Predictive Analytics: Spend Analytics for Electronics and Semiconductor Market - Revenue and Forecast to 2030 (US$ Million)

8.3 Prescriptive Analytics

8.3.1 Overview

8.3.2 Prescriptive Analytics: Spend Analytics for Electronics and Semiconductor Market - Revenue and Forecast to 2030 (US$ Million)

9. North America Spend Analytics for Electronics and Semiconductor Market Analysis - by Deployment

9.1 On-Premise

9.1.1 Overview

9.1.2 On-Premise: Spend Analytics for Electronics and Semiconductor Market - Revenue and Forecast to 2030 (US$ Million)

9.2 Cloud

9.2.1 Overview

9.2.2 Cloud: Spend Analytics for Electronics and Semiconductor Market - Revenue and Forecast to 2030 (US$ Million)

10. North America Spend Analytics for Electronics and Semiconductor Market Analysis - by Application

10.1 Financial Management

10.1.1 Overview

10.1.2 Financial Management: Spend Analytics for Electronics and Semiconductor Market - Revenue and Forecast to 2030 (US$ Million)

10.2 Risk Management

10.2.1 Overview

10.2.2 Risk Management: Spend Analytics for Electronics and Semiconductor Market - Revenue and Forecast to 2030 (US$ Million)

10.3 Governance and Compliance Management

10.3.1 Overview

10.3.2 Governance and Compliance Management: Spend Analytics for Electronics and Semiconductor Market - Revenue and Forecast to 2030 (US$ Million)

10.4 Supplier Sourcing and Performance Management

10.4.1 Overview

10.4.2 Supplier Sourcing and Performance Management: Spend Analytics for Electronics and Semiconductor Market - Revenue and Forecast to 2030 (US$ Million)

10.5 Demand and Supply Forecasting

10.5.1 Overview

10.5.2 Demand and Supply Forecasting: Spend Analytics for Electronics and Semiconductor Market - Revenue and Forecast to 2030 (US$ Million)

10.6 Others

10.6.1 Overview

10.6.2 Others: Spend Analytics for Electronics and Semiconductor Market - Revenue and Forecast to 2030 (US$ Million)

11. North America Spend Analytics for Electronics and Semiconductor Market - Country Analysis

11.1 North America Market Overview

11.1.1 North America: Spend Analytics for Electronics and Semiconductor Market - Revenue and Forecast Analysis - by Country

11.1.1.1 North America: Spend Analytics for Electronics and Semiconductor Market - Revenue and Forecast Analysis - by Country

11.1.1.2 United States: Spend Analytics for Electronics and Semiconductor Market - Revenue and Forecast to 2030 (US$ Million)

11.1.1.2.1 United States: Spend Analytics for Electronics and Semiconductor Market Breakdown, by Component

11.1.1.2.2 United States: Spend Analytics for Electronics and Semiconductor Market Breakdown, by Type

11.1.1.2.3 United States: Spend Analytics for Electronics and Semiconductor Market Breakdown, by Deployment

11.1.1.2.4 United States: Spend Analytics for Electronics and Semiconductor Market Breakdown, by Application

11.1.1.3 Canada: Spend Analytics for Electronics and Semiconductor Market - Revenue and Forecast to 2030 (US$ Million)

11.1.1.3.1 Canada: Spend Analytics for Electronics and Semiconductor Market Breakdown, by Component

11.1.1.3.2 Canada: Spend Analytics for Electronics and Semiconductor Market Breakdown, by Type

11.1.1.3.3 Canada: Spend Analytics for Electronics and Semiconductor Market Breakdown, by Deployment

11.1.1.3.4 Canada: Spend Analytics for Electronics and Semiconductor Market Breakdown, by Application

11.1.1.4 Mexico: Spend Analytics for Electronics and Semiconductor Market - Revenue and Forecast to 2030 (US$ Million)

11.1.1.4.1 Mexico: Spend Analytics for Electronics and Semiconductor Market Breakdown, by Component

11.1.1.4.2 Mexico: Spend Analytics for Electronics and Semiconductor Market Breakdown, by Type

11.1.1.4.3 Mexico: Spend Analytics for Electronics and Semiconductor Market Breakdown, by Deployment

11.1.1.4.4 Mexico: Spend Analytics for Electronics and Semiconductor Market Breakdown, by Application

12. Competitive Landscape

12.1 Heat Map Analysis By Key Players

13. Industry Landscape

13.1 Overview

13.2 Market Initiative

13.3 Product Development

13.4 Merger and Acquisition

14. Company Profiles

14.1 Coupa Software Inc

14.1.1 Key Facts

14.1.2 Business Description

14.1.3 Products and Services

14.1.4 Financial Overview

14.1.5 SWOT Analysis

14.1.6 Key Developments

14.2 International Business Machines Corp

14.2.1 Key Facts

14.2.2 Business Description

14.2.3 Products and Services

14.2.4 Financial Overview

14.2.5 SWOT Analysis

14.2.6 Key Developments

14.3 Ivalua Inc

14.3.1 Key Facts

14.3.2 Business Description

14.3.3 Products and Services

14.3.4 Financial Overview

14.3.5 SWOT Analysis

14.3.6 Key Developments

14.4 Lytica Inc

14.4.1 Key Facts

14.4.2 Business Description

14.4.3 Products and Services

14.4.4 Financial Overview

14.4.5 SWOT Analysis

14.4.6 Key Developments

14.5 NB Ventures Inc

14.5.1 Key Facts

14.5.2 Business Description

14.5.3 Products and Services

14.5.4 Financial Overview

14.5.5 SWOT Analysis

14.5.6 Key Developments

14.6 SAP SE

14.6.1 Key Facts

14.6.2 Business Description

14.6.3 Products and Services

14.6.4 Financial Overview

14.6.5 SWOT Analysis

14.6.6 Key Developments

14.7 Scanmarket AS

14.7.1 Key Facts

14.7.2 Business Description

14.7.3 Products and Services

14.7.4 Financial Overview

14.7.5 SWOT Analysis

14.7.6 Key Developments

14.8 Synertrade Inc

14.8.1 Key Facts

14.8.2 Business Description

14.8.3 Products and Services

14.8.4 Financial Overview

14.8.5 SWOT Analysis

14.8.6 Key Developments

14.9 Zycus Inc

14.9.1 Key Facts

14.9.2 Business Description

14.9.3 Products and Services

14.9.4 Financial Overview

14.9.5 SWOT Analysis

14.9.6 Key Developments

15. Appendix

15.1 Word Index

List of Tables

Table 1. Spend Analytics for Electronics and Semiconductor Market Segmentation

Table 2. Spend Analytics for Electronics and Semiconductor Market - Revenue and Forecast to 2030 (US$ Million)

Table 3. Spend Analytics for Electronics and Semiconductor Market - Revenue and Forecast to 2030 (US$ Million) - by Component

Table 4. Spend Analytics for Electronics and Semiconductor Market - Revenue and Forecast to 2030 (US$ Million) - by Type

Table 5. Spend Analytics for Electronics and Semiconductor Market - Revenue and Forecast to 2030 (US$ Million) - by Deployment

Table 6. Spend Analytics for Electronics and Semiconductor Market - Revenue and Forecast to 2030 (US$ Million) - by Application

Table 7. North America: Spend Analytics for Electronics and Semiconductor Market - Revenue and Forecast to 2030 (US$ Million) - by Country

Table 8. United States: Spend Analytics for Electronics and Semiconductor Market - Revenue and Forecast to 2030 (US$ Million) - by Component

Table 9. United States: Spend Analytics for Electronics and Semiconductor Market - Revenue and Forecast to 2030 (US$ Million) - by Type

Table 10. United States: Spend Analytics for Electronics and Semiconductor Market - Revenue and Forecast to 2030 (US$ Million) - by Deployment

Table 11. United States: Spend Analytics for Electronics and Semiconductor Market - Revenue and Forecast to 2030 (US$ Million) - by Application

Table 12. Canada: Spend Analytics for Electronics and Semiconductor Market - Revenue and Forecast to 2030 (US$ Million) - by Component

Table 13. Canada: Spend Analytics for Electronics and Semiconductor Market - Revenue and Forecast to 2030 (US$ Million) - by Type

Table 14. Canada: Spend Analytics for Electronics and Semiconductor Market - Revenue and Forecast to 2030 (US$ Million) - by Deployment

Table 15. Canada: Spend Analytics for Electronics and Semiconductor Market - Revenue and Forecast to 2030 (US$ Million) - by Application

Table 16. Mexico: Spend Analytics for Electronics and Semiconductor Market - Revenue and Forecast to 2030 (US$ Million) - by Component

Table 17. Mexico: Spend Analytics for Electronics and Semiconductor Market - Revenue and Forecast to 2030 (US$ Million) - by Type

Table 18. Mexico: Spend Analytics for Electronics and Semiconductor Market - Revenue and Forecast to 2030 (US$ Million) - by Deployment

Table 19. Mexico: Spend Analytics for Electronics and Semiconductor Market - Revenue and Forecast to 2030 (US$ Million) - by Application

Table 20. Heat Map Analysis By Key Players

Table 21. List of Abbreviation

List of Figures

Figure 1. Spend Analytics for Electronics and Semiconductor Market Segmentation, by Country

Figure 2. Ecosystem: Spend Analytics for Electronics and Semiconductor Market

Figure 3. Spend Analytics for Electronics and Semiconductor Market - Key Market Dynamics

Figure 4. Impact Analysis of Drivers and Restraints

Figure 5. Spend Analytics for Electronics and Semiconductor Market Revenue (US$ Million), 2022-2030

Figure 6. Spend Analytics for Electronics and Semiconductor Market Share (%) - by Component (2022 and 2030)

Figure 7. Software: Spend Analytics for Electronics and Semiconductor Market - Revenue and Forecast to 2030 (US$ Million)

Figure 8. Service: Spend Analytics for Electronics and Semiconductor Market - Revenue and Forecast to 2030 (US$ Million)

Figure 9. Spend Analytics for Electronics and Semiconductor Market Share (%) - by Type (2022 and 2030)

Figure 10. Descriptive Analytics: Spend Analytics for Electronics and Semiconductor Market - Revenue and Forecast to 2030 (US$ Million)

Figure 11. Predictive Analytics: Spend Analytics for Electronics and Semiconductor Market - Revenue and Forecast to 2030 (US$ Million)

Figure 12. Prescriptive Analytics: Spend Analytics for Electronics and Semiconductor Market - Revenue and Forecast to 2030 (US$ Million)

Figure 13. Spend Analytics for Electronics and Semiconductor Market Share (%) - by Deployment (2022 and 2030)

Figure 14. On-Premise: Spend Analytics for Electronics and Semiconductor Market - Revenue and Forecast to 2030 (US$ Million)

Figure 15. Cloud: Spend Analytics for Electronics and Semiconductor Market - Revenue and Forecast to 2030 (US$ Million)

Figure 16. Spend Analytics for Electronics and Semiconductor Market Share (%) - by Application (2022 and 2030)

Figure 17. Financial Management: Spend Analytics for Electronics and Semiconductor Market - Revenue and Forecast to 2030 (US$ Million)

Figure 18. Risk Management: Spend Analytics for Electronics and Semiconductor Market - Revenue and Forecast to 2030 (US$ Million)

Figure 19. Governance and Compliance Management: Spend Analytics for Electronics and Semiconductor Market - Revenue and Forecast to 2030 (US$ Million)

Figure 20. Supplier Sourcing and Performance Management: Spend Analytics for Electronics and Semiconductor Market - Revenue and Forecast to 2030 (US$ Million)

Figure 21. Demand and Supply Forecasting: Spend Analytics for Electronics and Semiconductor Market - Revenue and Forecast to 2030 (US$ Million)

Figure 22. Others: Spend Analytics for Electronics and Semiconductor Market - Revenue and Forecast to 2030 (US$ Million)

Figure 23. Spend Analytics for Electronics and Semiconductor Market, by Key Countries - Revenue (2022) (US$ Million)

Figure 24. North America: Spend Analytics for Electronics and Semiconductor Market Breakdown, by Key Countries, 2022 and 2030 (%)

Figure 25. United States: Spend Analytics for Electronics and Semiconductor Market - Revenue and Forecast to 2030 (US$ Million)

Figure 26. Canada: Spend Analytics for Electronics and Semiconductor Market - Revenue and Forecast to 2030 (US$ Million)

Figure 27. Mexico: Spend Analytics for Electronics and Semiconductor Market - Revenue and Forecast to 2030 (US$ Million)

1. Coupa Software Inc
2. International Business Machines Corp.
3. Ivalua Inc.
4. Lytica Inc.
5. NB Ventures Inc.
6. SAP SE.
7. Scanmarket AS.
8. Synertrade Inc.
9. Zycus Inc.

  • Save and reduce time carrying out entry-level research by identifying the growth, size, leading players, and segments in the North America spend analytics for electronics and semiconductor market.
  • Highlights key business priorities in order to assist companies to realign their business strategies.
  • The key findings and recommendations highlight crucial progressive industry trends in North America spend analytics for electronics and semiconductor market, thereby allowing players across the value chain to develop effective long-term strategies.
  • Develop/modify business expansion plans by using substantial growth offering developed and emerging markets.
  • Scrutinize in-depth North America market trends and outlook coupled with the factors driving the market, as well as those hindering it.
  • Enhance the decision-making process by understanding the strategies that underpin security interest with respect to client products, segmentation, pricing, and distribution.
Report Code
Full Name
Country Name
Email Id
Phone Number
Job Title
Company
Requirement

Note : Your data will never be shared with third parties, however, we may send you information from time to time about our products that may be of interest to you. By submitting your details, you agree to be contacted by us. You may contact us at any time to opt-out.


Purchase Options
Single User License
$3550
$2840
Site License
$4550
$3640
Enterprise License
$5550
$4440