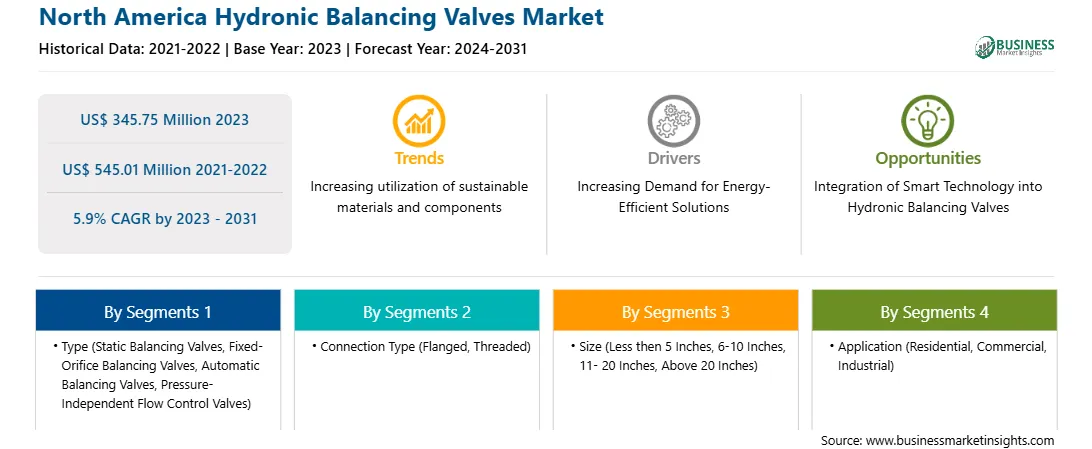
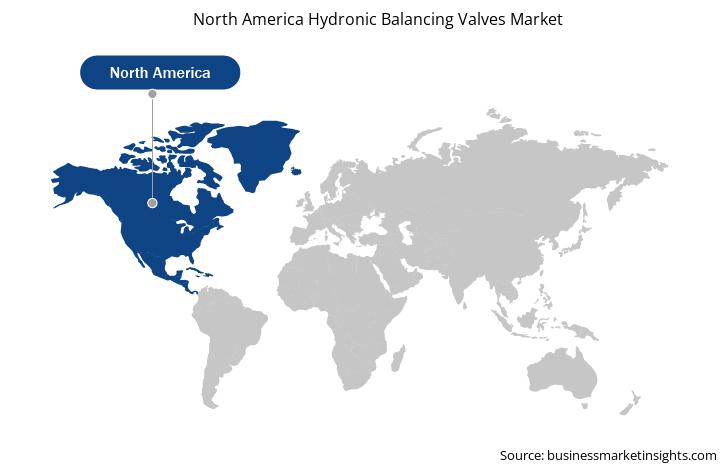
North America Hydronic Balancing Valves Market Forecast to 2031 – Regional Analysis – by Type (Static Balancing Valves, Fixed-Orifice Balancing Valves, Automatic Balancing Valves, and Pressure-Independent Flow Control Valves), Connection Type (Flanged, Threaded, and Others), Size (Less then 5 Inches, 6-10 Inches, 11- 20 Inches, and Above 20 Inches), and Application (Residential, Commercial, and Industrial)
The North America hydronic balancing valves market was valued at US$ 345.75 million in 2023 and is expected to reach US$ 545.01 million by 2031; it is estimated to register a CAGR of 5.9% from 2023 to 2031.
Increasing Demand for Energy-efficient Solutions Fuels North America Hydronic Balancing Valves Market
Consumer preference for energy-efficient appliances has been growing in recent times. Energy efficiency can provide long-term benefits by reducing overall electricity demand by lowering the need to invest in new infrastructure for electricity generation and transmission. It also contributes to the diversification of utility resource portfolios and can act as a buffer against the risk of volatile energy procurement expenditure. To attain energy efficiency, many manufacturing industries and commercial manufacturing companies are procuring high-efficiency HVAC systems. An efficient HVAC system utilizes less energy and operates more effectively than conventional systems, lowering the carbon footprint. In hydronic systems, the balancing valves facilitate the distribution of chilled or heated water to all terminals. The growing application of HVAC (Heating, Ventilation, and Air Conditioning) systems in air conditioning and heat pumps for achieving energy and growing implementation of energy efficiency standards for public buildings are boosting the demand for HVAC systems in various industrial and commercial sectors. Furthermore, growing initiatives of state and local governments are promoting energy efficiency programs and policies for public facilities, equipment usage, and government operations, which is boosting the application of HVAC systems. For instance, the renewable portfolio standard for New York was developed and implemented in 2004 and was expanded by Governor Cuomo's Clean Energy Standard (CES) in 2016. The CES has set a target of ~40% and approximately 80% reduction in greenhouse gas emissions by 2030 and 2050, respectively. One of the US states such as North Carolina has implemented renewable energy standards (RES) and the Zero-Emissions Credit (ZEC) requirement to lower carbon emissions. The main energy consumers in municipal-level operations are often the water and wastewater treatment facilities.
High-quality HVAC systems can be used at water and wastewater facilities to decrease energy costs and greenhouse gas emissions, which also increases the application of hydronic balancing valves. Thus, the growing demand for energy-efficient solutions drives the North America hydronic balancing valves market.
North America Hydronic Balancing Valves Market Overview
There is a rise in the adoption of HVAC systems owing to various features provided in these systems, such as energy efficiency and sustainability. According to Air Conditioning Contractors of America ACCA, HVAC services in North America are set to increase in value from US$ 25.6 billion in 2019 to US$ 35.8 billion by 2030. The growing application of HVAC systems is anticipated to propel the growth of the hydronic balancing valves market during the forecast period.
The hydronic balancing valves market is observing potential growth, owing to the rising adoption of advanced technologies and the increasing need for green construction solutions. Major application sectors such as residential, commercial, and industrial opt to integrate their HVAC systems into building management automation systems that streamline the system’s operation and maintenance. High technological development is boosting the application of advanced HVAC systems, which results in an increased usage of hydronic balancing valves in North America.
There is an increase in the utilization of advanced HVAC systems in various industries focused on energy efficiency and air quality improvement. The demand for hydronic balancing valves is directly influenced by the growth in manufacturing facilities, the pharmaceutical industry, IT, and ITES companies with rapid industrialization, along with the expansion of the service sector. Moreover, the wide presence of hydronic balancing valve manufacturers and suppliers such as Hays Fluid Controls, Victaulic Company, Red-White Valve Corp., Nibco Inc., Xylem Inc., and American Wheatley also fuels the market growth.
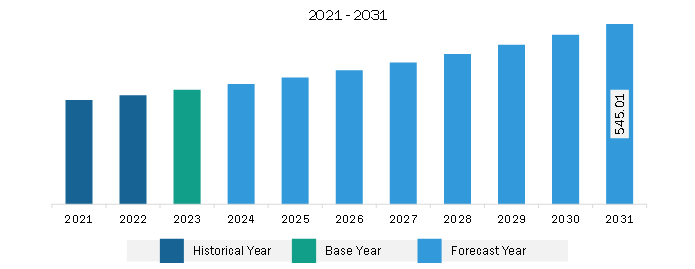
North America Hydronic Balancing Valves Market Revenue and Forecast to 2031 (US$ Million)
North America Hydronic Balancing Valves Market Segmentation
The North America hydronic balancing valves market is categorized into type, connection type, size, application, and country.
Based on types, the North America hydronic balancing valves market is segmented into static balancing valves, fixed-orifice balancing valves, automatic balancing valves, and pressure-independent flow control valves. The static balancing valves segment held the largest market share in 2023.
In terms of connection type, the North America hydronic balancing valves market is segmented into flanged, threaded, and others. The flanged segment held the largest market share in 2023.
By size, the North America hydronic balancing valves market is segmented into less then 5 inches, 6-10 inches, 11- 20 inches, and above 20 inches. The less then 5 inches segment held the largest market share in 2023.
By application, the North America hydronic balancing valves market is segmented into residential, commercial, and industrial. The residential segment held the largest market share in 2023.
By country, the North America hydronic balancing valves market is segmented into the US, Canada, and Mexico. The US dominated the North America hydronic balancing valves market share in 2023.
Caleffi S.p.a.; Danfoss AS; Frese A/S; Global Flow Products LLC; HAYS FLUID CONTROLS; Johnson Controls International Plc; Oventrop GmbH & Co. KG; Red-White Valve Corp.; Victaulic Company; and Xylem Inc. are some of the leading companies operating in the North America hydronic balancing valves market.
1. Introduction
1.1 The Insight Partners Research Report Guidance
1.2 Market Segmentation
2. Executive Summary
2.1 Key Insights
2.2 Market Attractiveness
3. Research Methodology
3.1 Secondary Research
3.2 Primary Research
3.2.1 Hypothesis formulation:
3.2.2 Macro-economic factor analysis:
3.2.3 Developing base number:
3.2.4 Data Triangulation:
3.2.5 Country level data:
4. North America Hydronic Balancing Valves Market Landscape
4.1 Overview
4.2 Ecosystem Analysis
4.2.1 Raw Materials Suppliers-
4.2.2 Manufacturing and Assembly:
4.2.3 Distribution and Logistics:
4.2.4 End Users:
4.2.5 List of Vendors in the Value Chain
5. North America Hydronic Balancing Valves Market – Key Market Dynamics
5.1 Market Drivers
5.1.1 Increasing Demand for Energy-efficient Solutions
5.1.2 Growing Application of Hydronic Balancing Valves for HVAC Systems in Oil & Gas Industry
5.1.3 Rising Urbanization Worldwide
5.2 Market Restraints
5.2.1 High Cost of Installation, Repair, and Maintenance of Hydronic Balancing Valves
5.3 Market Opportunities
5.3.1 Integration of Smart Technology into Hydronic Balancing Valves
5.4 Future Trends
5.4.1 Utilization of Sustainable Materials and Components in Public Infrastructure
5.5 Impact of Drivers and Restraints:
6. Hydronic Balancing Valves Market – North America Analysis
6.1 North America Hydronic Balancing Valves Market Revenue (US$ Million), 2021–2031
6.2 North America Hydronic Balancing Valves Market Forecast Analysis
7. North America Hydronic Balancing Valves Market Analysis – by Type
7.1 Static Balancing Valves
7.1.1 Overview
7.1.2 Static Balancing Valves: North America Hydronic Balancing Valves Market – Revenue and Forecast to 2031 (US$ Million)
7.2 Fixed-Orifice Balancing Valves
7.2.1 Overview
7.2.2 Fixed-Orifice Balancing Valves: North America Hydronic Balancing Valves Market – Revenue and Forecast to 2031 (US$ Million)
7.3 Automatic Balancing Valves
7.3.1 Overview
7.3.2 Automatic Balancing Valves: North America Hydronic Balancing Valves Market – Revenue and Forecast to 2031 (US$ Million)
7.4 Pressure-Independent Flow Control Valves
7.4.1 Overview
7.4.2 Pressure-Independent Flow Control Valves: North America Hydronic Balancing Valves Market – Revenue and Forecast to 2031 (US$ Million)
8. North America Hydronic Balancing Valves Market Analysis – by Connection Type
8.1 Flanged
8.1.1 Overview
8.1.2 Flanged: North America Hydronic Balancing Valves Market – Revenue and Forecast to 2031 (US$ Million)
8.2 Threaded
8.2.1 Overview
8.2.2 Threaded: North America Hydronic Balancing Valves Market – Revenue and Forecast to 2031 (US$ Million)
8.3 Others
8.3.1 Overview
8.3.2 Others: North America Hydronic Balancing Valves Market – Revenue and Forecast to 2031 (US$ Million)
9. North America Hydronic Balancing Valves Market Analysis by Size
9.1 Less than 5 Inches
9.1.1 Overview
9.1.2 Less than 5 Inches: North America Hydronic Balancing Valves Market – Revenue and Forecast to 2031 (US$ Million)
9.2 6-10 Inches
9.2.1 Overview
9.2.2 6-10 Inches: North America Hydronic Balancing Valves Market – Revenue and Forecast to 2031 (US$ Million)
9.3- 20 Inches
9.3.1 Overview
9.3.2- 20 Inches: North America Hydronic Balancing Valves Market – Revenue and Forecast to 2031 (US$ Million)
9.4 Above 20 Inches
9.4.1 Overview
9.4.2 Above 20 Inches: North America Hydronic Balancing Valves Market – Revenue and Forecast to 2031 (US$ Million)
10. North America Hydronic Balancing Valves Market Analysis by Application
10.1 Residential
10.1.1 Overview
10.1.2 Residential: North America Hydronic Balancing Valves Market – Revenue and Forecast to 2031 (US$ Million)
10.2 Commercial
10.2.1 Overview
10.2.2 Commercial: North America Hydronic Balancing Valves Market – Revenue and Forecast to 2031 (US$ Million)
10.3 Industrial
10.3.1 Overview
10.3.2 Industrial: North America Hydronic Balancing Valves Market – Revenue and Forecast to 2031 (US$ Million)
11. North America Hydronic Balancing Valves Market – Country Analysis
11.1 North America
11.1.1 North America Hydronic Balancing Valves Market Breakdown, by Key Countries, 2023 and 2031 (%)
11.1.1.1 North America Hydronic Balancing Valves Market – Revenue and Forecast Analysis – by Country
11.1.1.2 United States: North America Hydronic Balancing Valves Market – Revenue and Forecast to 2031 (US$ Million)
11.1.1.2.1 United States: North America Hydronic Balancing Valves Market Breakdown, by Type
11.1.1.2.2 United States: North America Hydronic Balancing Valves Market Breakdown, by Connection Type
11.1.1.2.3 United States: North America Hydronic Balancing Valves Market Breakdown, by Size
11.1.1.2.4 United States: North America Hydronic Balancing Valves Market Breakdown, by Application
11.1.1.3 Canada: North America Hydronic Balancing Valves Market – Revenue and Forecast to 2031 (US$ Million)
11.1.1.3.1 Canada: North America Hydronic Balancing Valves Market Breakdown, by Type
11.1.1.3.2 Canada: North America Hydronic Balancing Valves Market Breakdown, by Connection Type
11.1.1.3.3 Canada: North America Hydronic Balancing Valves Market Breakdown, by Size
11.1.1.3.4 Canada: North America Hydronic Balancing Valves Market Breakdown, by Application
11.1.1.4 Mexico: North America Hydronic Balancing Valves Market – Revenue and Forecast to 2031 (US$ Million)
11.1.1.4.1 Mexico: North America Hydronic Balancing Valves Market Breakdown, by Type
11.1.1.4.2 Mexico: North America Hydronic Balancing Valves Market Breakdown, by Connection Type
11.1.1.4.3 Mexico: North America Hydronic Balancing Valves Market Breakdown, by Size
11.1.1.4.4 Mexico: North America Hydronic Balancing Valves Market Breakdown, by Application
12. Competitive Landscape
12.1 Company Positioning & Concentration
12.2 Heat Map Analysis
13. Industry Landscape
13.1 Overview
13.2 Market Initiative
13.3 Product Development
13.4 Mergers & Acquisitions
14. Company Profiles
14.1 Danfoss AS
14.1.1 Key Facts
14.1.2 Business Description
14.1.3 Products and Services
14.1.4 Financial Overview
14.1.5 SWOT Analysis
14.1.6 Key Developments
14.2 Johnson Controls International Plc
14.2.1 Key Facts
14.2.2 Business Description
14.2.3 Products and Services
14.2.4 Financial Overview
14.2.5 SWOT Analysis
14.2.6 Key Developments
14.3 Xylem Inc.
14.3.1 Key Facts
14.3.2 Business Description
14.3.3 Products and Services
14.3.4 Financial Overview
14.3.5 SWOT Analysis
14.3.6 Key Developments
14.4 HAYS FLUID CONTROLS
14.4.1 Key Facts
14.4.2 Business Description
14.4.3 Products and Services
14.4.4 Financial Overview
14.4.5 SWOT Analysis
14.4.6 Key Developments
14.5 Victaulic Company
14.5.1 Key Facts
14.5.2 Business Description
14.5.3 Products and Services
14.5.4 Financial Overview
14.5.5 SWOT Analysis
14.5.6 Key Developments
14.6 Red-White Valve Corp.
14.6.1 Key Facts
14.6.2 Business Description
14.6.3 Products and Services
14.6.4 Financial Overview
14.6.5 SWOT Analysis
14.6.6 Key Developments
14.7 Oventrop GmbH & Co. KG
14.7.1 Key Facts
14.7.2 Business Description
14.7.3 Products and Services
14.7.4 Financial Overview
14.7.5 SWOT Analysis
14.7.6 Key Developments
14.8 Caleffi S.p.a.
14.8.1 Key Facts
14.8.2 Business Description
14.8.3 Products and Services
14.8.4 Financial Overview
14.8.5 SWOT Analysis
14.8.6 Key Developments
14.9 Frese A/S
14.9.1 Key Facts
14.9.2 Business Description
14.9.3 Products and Services
14.9.4 Financial Overview
14.9.5 SWOT Analysis
14.9.6 Key Developments
14.10 Global Flow Products LLC
14.10.1 Key Facts
14.10.2 Business Description
14.10.3 Products and Services
14.10.4 Financial Overview
14.10.5 SWOT Analysis
14.10.6 Key Developments
15. Appendix
15.1 About The Insight Partners
List of Tables
Table 1. North America Hydronic Balancing Valves Market Segmentation
Table 2. List of Vendors
Table 3. North America Hydronic Balancing Valves Market – Revenue and Forecast to 2031 (US$ Million)
Table 4. North America Hydronic Balancing Valves Market – Revenue and Forecast to 2031 (US$ Million) – by Type
Table 5. North America Hydronic Balancing Valves Market – Revenue and Forecast to 2031 (US$ Million) – by Connection Type
Table 6. North America Hydronic Balancing Valves Market – Revenue and Forecast to 2031 (US$ Million) – by Size
Table 7. North America Hydronic Balancing Valves Market – Revenue and Forecast to 2031 (US$ Million) – by Application
Table 8. North America Hydronic Balancing Valves Market – Revenue and Forecast to 2031 (US$ Million) – by Country
Table 9. United States: North America Hydronic Balancing Valves Market – Revenue and Forecast to 2031 (US$ Million) – by Type
Table 10. United States: North America Hydronic Balancing Valves Market – Revenue and Forecast to 2031 (US$ Million) – by Connection Type
Table 11. United States: North America Hydronic Balancing Valves Market – Revenue and Forecast to 2031 (US$ Million) – by Size
Table 12. United States: North America Hydronic Balancing Valves Market – Revenue and Forecast to 2031 (US$ Million) – by Application
Table 13. Canada: North America Hydronic Balancing Valves Market – Revenue and Forecast to 2031 (US$ Million) – by Type
Table 14. Canada: North America Hydronic Balancing Valves Market – Revenue and Forecast to 2031 (US$ Million) – by Connection Type
Table 15. Canada: North America Hydronic Balancing Valves Market – Revenue and Forecast to 2031 (US$ Million) – by Size
Table 16. Canada: North America Hydronic Balancing Valves Market – Revenue and Forecast to 2031 (US$ Million) – by Application
Table 17. Mexico: North America Hydronic Balancing Valves Market – Revenue and Forecast to 2031 (US$ Million) – by Type
Table 18. Mexico: North America Hydronic Balancing Valves Market – Revenue and Forecast to 2031 (US$ Million) – by Connection Type
Table 19. Mexico: North America Hydronic Balancing Valves Market – Revenue and Forecast to 2031 (US$ Million) – by Size
Table 20. Mexico: North America Hydronic Balancing Valves Market – Revenue and Forecast to 2031 (US$ Million) – by Application
List of Figures
Figure 1. North America Hydronic Balancing Valves Market Segmentation, by Country
Figure 2. North America Hydronic Balancing Valves Market – Key Market Dynamics
Figure 3. Impact Analysis of Drivers and Restraints
Figure 4. North America Hydronic Balancing Valves Market Revenue (US$ Million), 2021–2031
Figure 5. North America Hydronic Balancing Valves Market Share (%) – by Type (2023 and 2031)
Figure 6. Static Balancing Valves: North America Hydronic Balancing Valves Market – Revenue and Forecast to 2031 (US$ Million)
Figure 7. Fixed-Orifice Balancing Valves: North America Hydronic Balancing Valves Market – Revenue and Forecast to 2031 (US$ Million)
Figure 8. Automatic Balancing Valves: North America Hydronic Balancing Valves Market – Revenue and Forecast to 2031 (US$ Million)
Figure 9. Pressure-Independent Flow Control Valves: North America Hydronic Balancing Valves Market – Revenue and Forecast to 2031 (US$ Million)
Figure 10. North America Hydronic Balancing Valves Market Share (%) – by Connection Type (2023 and 2031)
Figure 11. Flanged: North America Hydronic Balancing Valves Market – Revenue and Forecast to 2031 (US$ Million)
Figure 12. Threaded: North America Hydronic Balancing Valves Market – Revenue and Forecast to 2031 (US$ Million)
Figure 13. Others: North America Hydronic Balancing Valves Market – Revenue and Forecast to 2031 (US$ Million)
Figure 14. North America Hydronic Balancing Valves Market Share (%) – by Size (2023 and 2031)
Figure 15. Less than 5 Inches: North America Hydronic Balancing Valves Market – Revenue and Forecast to 2031 (US$ Million)
Figure 16. 6-10 Inches: North America Hydronic Balancing Valves Market – Revenue and Forecast to 2031 (US$ Million)
Figure 17.- 20 Inches: North America Hydronic Balancing Valves Market – Revenue and Forecast to 2031 (US$ Million)
Figure 18. Above 20 Inches: North America Hydronic Balancing Valves Market – Revenue and Forecast to 2031 (US$ Million)
Figure 19. North America Hydronic Balancing Valves Market Share (%) – by Application (2023 and 2031)
Figure 20. Residential: North America Hydronic Balancing Valves Market – Revenue and Forecast to 2031 (US$ Million)
Figure 21. Commercial: North America Hydronic Balancing Valves Market – Revenue and Forecast to 2031 (US$ Million)
Figure 22. Industrial: North America Hydronic Balancing Valves Market – Revenue and Forecast to 2031 (US$ Million)
Figure 23. North America Hydronic Balancing Valves Market Breakdown, by Key Countries – Revenue (2023) (US$ Million)
Figure 24. North America Hydronic Balancing Valves Market Breakdown, by Key Countries, 2023 and 2031 (%)
Figure 25. United States: North America Hydronic Balancing Valves Market – Revenue and Forecast to 2031 (US$ Million)
Figure 26. Canada: North America Hydronic Balancing Valves Market – Revenue and Forecast to 2031 (US$ Million)
Figure 27. Mexico: North America Hydronic Balancing Valves Market – Revenue and Forecast to 2031 (US$ Million)
Figure 28. Company Positioning & Concentration
Figure 29. Heat Map Analysis
- Caleffi S.p.a.
- Danfoss AS
- Frese A/S
- Global Flow Products LLC
- HAYS FLUID CONTROLS
- Johnson Controls International Plc
- Oventrop GmbH & Co. KG
- Red-White Valve Corp.
- Victaulic Company
- Xylem Inc.
- Save and reduce time carrying out entry-level research by identifying the growth, size, leading players, and segments in the North America hydronic balancing valves market.
- Highlights key business priorities in order to assist companies to realign their business strategies.
- The key findings and recommendations highlight crucial progressive industry trends in the North America hydronic balancing valves market, thereby allowing players across the value chain to develop effective long-term strategies.
- Develop/modify business expansion plans by using substantial growth offering developed and emerging markets.
- Scrutinize in-depth North America market trends and outlook coupled with the factors driving the North America hydronic balancing valves market, as well as those hindering it.
- Enhance the decision-making process by understanding the strategies that underpin commercial interest with respect to client products, segmentation, pricing, and distribution.