North America Diagramming Software Market
The US, Canada, and Mexico are the key contributors to the diagramming software market in North America. The region, particularly the US and Canada, is experiencing significant demand for high-quality diagramming software due to the high adoption of advanced technology and the presence of large players in this region. North America is a highly competitive market as it attracts several technological developments from economically robust countries. The companies in the region are continuously enhancing the overall business processes to meet customers' demand for high-quality products and services in the best possible way. The diagramming software are increasingly being used in educational institutes, the corporate sector, and personal applications. Further, the growing usage of the cloud-based platform in software is fueling the demand for diagramming software in North America. Additionally, the increasing inclination toward web-based interface and large-scale investment made in this market will create an opportunity for the diagramming software market in North America. In North America, there is rising popularity of diagramming software due to its simple and easy operation, coupled with the low cost of the software. Additionally, the increasing digitalization across the region will create opportunities for the diagramming software market in North America. Moreover, due to the COVID-19 outbreak, a large number of individuals are working from home and spending more time online day and night, which is boosting the shift to digital. This demand for digital resources is further stressing the systems of several software and platform organizations and hindering their capability to serve services with reliability and quality. To put this into perspective, since the start of the pandemic, there has been over a 60% rise in remote working in the US alone. Lucidchart, CrossConcept Continuum PSA, Nevron Software (MyDraw), and Microsoft, are among the diagramming software market players operating in North America. Strategic alliances by mentioned companies will contribute to making the market grow. For instance, in 2021, Microsoft acquired CloudKnox, which supports the cloud infrastructure in the US.
The COVID-19 outbreak across North American countries, such as the US, Canada, and Mexico, has severely impacted all industries. Any impact on industries directly affects the region's economic development. The unprecedented rise in the number of COVID-19 cases across the US and the subsequent lockdown to combat the spread of the novel coronavirus across the country in the first two quarters of 2020 have led to numerous businesses to come on a standby situation. Technological investments in all industries in 2020 experienced a dip owing to the above-mentioned reasons. According to studies, more than 67% of enterprises across the US have adopted work from home environment due to the pandemic. This has propelled the adoption of cloud-based diagramming solutions across enterprises to enable smooth remote working among teams. The need for collaboration among team members during presentations and meetings has also fueled the adoption of collaboration enabled diagramming software across the region. Thus, the COVID-19 outbreak pandemic has positively impacted the growth of the diagramming software market in North America.

Strategic insights for the North America Diagramming Software provides data-driven analysis of the industry landscape, including current trends, key players, and regional nuances. These insights offer actionable recommendations, enabling readers to differentiate themselves from competitors by identifying untapped segments or developing unique value propositions. Leveraging data analytics, these insights help industry players anticipate the market shifts, whether investors, manufacturers, or other stakeholders. A future-oriented perspective is essential, helping stakeholders anticipate market shifts and position themselves for long-term success in this dynamic region. Ultimately, effective strategic insights empower readers to make informed decisions that drive profitability and achieve their business objectives within the market.
| Report Attribute | Details |
|---|---|
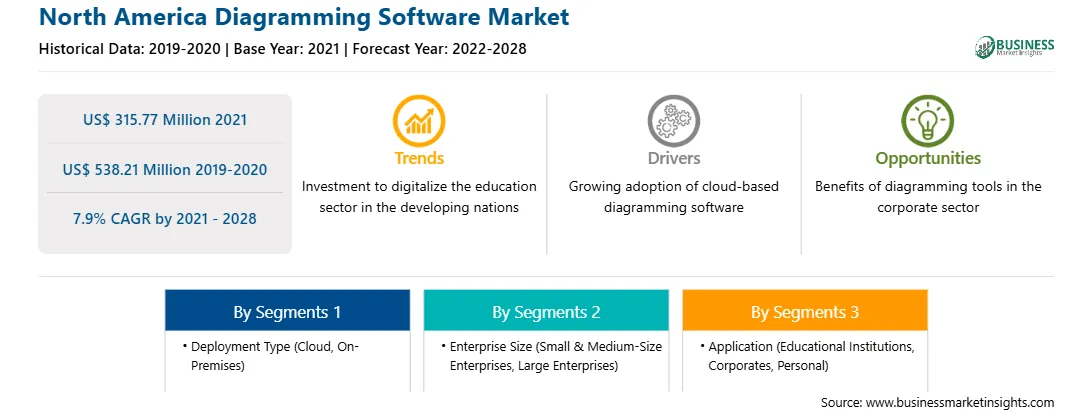
| Market size in 2021 | US$ 315.77 Million |
| Market Size by 2028 | US$ 538.21 Million |
| Global CAGR (2021 - 2028) | 7.9% |
| Historical Data | 2019-2020 |
| Forecast period | 2022-2028 |
| Segments Covered |
By Deployment Type
|
| Regions and Countries Covered | North America
|
| Market leaders and key company profiles |
The geographic scope of the North America Diagramming Software refers to the specific areas in which a business operates and competes. Understanding local distinctions, such as diverse consumer preferences (e.g., demand for specific plug types or battery backup durations), varying economic conditions, and regulatory environments, is crucial for tailoring strategies to specific markets. Businesses can expand their reach by identifying underserved areas or adapting their offerings to meet local demands. A clear market focus allows for more effective resource allocation, targeted marketing campaigns, and better positioning against local competitors, ultimately driving growth in those targeted areas.
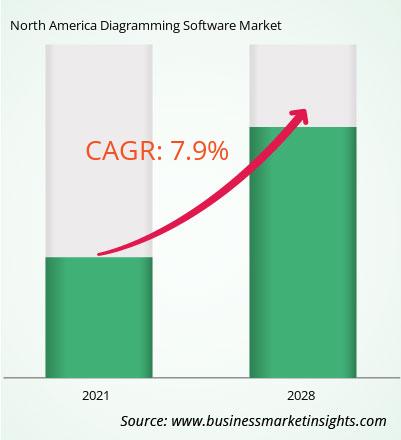
The diagramming software market in North America is expected to grow from US$ 315.77 million in 2021 to US$ 538.21 million by 2028; it is estimated to grow at a CAGR of 7.9% from 2021 to 2028. Increasing adoption of diagramming software across large enterprises; diagramming software is experiencing a rise in adoption across both large enterprises and small and medium enterprises over the years. Enterprises are adopting these solutions for various applications including flowchart, mind map, organization chart, timeline, and grant chart. The adoption of diagramming software enables to define workflow and hierarchy in a better manner, thereby offering transparency among organizations. For example, the increasing expansion of businesses across the region and rising adoption of centralized management among them is widening the employee base for the organizations. This is boosting the demand among the enterprises to have a proper organization chart that will enable them to allocate resources to projects undertaken as per their expertise. Additionally, the diagramming software are useful for various departments of an organization. These solutions are applied across departments such as marketing, human resources, operations, and engineering. These solutions help different departments to create flowcharts, customer journey mapping, process diagrams, project mapping, and timeline diagrams. Companies such as Lucid Software Inc. is offering different solutions for each department based on their requirements. These solutions are also able to easily collaborate on a real-time basis with the teams across remote locations. Thus, the above-mentioned factors are influencing the rapid adoption of diagramming software across enterprises, thereby contributing to the growth of the North America market. This is bolstering the growth of the diagramming software market.
Based on deployment type, the diagramming software market can be bifurcated into cloud and on-premises. In 2020, the cloud segment held the largest share North America diagramming software market. Based on enterprise size, the diagramming software market is categorized into small & medium-size enterprises and large enterprises. In 2020, the large enterprises segment held the largest share North America diagramming software market. Based on application, the diagramming software can be categorized into educational institutions, corporates, and personals. The corporates segment contributed a substantial share in 2020.
A few major primary and secondary sources referred to for preparing this report on the diagramming software market in North America are company websites, annual reports, financial reports, national government documents, and statistical database, among others. Major companies listed in the report are CREATELY (CINERGIX PTY LTD); DRAW.IO (//SEIBERT/MEDIA GMBH); Edrawsoft; Gliffy (Perforce Software, Inc.); Lucid Software Inc; Microsoft Corporation; Miro; MYDRAW (NEVRON SOFTWARE LLC); Nulab Inc; Samepage.io; and SmartDraw, LLC among others.
The North America Diagramming Software Market is valued at US$ 315.77 Million in 2021, it is projected to reach US$ 538.21 Million by 2028.
As per our report North America Diagramming Software Market, the market size is valued at US$ 315.77 Million in 2021, projecting it to reach US$ 538.21 Million by 2028. This translates to a CAGR of approximately 7.9% during the forecast period.
The North America Diagramming Software Market report typically cover these key segments-
The historic period, base year, and forecast period can vary slightly depending on the specific market research report. However, for the North America Diagramming Software Market report:
The North America Diagramming Software Market is populated by several key players, each contributing to its growth and innovation. Some of the major players include:
The North America Diagramming Software Market report is valuable for diverse stakeholders, including:
Essentially, anyone involved in or considering involvement in the North America Diagramming Software Market value chain can benefit from the information contained in a comprehensive market report.
Office No. 1011, First floor, Farena Corporate Park, Magarpatta-Mundhwa road, Pune - 411028, Maharashtra, India
US:+16467917070
sales@businessmarketinsights.com


 Get Free Sample For North America Diagramming Software Market
