Middle East & Africa Tea Extracts Market Forecast to 2031 – Regional Analysis – by Type (Green Tea, Black Tea, Oolong Tea, and Others), Category (Conventional and Organic), Form (Powder and Liquid), and Application (Food and Beverages, Bakery and Confectionery, Dairy and Frozen Dessert, Beverages, Other Food and Beverages, Dietary Supplements, Personal Care and Cosmetics, and Others)
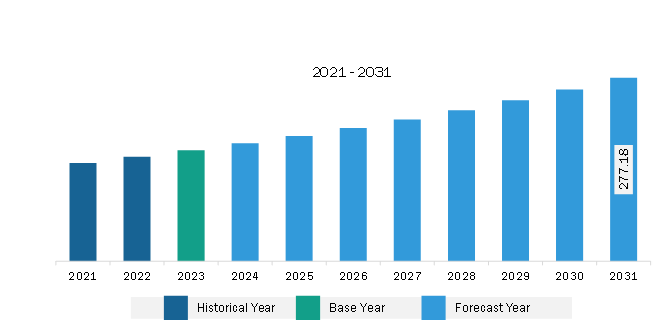
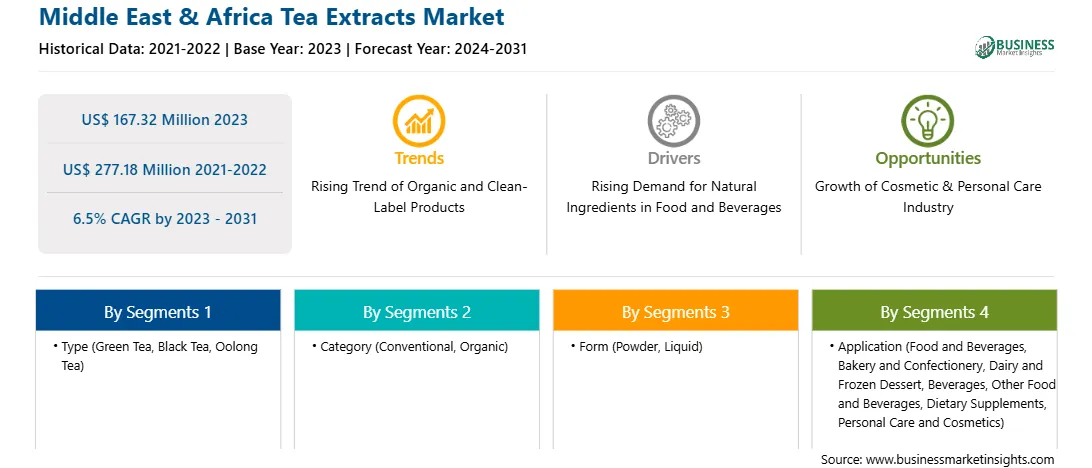
The Middle East & Africa tea extracts market was valued at US$ 167.32 million in 2023 and is expected to reach US$ 277.18 million by 2031; it is estimated to register a CAGR of 6.5% from 2023 to 2031.
Rising Trend of Organic and Clean-Label Products Bolsters Middle East & Africa Tea Extracts Market
Consumers across the globe are leaning toward the adoption of a healthier lifestyle. Natural flavors can satisfy consumers' dietary requirements. Descriptions on menus and labels on food packaging highly influence consumer preferences. An understandable and clear label with thorough ingredient information attracts consumers to buy products. Companies' claims of natural ingredient content in the product on the front side of the packaging might attract a large number of consumers. Clean-label products are becoming increasingly popular as consumers prefer 100% natural products with no synthetic ingredients such as preservatives, artificial colors, flavors, etc. Virginia Dare Extract Co and Florida Food Products, Inc are among the companies that offer clean label tea extracts.
Organic products are cultivated naturally with manure or compost without chemical fertilizers and pesticides. Organic products are free of growth hormones, genetically modified ingredients (GMI), and antibiotic residues. The popularity of organic products such as organic tea has increased among health-conscious consumers owing to the rising awareness of their benefits. Organic tea farming comprises eco-friendly agricultural practices that result in higher crop yields. Many organic tea farming communities across Asian countries and other tea-cultivating economies follow organic farming practices to produce value-added organic products. Thus, manufacturers are launching organic tea extracts to cater to the increasing demand. For instance, in November 2022, Layn Natural Ingredients – manufacturer of botanical extract ingredients, launched tea extracts in organic form.
A few end-use industries such as personal care, food and beverages, and nutraceuticals employ organic tea extract to ensure the offering of sustainable products free of genetically modified organisms (GMOs) or any other questionable ingredients. Organic products offer a significant competitive advantage to tea extract manufacturers, enhancing their brand awareness and profitability.
Thus, the rising demand for organic and clean-label products is expected to create a new trend in the tea extracts market during the forecast period.
Middle East & Africa Tea Extracts Market Overview
In terms of value, the tea extracts market in Rest of Middle East & Africa was valued at US$ 94.87 million in 2023 and is projected to reach US$ 149.61 million by 2031; it is expected to register a CAGR of 5.9% from 2023 to 2031.
Turkey, Kuwait, Qatar, Bahrain, Oman, and Kenya are among the major countries in the Rest of Middle East & Africa tea extracts market. Growing health consciousness, the cultural significance of tea, and product innovation across various industries, drives the tea extracts market. The rise in disposable incomes in Gulf states fuels the demand for premium tea extract-based products, while tourism exposes the consumers to diverse tea cultures. Countries with strong tea production capabilities, such as Kenya, are exploring opportunities in the tea extracts market for both domestic use and exports. These factors collectively shape the dynamic landscape of the tea extracts market.
Middle East & Africa Tea Extracts Market Revenue and Forecast to 2031 (US$ Million)
Middle East & Africa Tea Extracts Market Segmentation
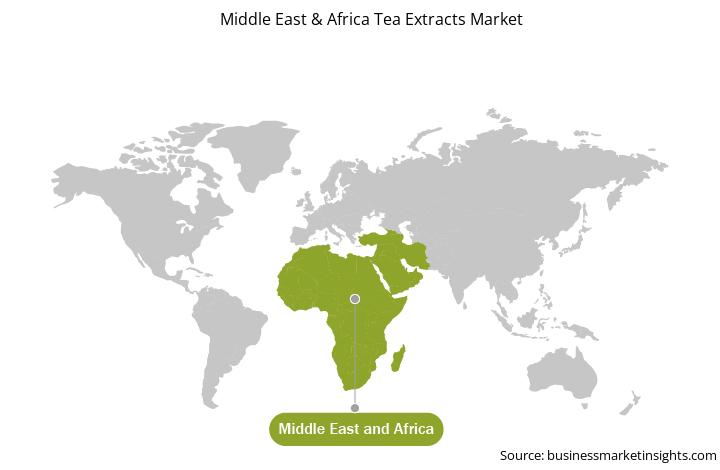
The Middle East & Africa tea extracts market is categorized into type, category, form, application, and country.
Based on type, the Middle East & Africa tea extracts market is segmented into green tea, black tea, oolong tea, and others. The green tea segment held the largest market share in 2023.
In terms of form, the Middle East & Africa tea extracts market is bifurcated into powder and liquid. The liquid segment held a larger market share in 2023.
By application, the Middle East & Africa tea extracts market is segmented into food and beverages, bakery and confectionery, dairy and frozen dessert, beverages, other food and beverages, dietary supplements, personal care and cosmetics, and others. The food and beverages segment held the largest market share in 2023.
By category, the Middle East & Africa tea extracts market is bifurcated into conventional and organic. The conventional segment held a larger market share in 2023.
By country, the Middle East & Africa tea extracts market is segmented into the UAE, South Africa, Saudi Arabia, and the Rest of Middle East & Africa. The Rest of Middle East & Africa dominated the Middle East & Africa tea extracts market share in 2023.
Finlays, Botanic Healthcare Group, Martin Bauer GmbH & Co KG, Firmenich International SA, Givaudan SA, International Flavors & Fragrances Inc, Kerry Group Plc, Archer Daniels Midland Company, Sensient Technologies Corp, Kemin Industries Inc, Medikonda Nutrients, Virginia Dare Extract Co Inc, Lipoid-Kosmetik, Florida Food Products, and Dohler GmbH are some of the leading companies operating in the Middle East & Africa tea extracts market.
1. Introduction
1.1 Report Guidance
1.2 Market Segmentation
2. Executive Summary
2.1 Key Insights
2.2 Market Attractiveness
3. Research Methodology
3.1 Secondary Research
3.2 Primary Research
3.2.1 Hypothesis formulation:
3.2.2 Macroeconomic factor analysis:
3.2.3 Developing base number:
3.2.4 Data Triangulation:
3.2.5 Country-level data:
3.3 Assumptions and Limitations
4. Middle East & Africa Tea Extracts Market Landscape
4.1 Overview
4.2 Porter's Five Forces Analysis
4.3 Ecosystem Analysis
4.4 List of Vendors in the Value Chain
5. Middle East & Africa Tea Extracts Market – Key Market Dynamics
5.1 Market Drivers
5.2 Market Restraints
5.3 Market Opportunities
5.4 Future Trends
5.5 Impact of Drivers and Restraints:
6. Middle East & Africa Tea Extracts Market – Analysis
6.1 Middle East & Africa Tea Extracts Market Revenue (US$ Million), 2021–2031
6.2 Middle East & Africa Tea Extracts Market Forecast Analysis
7. Middle East & Africa Tea Extracts Market Analysis – by Type
7.1 Green Tea
7.1.1 Overview
7.1.2 Green Tea: Middle East & Africa Tea Extracts Market – Revenue and Forecast, 2021–2031 (US$ Million)
7.2 Black Tea
7.2.1 Overview
7.2.2 Black Tea: Middle East & Africa Tea Extracts Market – Revenue and Forecast, 2021–2031 (US$ Million)
7.3 Oolong Tea
7.3.1 Overview
7.3.2 Oolong Tea: Middle East & Africa Tea Extracts Market – Revenue and Forecast, 2021–2031 (US$ Million)
7.4 Others
7.4.1 Overview
7.4.2 Others: Middle East & Africa Tea Extracts Market – Revenue and Forecast, 2021–2031 (US$ Million)
8. Middle East & Africa Tea Extracts Market Analysis – by Category
8.1 Conventional
8.1.1 Overview
8.1.2 Conventional: Middle East & Africa Tea Extracts Market – Revenue and Forecast, 2021–2031 (US$ Million)
8.2 Organic
8.2.1 Overview
8.2.2 Organic: Middle East & Africa Tea Extracts Market – Revenue and Forecast, 2021–2031 (US$ Million)
9. Middle East & Africa Tea Extracts Market Analysis – by Form
9.1 Powder
9.1.1 Overview
9.1.2 Powder: Middle East & Africa Tea Extracts Market – Revenue and Forecast, 2021–2031 (US$ Million)
9.2 Liquid
9.2.1 Overview
9.2.2 Liquid: Middle East & Africa Tea Extracts Market – Revenue and Forecast, 2021–2031 (US$ Million)
10. Middle East & Africa Tea Extracts Market Analysis – by Application
10.1 Food and Beverages
10.1.1 Overview
10.1.2 Food and Beverages: Middle East & Africa Tea Extracts Market – Revenue and Forecast, 2021–2031 (US$ Million)
10.2 Bakery and Confectionery
10.2.1 Overview
10.2.2 Bakery and Confectionery: Middle East & Africa Tea Extracts Market – Revenue and Forecast, 2021–2031 (US$ Million)
10.3 Dairy and Frozen Dessert
10.3.1 Overview
10.3.2 Dairy and Frozen Dessert: Middle East & Africa Tea Extracts Market – Revenue and Forecast, 2021–2031 (US$ Million)
10.4 Beverages
10.4.1 Overview
10.4.2 Beverages: Middle East & Africa Tea Extracts Market – Revenue and Forecast, 2021–2031 (US$ Million)
10.5 Other Food and Beverages
10.5.1 Overview
10.5.2 Other Food and Beverages: Middle East & Africa Tea Extracts Market – Revenue and Forecast, 2021–2031 (US$ Million)
10.6 Dietary Supplements
10.6.1 Overview
10.6.2 Dietary Supplements: Middle East & Africa Tea Extracts Market – Revenue and Forecast, 2021–2031 (US$ Million)
10.7 Personal Care and Cosmetics
10.7.1 Overview
10.7.2 Personal Care and Cosmetics: Middle East & Africa Tea Extracts Market – Revenue and Forecast, 2021–2031 (US$ Million)
10.8 Others
10.8.1 Overview
10.8.2 Others: Middle East & Africa Tea Extracts Market – Revenue and Forecast, 2021–2031 (US$ Million)
11. Middle East & Africa Tea Extracts Market – Country Analysis
11.1 Middle East & Africa
11.1.1 Middle East & Africa Tea Extracts Market – Revenue and Forecast Analysis – by Country
11.1.1.1 Middle East & Africa Tea Extracts Market – Revenue and Forecast Analysis – by Country
11.1.1.2 United Arab Emirates: Middle East & Africa Tea Extracts Market – Revenue and Forecast, 2021–2031 (US$ Million)
11.1.1.2.1 United Arab Emirates: Middle East & Africa Tea Extracts Market Share – by Type
11.1.1.2.2 United Arab Emirates: Middle East & Africa Tea Extracts Market Share – by Category
11.1.1.2.3 United Arab Emirates: Middle East & Africa Tea Extracts Market Share – by Form
11.1.1.2.4 United Arab Emirates: Middle East & Africa Tea Extracts Market Share – by Application
11.1.1.3 South Africa: Middle East & Africa Tea Extracts Market – Revenue and Forecast, 2021–2031 (US$ Million)
11.1.1.3.1 South Africa: Middle East & Africa Tea Extracts Market Share – by Type
11.1.1.3.2 South Africa: Middle East & Africa Tea Extracts Market Share – by Category
11.1.1.3.3 South Africa: Middle East & Africa Tea Extracts Market Share – by Form
11.1.1.3.4 South Africa: Middle East & Africa Tea Extracts Market Share – by Application
11.1.1.4 Saudi Arabia: Middle East & Africa Tea Extracts Market – Revenue and Forecast, 2021–2031 (US$ Million)
11.1.1.4.1 Saudi Arabia: Middle East & Africa Tea Extracts Market Share – by Type
11.1.1.4.2 Saudi Arabia: Middle East & Africa Tea Extracts Market Share – by Category
11.1.1.4.3 Saudi Arabia: Middle East & Africa Tea Extracts Market Share – by Form
11.1.1.4.4 Saudi Arabia: Middle East & Africa Tea Extracts Market Share – by Application
11.1.1.5 Rest of Middle East & Africa : Middle East & Africa Tea Extracts Market – Revenue and Forecast, 2021–2031 (US$ Million)
11.1.1.5.1 Rest of Middle East & Africa : Middle East & Africa Tea Extracts Market Share – by Type
11.1.1.5.2 Rest of Middle East & Africa : Middle East & Africa Tea Extracts Market Share – by Category
11.1.1.5.3 Rest of Middle East & Africa : Middle East & Africa Tea Extracts Market Share – by Form
11.1.1.5.4 Rest of Middle East & Africa : Middle East & Africa Tea Extracts Market Share – by Application
12. Competitive Landscape
12.1 Heat Map Analysis by Key Players
12.2 Company Positioning and Concentration
13. Industry Landscape
13.1 Overview
13.2 Market Initiative
13.3 Partnerships and Collaborations
13.4 Other Developments
14. Company Profiles
14.1 Finlays
14.1.1 Key Facts
14.1.2 Business Description
14.1.3 Products and Services
14.1.4 Financial Overview
14.1.5 SWOT Analysis
14.1.6 Key Developments
14.2 MartinBauer
14.2.1 Key Facts
14.2.2 Business Description
14.2.3 Products and Services
14.2.4 Financial Overview
14.2.5 SWOT Analysis
14.2.6 Key Developments
14.3 Dohler Group SE
14.3.1 Key Facts
14.3.2 Business Description
14.3.3 Products and Services
14.3.4 Financial Overview
14.3.5 SWOT Analysis
14.3.6 Key Developments
14.4 Firmenich International SA
14.4.1 Key Facts
14.4.2 Business Description
14.4.3 Products and Services
14.4.4 Financial Overview
14.4.5 SWOT Analysis
14.4.6 Key Developments
14.5 Givaudan SA
14.5.1 Key Facts
14.5.2 Business Description
14.5.3 Products and Services
14.5.4 Financial Overview
14.5.5 SWOT Analysis
14.5.6 Key Developments
14.6 International Flavors & Fragrances Inc
14.6.1 Key Facts
14.6.2 Business Description
14.6.3 Products and Services
14.6.4 Financial Overview
14.6.5 SWOT Analysis
14.6.6 Key Developments
14.7 Kerry Group Plc
14.7.1 Key Facts
14.7.2 Business Description
14.7.3 Products and Services
14.7.4 Financial Overview
14.7.5 SWOT Analysis
14.7.6 Key Developments
14.8 Archer Daniels Midland Company
14.8.1 Key Facts
14.8.2 Business Description
14.8.3 Products and Services
14.8.4 Financial Overview
14.8.5 SWOT Analysis
14.8.6 Key Developments
14.9 Sensient Technologies Corp
14.9.1 Key Facts
14.9.2 Business Description
14.9.3 Products and Services
14.9.4 Financial Overview
14.9.5 SWOT Analysis
14.9.6 Key Developments
14.10 Kemin Industries Inc
14.10.1 Key Facts
14.10.2 Business Description
14.10.3 Products and Services
14.10.4 Financial Overview
14.10.5 SWOT Analysis
14.10.6 Key Developments
14.11 Botanic Healthcare Pvt Ltd
14.11.1 Key Facts
14.11.2 Business Description
14.11.3 Products and Services
14.11.4 Financial Overview
14.11.5 SWOT Analysis
14.11.6 Key Developments
14.12 Medikonda Nutrients
14.12.1 Key Facts
14.12.2 Business Description
14.12.3 Products and Services
14.12.4 Financial Overview
14.12.5 SWOT Analysis
14.12.6 Key Developments
14.13 Virginia Dare Extract Co Inc
14.13.1 Key Facts
14.13.2 Business Description
14.13.3 Products and Services
14.13.4 Financial Overview
14.13.5 SWOT Analysis
14.13.6 Key Developments
14.14 Lipoid-Kosmetik
14.14.1 Key Facts
14.14.2 Business Description
14.14.3 Products and Services
14.14.4 Financial Overview
14.14.5 SWOT Analysis
14.14.6 Key Developments
14.15 Florida Food Products
14.15.1 Key Facts
14.15.2 Business Description
14.15.3 Products and Services
14.15.4 Financial Overview
14.15.5 SWOT Analysis
14.15.6 Key Developments
14.16 Dohler GmbH
14.16.1 Key Facts
14.16.2 Business Description
14.16.3 Products and Services
14.16.4 Financial Overview
14.16.5 SWOT Analysis
14.16.6 Key Developments
15. Appendix
15.1 About Us
15.2 List of Abbreviations
List of Tables
Table 1. Middle East & Africa Tea Extracts Market Segmentation
Table 2. List of Vendors
Table 3. Middle East & Africa Tea Extracts Market – Revenue and Forecast, 2021–2031 (US$ Million)
Table 4. Middle East & Africa Tea Extracts Market – Revenue and Forecast, 2021–2031 (US$ Million) – by Type
Table 5. Middle East & Africa Tea Extracts Market – Revenue and Forecast, 2021–2031 (US$ Million) – by Category
Table 6. Middle East & Africa Tea Extracts Market – Revenue and Forecast, 2021–2031 (US$ Million) – by Form
Table 7. Middle East & Africa Tea Extracts Market – Revenue and Forecast, 2021–2031 (US$ Million) – by Application
Table 8. Middle East & Africa Tea Extracts Market – Revenue and Forecast, 2021–2031 (US$ Million) – by Country
Table 9. United Arab Emirates: Middle East & Africa Tea Extracts Market – Revenue and Forecast, 2021 – 2031(US$ Million) – by Type
Table 10. United Arab Emirates: Middle East & Africa Tea Extracts Market – Revenue and Forecast, 2021 – 2031(US$ Million) – by Category
Table 11. United Arab Emirates: Middle East & Africa Tea Extracts Market – Revenue and Forecast, 2021 – 2031(US$ Million) – by Form
Table 12. United Arab Emirates: Middle East & Africa Tea Extracts Market – Revenue and Forecast, 2021 – 2031(US$ Million) – by Application
Table 13. South Africa: Middle East & Africa Tea Extracts Market – Revenue and Forecast, 2021 – 2031(US$ Million) – by Type
Table 14. South Africa: Middle East & Africa Tea Extracts Market – Revenue and Forecast, 2021 – 2031(US$ Million) – by Category
Table 15. South Africa: Middle East & Africa Tea Extracts Market – Revenue and Forecast, 2021 – 2031(US$ Million) – by Form
Table 16. South Africa: Middle East & Africa Tea Extracts Market – Revenue and Forecast, 2021 – 2031(US$ Million) – by Application
Table 17. Saudi Arabia: Middle East & Africa Tea Extracts Market – Revenue and Forecast, 2021 – 2031(US$ Million) – by Type
Table 18. Saudi Arabia: Middle East & Africa Tea Extracts Market – Revenue and Forecast, 2021 – 2031(US$ Million) – by Category
Table 19. Saudi Arabia: Middle East & Africa Tea Extracts Market – Revenue and Forecast, 2021 – 2031(US$ Million) – by Form
Table 20. Saudi Arabia: Middle East & Africa Tea Extracts Market – Revenue and Forecast, 2021 – 2031(US$ Million) – by Application
Table 21. Rest of Middle East & Africa : Middle East & Africa Tea Extracts Market – Revenue and Forecast, 2021 – 2031(US$ Million) – by Type
Table 22. Rest of Middle East & Africa : Middle East & Africa Tea Extracts Market – Revenue and Forecast, 2021 – 2031(US$ Million) – by Category
Table 23. Rest of Middle East & Africa : Middle East & Africa Tea Extracts Market – Revenue and Forecast, 2021 – 2031(US$ Million) – by Form
Table 24. Rest of Middle East & Africa : Middle East & Africa Tea Extracts Market – Revenue and Forecast, 2021 – 2031(US$ Million) – by Application
Table 25. List of Abbreviations
List of Figures
Figure 1. Middle East & Africa Tea Extracts Market Segmentation – Country
Figure 2. Porter's Five Forces Analysis
Figure 3. Impact Analysis of Drivers and Restraints
Figure 4. Middle East & Africa Tea Extracts Market Revenue (US$ Million), 2021–2031
Figure 5. Middle East & Africa Tea Extracts Market Share (%) – by Type (2023 and 2031)
Figure 6. Green Tea: Middle East & Africa Tea Extracts Market – Revenue and Forecast, 2021–2031 (US$ Million)
Figure 7. Black Tea: Middle East & Africa Tea Extracts Market – Revenue and Forecast, 2021–2031 (US$ Million)
Figure 8. Oolong Tea: Middle East & Africa Tea Extracts Market – Revenue and Forecast, 2021–2031 (US$ Million)
Figure 9. Others: Middle East & Africa Tea Extracts Market – Revenue and Forecast, 2021–2031 (US$ Million)
Figure 10. Middle East & Africa Tea Extracts Market Share (%) – by Category (2023 and 2031)
Figure 11. Conventional: Middle East & Africa Tea Extracts Market – Revenue and Forecast, 2021–2031 (US$ Million)
Figure 12. Organic: Middle East & Africa Tea Extracts Market – Revenue and Forecast, 2021–2031 (US$ Million)
Figure 13. Middle East & Africa Tea Extracts Market Share (%) – by Form (2023 and 2031)
Figure 14. Powder: Middle East & Africa Tea Extracts Market – Revenue and Forecast, 2021–2031 (US$ Million)
Figure 15. Liquid: Middle East & Africa Tea Extracts Market – Revenue and Forecast, 2021–2031 (US$ Million)
Figure 16. Middle East & Africa Tea Extracts Market Share (%) – by Application (2023 and 2031)
Figure 17. Food and Beverages: Middle East & Africa Tea Extracts Market – Revenue and Forecast, 2021–2031 (US$ Million)
Figure 18. Bakery and Confectionery: Middle East & Africa Tea Extracts Market – Revenue and Forecast, 2021–2031 (US$ Million)
Figure 19. Dairy and Frozen Dessert: Middle East & Africa Tea Extracts Market – Revenue and Forecast, 2021–2031 (US$ Million)
Figure 20. Beverages: Middle East & Africa Tea Extracts Market – Revenue and Forecast, 2021–2031 (US$ Million)
Figure 21. Other Food and Beverages: Middle East & Africa Tea Extracts Market – Revenue and Forecast, 2021–2031 (US$ Million)
Figure 22. Dietary Supplements: Middle East & Africa Tea Extracts Market – Revenue and Forecast, 2021–2031 (US$ Million)
Figure 23. Personal Care and Cosmetics: Middle East & Africa Tea Extracts Market – Revenue and Forecast, 2021–2031 (US$ Million)
Figure 24. Others: Middle East & Africa Tea Extracts Market – Revenue and Forecast, 2021–2031 (US$ Million)
Figure 25. Middle East & Africa Tea Extracts Market Breakdown, by Key Countries, 2023 and 2031 (%)
Figure 26. United Arab Emirates: Middle East & Africa Tea Extracts Market – Revenue and Forecast, 2021– 2031 (US$ Million)
Figure 27. South Africa: Middle East & Africa Tea Extracts Market – Revenue and Forecast, 2021– 2031 (US$ Million)
Figure 28. Saudi Arabia: Middle East & Africa Tea Extracts Market – Revenue and Forecast, 2021– 2031 (US$ Million)
Figure 29. Rest of Middle East & Africa : Middle East & Africa Tea Extracts Market – Revenue and Forecast, 2021– 2031 (US$ Million)
Figure 30. Heat Map Analysis by Key Players
Figure 31. Company Positioning and Concentration
- Finlays
- Botanic Healthcare Group
- Martin Bauer GmbH & Co KG
- Firmenich International SA
- Givaudan SA
- International Flavors & Fragrances Inc
- Kerry Group Plc
- Archer Daniels Midland Company
- Sensient Technologies Corp
- Kemin Industries Inc
- Medikonda Nutrients
- Virginia Dare Extract Co Inc
- Lipoid-Kosmetik
- Florida Food Products
- Dohler GmbH
- Save and reduce time carrying out entry-level research by identifying the growth, size, leading players, and segments in the Middle East & Africa tea extracts market.
- Highlights key business priorities in order to assist companies to realign their business strategies.
- The key findings and recommendations highlight crucial progressive industry trends in the Middle East & Africa tea extracts market, thereby allowing players across the value chain to develop effective long-term strategies.
- Develop/modify business expansion plans by using substantial growth offering developed and emerging markets.
- Scrutinize in-depth Middle East & Africa market trends and outlook coupled with the factors driving the Middle East & Africa tea extracts market, as well as those hindering it.
- Enhance the decision-making process by understanding the strategies that underpin commercial interest with respect to client products, segmentation, pricing, and distribution.