Middle East & Africa Interactive Display Market Forecast to 2031 - Regional Analysis - by Product (Interactive Kiosks, Interactive Whiteboards, Interactive Tables, Interactive Video Walls, and Interactive Monitors), Panel Size (17-32 Inches, 32-65 Inches, and Above 65 Inches), Panel Type (Flat, Flexible, and Transparent), and Industry Vertical (Retail & Hospitality, Healthcare, BFSI, Education, Entertainment, and Others)

BMIRE00030768 | Pages: 115 | Electronics and Semiconductor | Sep 2024 | Type: Regional | Status: Published

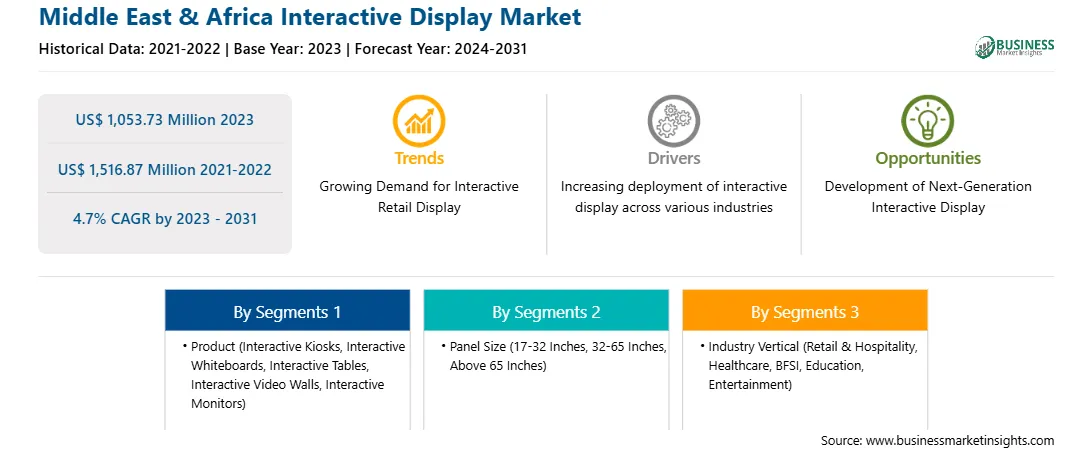
The Middle East & Africa interactive display market was valued at US$ 1,053.73 million in 2023 and is expected to reach US$ 1,516.87 million by 2031; it is estimated to register a CAGR of 4.7% from 2023 to 2031.

Rising Demand for Smart Learning Bolsters Middle East & Africa Interactive Display Market

The governments of several countries are increasingly investing in interactive displays to support smart education frameworks and develop suitable infrastructure for digital classrooms. The governments of different countries have surged the adoption of interactive displays for education systems, as it helps users improve visualization of content with smart viewing and allows them to display two or more materials at the same time on the same screen. The expansion of the education sector further encourages market players to develop innovative solutions for easy teaching and learning processes. For instance, in May 2023, LG Electronics Inc. unveiled the LG Create Board Interactive whiteboard solution for use in virtual classrooms. This interactive display enables both teachers and students to view or access and provide a fluid writing and sketching experience. Thus, the rising demand for smart learning drives the growth of the interactive display market.

Middle East & Africa Interactive Display Market Overview

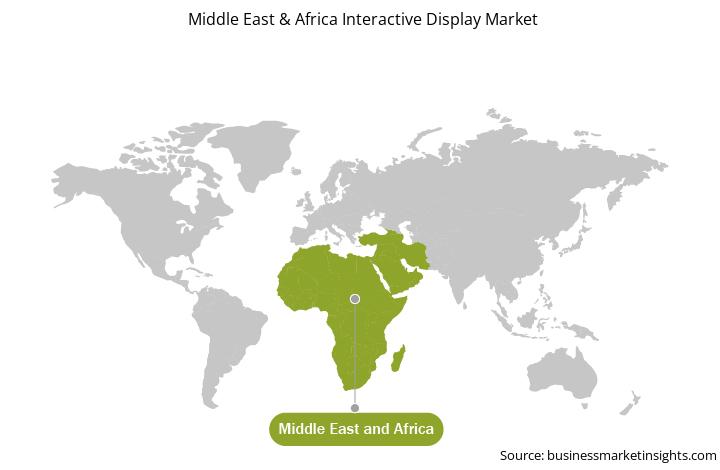
The interactive display market in the Middle East & Africa (MEA) is segmented into South Africa, Saudi Arabia, the UAE, and the Rest of MEA. The market growth in the region is attributed to the growing trend of remote working in South MEA. The governments of the above nations are taking various steps to promote a remote working culture. For instance, in March 2023, the UAE Government launched a new HR initiative to expand the idea of remote work by allowing government employees to work from public libraries. This program aims to give workers greater flexibility in their work schedules and encourage a culture of remote work.

The region is also witnessing tremendous growth in the healthcare sector. Saudi Arabia accounts for ~60% of the total healthcare expenditure of the Gulf Cooperation Council (GCC) countries. As per the International Trade Administration of the US Department of Commerce, Saudi Arabia announced an investment of US$ 36.8 billion in healthcare and social development in 2022-i.e., 14.4% of its 2022 budget. Furthermore, the Saudi Arabian government is planning to invest ~US$ 65 billion to construct a well-developed healthcare infrastructure by 2030. Thus, government initiatives such as encouraging the adoption of remote work and growing investment in the healthcare sector are expected to boost the interactive display market growth in the MEA.
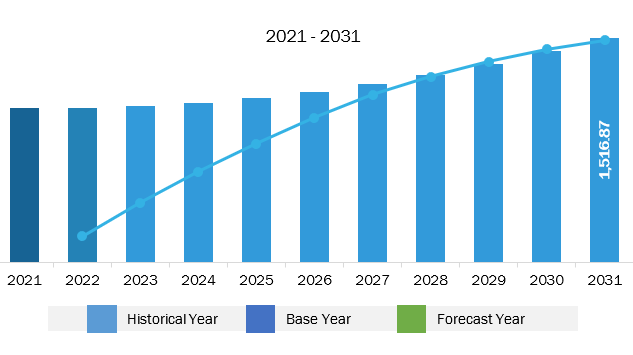
Middle East & Africa Interactive Display Market Revenue and Forecast to 2031 (US$ Million)

Middle East & Africa Interactive Display Market Revenue and Forecast to 2031 (US$ Million)

Get more information on this report :

Middle East & Africa Interactive Display Market Segmentation

The Middle East & Africa Interactive Display Market is categorized into product, panel size, panel type, industry vertical, and country.

Based on product, the Middle East & Africa interactive display market is segmented into interactive kiosks, interactive whiteboards, interactive tables, interactive video walls, and interactive monitors. The interactive kiosks segment held the largest share of Middle East & Africa interactive display market share in 2023.

In terms of panel size, the Middle East & Africa interactive display market is segmented into 17-32 inches, 32-65 inches, and above 65 inches. The above 65 inches segment held the largest share of Middle East & Africa interactive display market in 2023.

By panel type, the Middle East & Africa interactive display market is divided into flat, flexible, and transparent. The flat segment held the largest share of Middle East & Africa interactive display market in 2023.

Based on industry vertical, the Middle East & Africa interactive display market is categorized into retail & hospitality, healthcare, BFSI, education, entertainment, and others. The education segment held the largest share of Middle East & Africa interactive display market in 2023.

By country, the Middle East & Africa interactive display market is segmented into South Africa, Saudi Arabia, the UAE, and the Rest of Middle East & Africa. The UAE dominated the UAE interactive display market share in 2023.

Samsung Electronics Co Ltd, PROMETHEAN LIMITED, LG Electronics Inc, BOE Technology Group Co Ltd, Panasonic Holdings Corp, Sharp Electronics Corp, Hitachi Ltd, BenQ Corporation, SMART TECHNOLOGIES ULC, and ViewSonic Corporation are some of the leading companies operating in the Middle East & Africa interactive display market.
 

TABLE OF CONTENTS


1. Introduction

1.1 The Insight Partners Research Report Guidance

1.2 Market Segmentation

2. Executive Summary

2.1 Key Insights

2.2 Market Attractiveness

3. Research Methodology

3.1 Secondary Research

3.2 Primary Research

3.2.1 Hypothesis formulation:

3.2.2 Macro-economic factor analysis:

3.2.3 Developing base number:

3.2.4 Data Triangulation:

3.2.5 Country level data:

4. Interactive Display Market Landscape

4.1 Overview

4.2 Ecosystem Analysis

5. Middle East & Africa Interactive Display Market - Key Market Dynamics

5.1 Market Drivers

5.1.1 Rising Demand for Smart Learning

5.1.2 Increasing Need for Effective Collaboration

5.2 Market Restraints

5.2.1 High Initial and Maintenance Cost

5.3 Market Opportunities

5.3.1 Development of Next-Generation Interactive Display

5.3.2 Increasing Adoption of Touchscreen Tables

5.4 Future Trends

5.4.1 Growing Demand for Interactive Retail Display

5.5 Impact of Drivers and Restraints:

6. Interactive Display Market - Middle East & Africa Analysis

6.1 Overview

6.2 Interactive Display Market Revenue (US$ Million), 2021-2031

6.3 Interactive Display Market Forecast Analysis

7. Middle East & Africa Interactive Display Market Analysis - by Product

7.1 Interactive Kiosks

7.1.1 Overview

7.1.2 Interactive Kiosks: Interactive Display Market - Revenue and Forecast to 2031 (US$ Million)

7.2 Interactive Whiteboards

7.2.1 Overview

7.2.2 Interactive Whiteboards: Interactive Display Market - Revenue and Forecast to 2031 (US$ Million)

7.3 Interactive Tables

7.3.1 Overview

7.3.2 Interactive Tables: Interactive Display Market - Revenue and Forecast to 2031 (US$ Million)

7.4 Interactive Video Walls

7.4.1 Overview

7.4.2 Interactive Video Walls: Interactive Display Market - Revenue and Forecast to 2031 (US$ Million)

7.5 Interactive Monitors

7.5.1 Overview

7.5.2 Interactive Monitors: Interactive Display Market - Revenue and Forecast to 2031 (US$ Million)

8. Middle East & Africa Interactive Display Market Analysis - by Panel Size

8.1 17-32 Inches

8.1.1 Overview

8.1.2 17-32 Inches: Interactive Display Market - Revenue and Forecast to 2031 (US$ Million)

8.2 32-65 Inches

8.2.1 Overview

8.2.2 32-65 Inches: Interactive Display Market - Revenue and Forecast to 2031 (US$ Million)

8.3 Above 65 Inches

8.3.1 Overview

8.3.2 Above 65 Inches: Interactive Display Market - Revenue and Forecast to 2031 (US$ Million)

9. Middle East & Africa Interactive Display Market Analysis - by Panel Type

9.1 Flat

9.1.1 Overview

9.1.2 Flat: Interactive Display Market - Revenue and Forecast to 2031 (US$ Million)

9.2 Flexible

9.2.1 Overview

9.2.2 Flexible: Interactive Display Market - Revenue and Forecast to 2031 (US$ Million)

9.3 Transparent

9.3.1 Overview

9.3.2 Transparent: Interactive Display Market - Revenue and Forecast to 2031 (US$ Million)

10. Middle East & Africa Interactive Display Market Analysis - by Industry Vertical

10.1 Retail and Hospitality

10.1.1 Overview

10.1.2 Retail and Hospitality: Interactive Display Market - Revenue and Forecast to 2031 (US$ Million)

10.2 Healthcare

10.2.1 Overview

10.2.2 Healthcare: Interactive Display Market - Revenue and Forecast to 2031 (US$ Million)

10.3 BFSI

10.3.1 Overview

10.3.2 BFSI: Interactive Display Market - Revenue and Forecast to 2031 (US$ Million)

10.4 Education

10.4.1 Overview

10.4.2 Education: Interactive Display Market - Revenue and Forecast to 2031 (US$ Million)

10.5 Entertainment

10.5.1 Overview

10.5.2 Entertainment: Interactive Display Market - Revenue and Forecast to 2031 (US$ Million)

10.6 Others

10.6.1 Overview

10.6.2 Others: Interactive Display Market - Revenue and Forecast to 2031 (US$ Million)

11. Middle East & Africa Interactive Display Market - Country Analysis

11.1 Middle East & Africa Market Overview

11.1.1 Middle East & Africa: Interactive Display Market, By Key Country - Revenue 2023 (US$ Million)

11.1.2 Middle East & Africa: Interactive Display Market - Revenue and Forecast Analysis - by Country

11.1.2.1 Middle East & Africa: Interactive Display Market - Revenue and Forecast Analysis - by Country

11.1.2.2 South Africa: Interactive Display Market - Revenue and Forecast to 2031 (US$ Million)

11.1.2.2.1 South Africa: Interactive Display Market Breakdown by Product

11.1.2.2.2 South Africa: Interactive Display Market Breakdown by Panel Size

11.1.2.2.3 South Africa: Interactive Display Market Breakdown by Panel Type

11.1.2.2.4 South Africa: Interactive Display Market Breakdown by Industry Vertical

11.1.2.3 Saudi Arabia: Interactive Display Market - Revenue and Forecast to 2031 (US$ Million)

11.1.2.3.1 Saudi Arabia: Interactive Display Market Breakdown by Product

11.1.2.3.2 Saudi Arabia: Interactive Display Market Breakdown by Panel Size

11.1.2.3.3 Saudi Arabia: Interactive Display Market Breakdown by Panel Type

11.1.2.3.4 Saudi Arabia: Interactive Display Market Breakdown by Industry Vertical

11.1.2.4 United Arab Emirates: Interactive Display Market - Revenue and Forecast to 2031 (US$ Million)

11.1.2.4.1 United Arab Emirates: Interactive Display Market Breakdown by Product

11.1.2.4.2 United Arab Emirates: Interactive Display Market Breakdown by Panel Size

11.1.2.4.3 United Arab Emirates: Interactive Display Market Breakdown by Panel Type

11.1.2.4.4 United Arab Emirates: Interactive Display Market Breakdown, by Industry Vertical

11.1.2.5 Rest of Middle East & Africa: Interactive Display Market - Revenue and Forecast to 2031 (US$ Million)

11.1.2.5.1 Rest of Middle East & Africa: Interactive Display Market Breakdown by Product

11.1.2.5.2 Rest of Middle East & Africa: Interactive Display Market Breakdown, by Panel Size

11.1.2.5.3 Rest of Middle East & Africa: Interactive Display Market Breakdown, by Panel Type

11.1.2.5.4 Rest of Middle East & Africa: Interactive Display Market Breakdown, by Industry Vertical

12. Competitive Landscape

12.1 Company Positioning & Concentration

13. Industry Landscape

13.1 Overview

13.2 Market Initiative

13.3 Product Development

14. Company Profiles

14.1 Samsung Electronics Co Ltd

14.1.1 Key Facts

14.1.2 Business Description

14.1.3 Products and Services

14.1.4 Financial Overview

14.1.5 SWOT Analysis

14.1.6 Key Developments

14.2 PROMETHEAN LIMITED

14.2.1 Key Facts

14.2.2 Business Description

14.2.3 Products and Services

14.2.4 Financial Overview

14.2.5 SWOT Analysis

14.2.6 Key Developments

14.3 LG Electronics Inc

14.3.1 Key Facts

14.3.2 Business Description

14.3.3 Products and Services

14.3.4 Financial Overview

14.3.5 SWOT Analysis

14.3.6 Key Developments

14.4 BOE Technology Group Co Ltd

14.4.1 Key Facts

14.4.2 Business Description

14.4.3 Products and Services

14.4.4 Financial Overview

14.4.5 SWOT Analysis

14.4.6 Key Developments

14.5 Panasonic Holdings Corp

14.5.1 Key Facts

14.5.2 Business Description

14.5.3 Products and Services

14.5.4 Financial Overview

14.5.5 SWOT Analysis

14.5.6 Key Developments

14.6 Sharp Electronics Corp

14.6.1 Key Facts

14.6.2 Business Description

14.6.3 Products and Services

14.6.4 Financial Overview

14.6.5 SWOT Analysis

14.6.6 Key Developments

14.7 Hitachi Ltd

14.7.1 Key Facts

14.7.2 Business Description

14.7.3 Products and Services

14.7.4 Financial Overview

14.7.5 SWOT Analysis

14.7.6 Key Developments

14.8 BenQ Corporation

14.8.1 Key Facts

14.8.2 Business Description

14.8.3 Products and Services

14.8.4 Financial Overview

14.8.5 SWOT Analysis

14.8.6 Key Developments

14.9 SMART TECHNOLOGIES ULC

14.9.1 Key Facts

14.9.2 Business Description

14.9.3 Products and Services

14.9.4 Financial Overview

14.9.5 SWOT Analysis

14.9.6 Key Developments

14.10 ViewSonic Corporation

14.10.1 Key Facts

14.10.2 Business Description

14.10.3 Products and Services

14.10.4 Financial Overview

14.10.5 SWOT Analysis

14.10.6 Key Developments

15. Appendix

15.1 Word Index

15.2 About the Insight Partners


List of Tables

Table 1. Interactive Display Market Segmentation

Table 2. List of Vendors in the Value Chain:

Table 3. Interactive Display Market - Revenue and Forecast to 2031 (US$ Million)

Table 4. Interactive Display Market - Revenue and Forecast to 2031 (US$ Million) - by Product

Table 5. Interactive Display Market - Revenue and Forecast to 2031 (US$ Million) - by Panel Size

Table 6. Interactive Display Market - Revenue and Forecast to 2031 (US$ Million) - by Panel Type

Table 7. Interactive Display Market - Revenue and Forecast to 2031 (US$ Million) - by Industry Vertical

Table 8. Middle East & Africa: Interactive Display Market - Revenue and Forecast to 2031 (US$ Million) - by Country

Table 9. South Africa: Interactive Display Market - Revenue and Forecast to 2031 (US$ Million) - by Product

Table 10. South Africa: Interactive Display Market - Revenue and Forecast to 2031 (US$ Million) - by Panel Size

Table 11. South Africa: Interactive Display Market - Revenue and Forecast to 2031 (US$ Million) - by Panel Type

Table 12. South Africa: Interactive Display Market - Revenue and Forecast to 2031 (US$ Million) - by Industry Vertical

Table 13. Saudi Arabia: Interactive Display Market - Revenue and Forecast to 2031 (US$ Million) - by Product

Table 14. Saudi Arabia: Interactive Display Market - Revenue and Forecast to 2031 (US$ Million) - by Panel Size

Table 15. Saudi Arabia: Interactive Display Market - Revenue and Forecast to 2031 (US$ Million) - by Panel Type

Table 16. Saudi Arabia: Interactive Display Market - Revenue and Forecast to 2031 (US$ Million) - by Industry Vertical

Table 17. United Arab Emirates: Interactive Display Market - Revenue and Forecast to 2031 (US$ Million) - by Product

Table 18. United Arab Emirates: Interactive Display Market - Revenue and Forecast to 2031 (US$ Million) - by Panel Size

Table 19. United Arab Emirates: Interactive Display Market - Revenue and Forecast to 2031 (US$ Million) - by Panel Type

Table 20. United Arab Emirates: Interactive Display Market - Revenue and Forecast to 2031 (US$ Million) - by Industry Vertical

Table 21. Rest of Middle East & Africa: Interactive Display Market - Revenue and Forecast to 2031 (US$ Million) - by Product

Table 22. Rest of Middle East & Africa: Interactive Display Market - Revenue and Forecast to 2031 (US$ Million) - by Panel Size

Table 23. Rest of Middle East & Africa: Interactive Display Market - Revenue and Forecast to 2031 (US$ Million) - by Panel Type

Table 24. Rest of Middle East & Africa: Interactive Display Market - Revenue and Forecast to 2031 (US$ Million) - by Industry Vertical

Table 25. List of Abbreviation


List of Figures

Figure 1. Interactive Display Market Segmentation, by Country

Figure 2. Interactive Display Market - Key Market Dynamics

Figure 3. Impact Analysis of Drivers and Restraints

Figure 4. Interactive Display Market Revenue (US$ Million), 2021-2031

Figure 5. Interactive Display Market Share (%) - by Product (2023 and 2031)

Figure 6. Interactive Kiosks: Interactive Display Market - Revenue and Forecast to 2031 (US$ Million)

Figure 7. Interactive Whiteboards: Interactive Display Market - Revenue and Forecast to 2031 (US$ Million)

Figure 8. Interactive Tables: Interactive Display Market - Revenue and Forecast to 2031 (US$ Million)

Figure 9. Interactive Video Walls: Interactive Display Market - Revenue and Forecast to 2031 (US$ Million)

Figure 10. Interactive Monitors: Interactive Display Market - Revenue and Forecast to 2031 (US$ Million)

Figure 11. Interactive Display Market Share (%) - by Panel Size (2023 and 2031)

Figure 12. 17-32 Inches: Interactive Display Market - Revenue and Forecast to 2031 (US$ Million)

Figure 13. 32-65 Inches: Interactive Display Market - Revenue and Forecast to 2031 (US$ Million)

Figure 14. Above 65 Inches: Interactive Display Market - Revenue and Forecast to 2031 (US$ Million)

Figure 15. Interactive Display Market Share (%) - by Panel Type (2023 and 2031)

Figure 16. Flat: Interactive Display Market - Revenue and Forecast to 2031 (US$ Million)

Figure 17. Flexible: Interactive Display Market - Revenue and Forecast to 2031 (US$ Million)

Figure 18. Transparent: Interactive Display Market - Revenue and Forecast to 2031 (US$ Million)

Figure 19. Interactive Display Market Share (%) - by Industry Vertical (2023 and 2031)

Figure 20. Retail and Hospitality: Interactive Display Market - Revenue and Forecast to 2031 (US$ Million)

Figure 21. Healthcare: Interactive Display Market - Revenue and Forecast to 2031 (US$ Million)

Figure 22. BFSI: Interactive Display Market - Revenue and Forecast to 2031 (US$ Million)

Figure 23. Education: Interactive Display Market - Revenue and Forecast to 2031 (US$ Million)

Figure 24. Entertainment: Interactive Display Market - Revenue and Forecast to 2031 (US$ Million)

Figure 25. Others: Interactive Display Market - Revenue and Forecast to 2031 (US$ Million)

Figure 26. Middle East & Africa: Interactive Display Market, By Key Country - Revenue 2023 (US$ Million)

Figure 27. Middle East & Africa: Interactive Display Market Breakdown, by Key Countries, 2023 and 2031 (%)

Figure 28. South Africa: Interactive Display Market - Revenue and Forecast to 2031 (US$ Million)

Figure 29. Saudi Arabia: Interactive Display Market - Revenue and Forecast to 2031 (US$ Million)

Figure 30. United Arab Emirates: Interactive Display Market - Revenue and Forecast to 2031 (US$ Million)

Figure 31. Rest of Middle East & Africa: Interactive Display Market - Revenue and Forecast to 2031 (US$ Million)

Figure 32. Company Positioning & Concentration


  1. Samsung Electronics Co Ltd
  2. PROMETHEAN LIMITED
  3. LG Electronics Inc
  4. BOE Technology Group Co Ltd
  5. Panasonic Holdings Corp
  6. Sharp Electronics Corp
  7. Hitachi Ltd
  8. BenQ Corporation
  9. SMART TECHNOLOGIES ULC
  10. ViewSonic Corporation
  • Save and reduce time carrying out entry-level research by identifying the growth, size, leading players, and segments in the Middle East & Africa interactive display market.
  • Highlights key business priorities to assist companies to realign their business strategies.
  • The key findings and recommendations highlight crucial progressive industry trends in the Middle East & Africa interactive display market, thereby allowing players across the value chain to develop effective long-term strategies.
  • Develop/modify business expansion plans by using substantial growth offering developed and emerging markets.
  • Scrutinize in-depth Middle East & Africa market trends and outlook coupled with the factors driving the Middle East & Africa interactive display market, as well as those hindering it.
  • Enhance the decision-making process by understanding the strategies that underpin commercial interest with respect to client products, segmentation, pricing, and distribution.
Report Code
Full Name
Country Name
Email Id
Phone Number
Job Title
Company
Requirement

Note : Your data will never be shared with third parties, however, we may send you information from time to time about our products that may be of interest to you. By submitting your details, you agree to be contacted by us. You may contact us at any time to opt-out.


Purchase Options
Single User License
$3550
$2485
Site License
$4550
$3185
Enterprise License
$5550
$3885