Middle East and Africa 3D Display Market Forecast to 2028 - COVID-19 Impact and Regional Analysis By Type (Stereoscopic 3D Display and Autostereoscopic 3D Display), Technology (Digital Light Processing, Organic Light Emitting Diode, and Light Emitting Diode), and Application (Consumer Electronics, Automotive, Medical, Advertising, Retail, Military and Defense, and Others)
Market Introduction
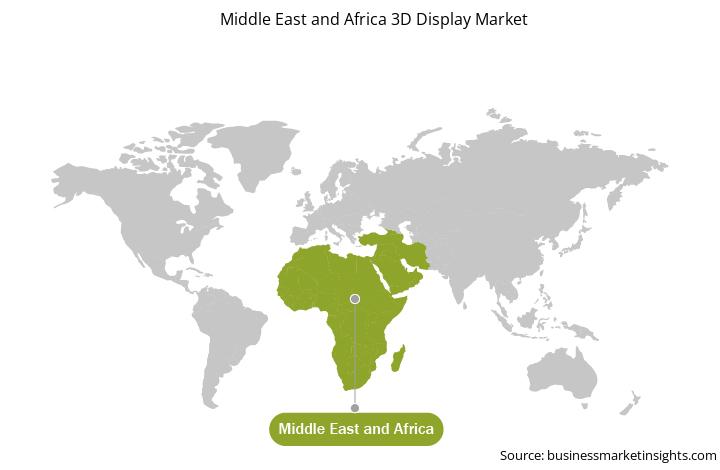
The 3D display market in the MEA is further segmented into South Africa, Saudi Arabia, and the UAE. The swift growth of the advertisements, automotive, and consumer electronics industries in the region is attributed to factors, such as robust economic growth, strong consumer demand in Gulf countries, and high spending potential. The region is also expected to see a rapid rise in marketing and industrialization, which would further propel the growth of diverse industries. The Gulf countries are economically advanced, while the African countries still have to balance their economic conditions. Digital signage is quite popular in the region; these screens are mostly found in transportation systems, museums, public spaces, stadiums, retail stores, hotels, and corporate buildings. Digital signage as the advertising medium has observed increased demand in the MEA due to the presence of numerous major retailers. The region is implementing 3D displays to enhance viewer experience. For instance, in October 2018, Hypervsn introduced 3D holographic display platform in the UAE, which enables 3D visuals to appear as floating in the mid-air for advanced visual marketing on digital signage and out-of-home ads. Also, huge impact of latest 3D display technologies in end-user sectors is expected to fuel the demand for 3D displays in MEA.
In the MEA, Turkey has recorded the highest number of COVID-19 cases. Other countries facing the economic impact of COVID-19 are Iran, South Africa, Israel, Iraq, Morocco, Saudi Arabia, and the UAE. The UAE and Saudi Arabia are potential markets for 3D display providers owing to the huge presence of a diverse customer base for the automotive and consumer electronics industries. In addition, factory and business shutdowns, and travel bans are further aggravating the economic problems of countries in the MEA. Hence, a decline in the region’s economic condition and the restrictive effects of COVID-19 on various industries are expected to limit the growth of 3D display market in this region.
Get more information on this report :
Market Overview and Dynamics
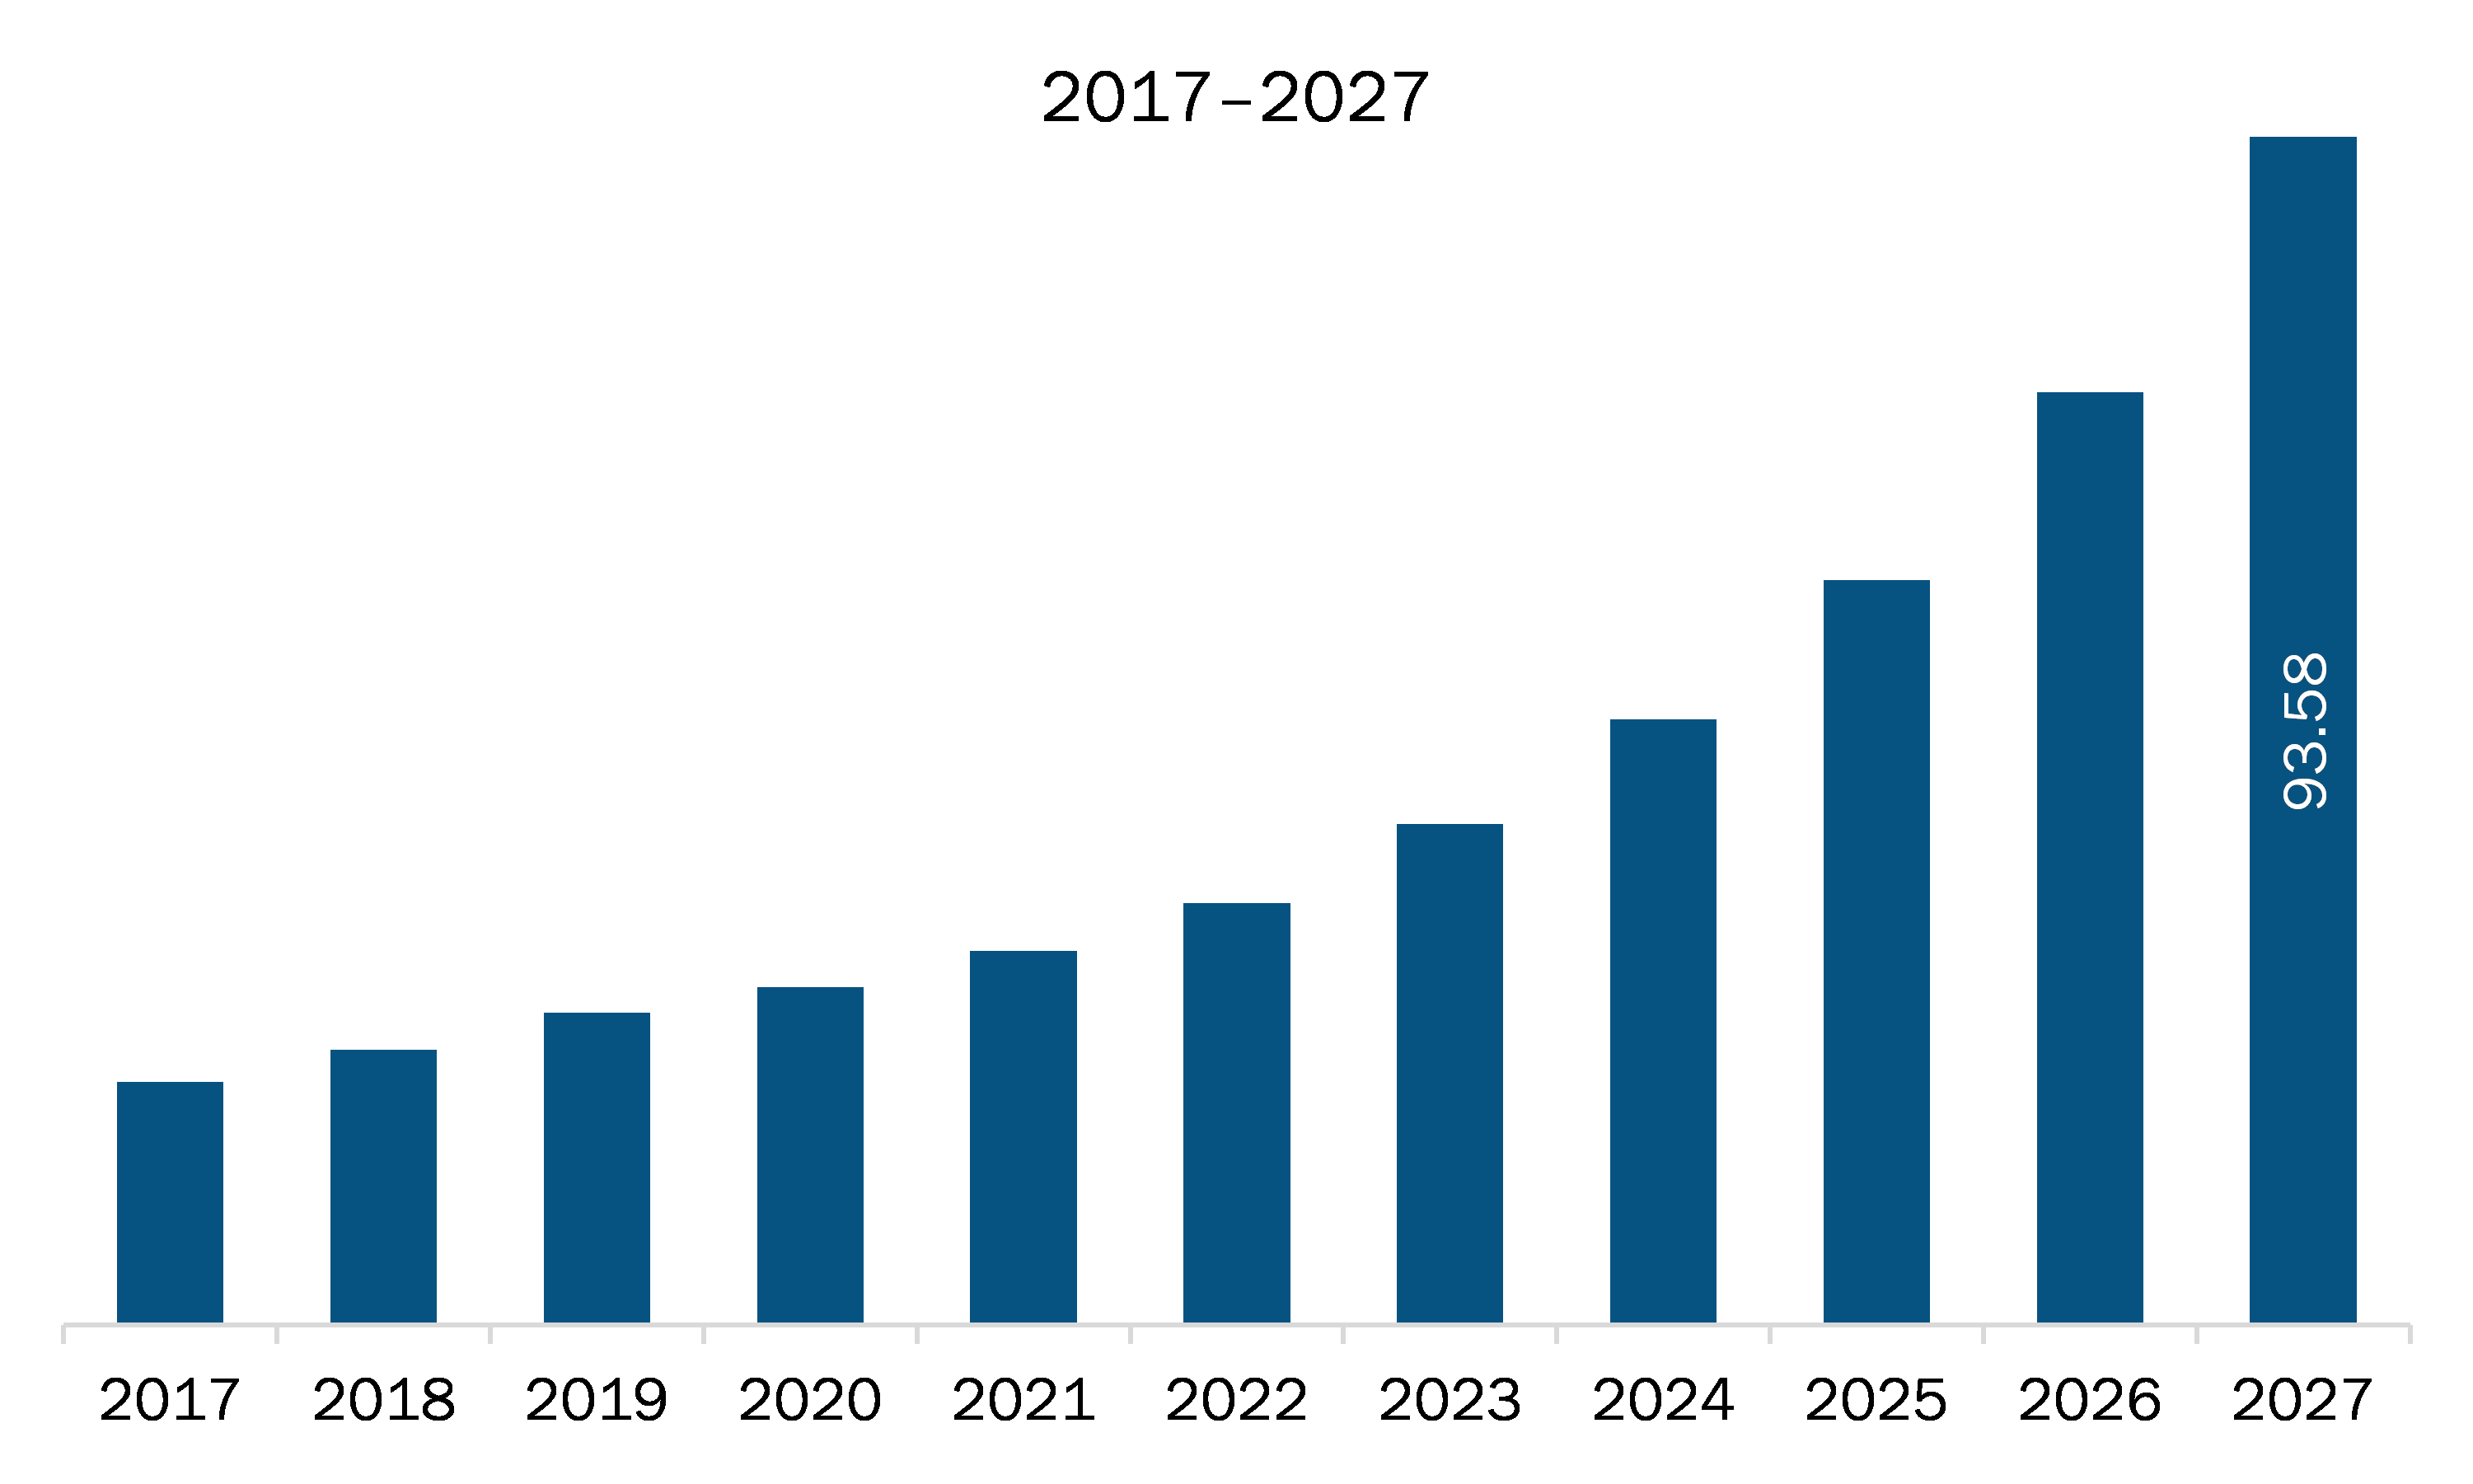
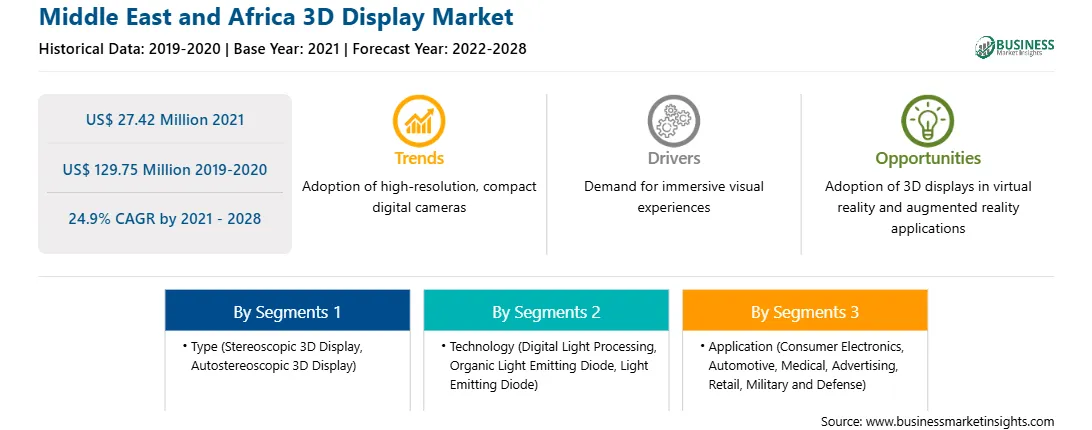
The 3D display market in the MEA is expected to grow from US$ 27.42 million in 2021 to US$ 129.75 million by 2028; it is estimated to grow at a CAGR of 24.9% from 2021 to 2028. As consumer electronics giants such as Samsung, LG electronics, Sharp, Toshiba, Panasonic, HTC, and Nintendo launched consumer electronic goods such as 3D TVs, cell phones, game consoles, notebooks, and displays, the consumer electronics segment of the 3D display industry prospered in the early years of the previous decade. However, growing public health issues related to the use of special headgear and active 3D glasses, along with the high cost of the device, have slowed market growth. Consumer electronics giants are now developing 3D display technology without glasses and hologram display technology to speed up the pace of the 3D display market.
Key Market Segments
The MEA 3D display market is segmented into type, technology, application, and country. Based on type, the MEA 3D display market is segmented into stereoscopic 3D display and autostereoscopic 3D display. Autostereoscopic 3D display segment held the largest market share in 2020. Based on technology, the 3D display market is divided into digital light processing, organic light emitting diode, and light emitting diode. Digital light processing segment held the largest market share in 2020. Based on application, the MEA 3D display market is divided into consumer electronics, automobile, medical, advertising, retail, military and defense, and others. Advertising segment held the largest market share in 2020. Based on country the MEA 3D display market is segmented into Saudi Arabia, South Africa, UAE, and rest of MEA. UAE held the largest market share in 2020.
Major Sources and Companies Listed
A few major primary and secondary sources referred to for preparing this report on the 3D display market in MEA are company websites, annual reports, financial reports, national government documents, and statistical database, among others. Major companies listed in the report are AU Optronics Corp., BOE Technology Group, Fujifilm Corporation, Innolux Corporation, Leia Inc., LG Electronics Inc., Looking Glass Factory Inc., Mitsubishi Electric Corporation, Panasonic Corporation, Samsung Electronics Co. Ltd., Sharp Corporation, and Toshiba Corporation.
Reasons to buy report
- To understand the MEA 3D display market landscape and identify market segments that are most likely to guarantee a strong return
- Stay ahead of the race by comprehending the ever-changing competitive landscape for MEA 3D display market
- Efficiently plan M&A and partnership deals in MEA 3D display market by identifying market segments with the most promising probable sales
- Helps to take knowledgeable business decisions from perceptive and comprehensive analysis of market performance of various segment form MEA 3D display market
- Obtain market revenue forecast for market by various segments from 2021-2028 in MEA region.
MEA 3D Display Market Segmentation
MEA 3D Display Market - By Type
- Stereoscopic 3D Display
- Autostereoscopic 3D Display
MEA 3D Display Market - By Technology
- Digital Light Processing
- Organic Light Emitting Diode
- Light Emitting Diode
MEA 3D Display Market - By Application
- Consumer Electronics
- Automotive
- Medical
- Advertising
- Retail
- Military and Defense
- Others
MEA 3D Display Market, By Country
- South Africa
- Saudi Arabia
- UAE
- Rest of MEA
MEA 3D Display Market - Company Profiles
- AU Optronics Corp.
- BOE Technology Group
- Fujifilm Corporation
- Innolux Corporation
- LG Electronics Inc.
- Looking Glass Factory Inc
- Mitsubishi Electric Corporation
- Panasonic Corporation
- Samsung Group
- Sharp Corporation
- Toshiba Corporation
1. Introduction
1.1 Study Scope
1.2 The Insight Partners Research Report Guidance
1.3 Market Segmentation
2. Key Takeaways
3. Research Methodology
3.1 Coverage
3.2 Secondary Research
3.3 Primary Research
4. MEA 3D Display Market Landscape
4.1 Market Overview
4.2 MEA PEST Analysis
4.3 Ecosystem Analysis
4.4 Expert Opinion
5. 3D Display Market – MEA Analysis
5.1 MEA 3D Display Market Overview
5.2 MEA 3D Display Market – Revenue and Forecast to 2028 (US$ Million)
6. MEA 3D Display Market – Key Market Dynamics
6.1 Market Drivers
6.1.1 Huge Impact of Latest 3D Display Technologies in End-User Sectors
6.2 Market Restraints
6.2.1 High Manufacturing Cost Associated with 3D Display Technologies
6.3 Market Opportunities
6.3.1 Significant Rise in Industry Partnerships to Enhance Demand
6.4 Future Trends
6.4.1 Growth Encouragement Owing to Advancements in Holographic 3D Display Systems
6.5 Impact Analysis of Drivers and Restraints
7. MEA 3D Display Market Analysis– By Type
7.1 Overview
7.2 MEA 3D Display Market, by Type (2020 and 2028)
7.3 Stereoscopic 3D Display
7.3.1 Overview
7.3.2 Stereoscopic 3D Display: 3D Display Market – Revenue and Forecast to 2028 (US$ Million)
7.4 Autostereoscopic 3D Display
7.4.1 Overview
7.4.2 Autostereoscopic 3D Display: 3D Display Market – Revenue and Forecast to 2028 (US$ Million)
8. MEA 3D Display Market Analysis – By Technology
8.1 Overview
8.2 MEA 3D Display Market, by Technology (2020 and 2028)
8.3 Digital Light Processing
8.3.1 Overview
8.3.2 Digital Light Processing: 3D Display Market – Revenue and Forecast to 2028 (US$ Million)
8.4 Organic Light Emitting Diode
8.4.1 Overview
8.4.2 Organic Light Emitting Diode: 3D Display Market – Revenue and Forecast to 2028 (US$ Million)
8.5 Light Emitting Diode
8.5.1 Overview
8.5.2 Light Emitting Diode: 3D Display Market – Revenue and Forecast to 2028 (US$ Million)
9. MEA 3D Display Market Analysis – By Application
9.1 Overview
9.2 MEA 3D Display Market, by Application (2020 and 2028)
9.3 Consumer electronics
9.3.1 Overview
9.3.2 Consumer Electronics: 3D Display Market – Revenue and Forecast to 2028 (US$ Million)
9.4 Automotive
9.4.1 Overview
9.4.2 Automotive: 3D Display Market – Revenue and Forecast to 2028 (US$ Million)
9.5 Medical
9.5.1 Overview
9.5.2 Medical: 3D Display Market – Revenue and Forecast to 2028 (US$ Million)
9.6 Advertising
9.6.1 Overview
9.6.2 Advertising: 3D Display Market – Revenue and Forecast to 2028 (US$ Million)
9.7 Retail
9.7.1 Overview
9.7.2 Retail: 3D Display Market – Revenue and Forecast to 2028 (US$ Million)
9.8 Military & Defense
9.8.1 Overview
9.8.2 Military & Defense: 3D Display Market – Revenue and Forecast to 2028 (US$ Million)
9.9 Other Applications
9.9.1 Overview
9.9.2 Other Applications: 3D Display Market – Revenue and Forecast to 2028 (US$ Million)
10. MEA 3D Display Market – Country Analysis
10.1 Overview
10.1.1 MEA: 3D Display Market, by Key Country
10.1.1.1 South Africa: 3D Display Market – Revenue and Forecast to 2028 (US$ Million)
10.1.1.1.1 South Africa: 3D Display Market, by Type
10.1.1.1.2 South Africa: 3D Display Market, by Technology
10.1.1.1.3 South Africa: 3D Display Market, by Application
10.1.1.2 Saudi Arabia: 3D Display Market – Revenue and Forecast to 2028 (US$ Million)
10.1.1.2.1 Saudi Arabia: 3D Display Market, by Type
10.1.1.2.2 Saudi Arabia: 3D Display Market, by Technology
10.1.1.2.3 Saudi Arabia: 3D Display Market, by Application
10.1.1.3 UAE: 3D Display Market – Revenue and Forecast to 2028 (US$ Million)
10.1.1.3.1 UAE: 3D Display Market, by Type
10.1.1.3.2 UAE: 3D Display Market, by Technology
10.1.1.3.3 UAE: 3D Display Market, by Application
10.1.1.4 Rest of MEA: 3D Display Market – Revenue and Forecast to 2028 (US$ Million)
10.1.1.4.1 Rest of MEA: 3D Display Market, by Type
10.1.1.4.2 Rest of MEA: 3D Display Market, by Technology
10.1.1.4.3 Rest of MEA: 3D Display Market, by Application
11. MEA 3D Display Market- Impact Analysis of COVID-19
11.1 MEA
12. Industry Landscape
12.1 Market Developments
13. Company Profiles
13.1 AU OPTRONICS CORP.
13.1.1 Key Facts
13.1.2 Business Description
13.1.3 Products and Services
13.1.4 Financial Overview
13.1.5 SWOT Analysis
13.1.6 Key Developments
13.2 Innolux Corporation
13.2.1 Key Facts
13.2.2 Business Description
13.2.3 Products and Services
13.2.4 Financial Overview
13.2.5 SWOT Analysis
13.2.6 Key Developments
13.3 LG Electronics
13.3.1 Key Facts
13.3.2 Business Description
13.3.3 Products and Services
13.3.4 Financial Overview
13.3.5 SWOT Analysis
13.3.6 Key Developments
13.4 Mitsubishi Electric Corporation
13.4.1 Key Facts
13.4.2 Business Description
13.4.3 Products and Services
13.4.4 Financial Overview
13.4.5 SWOT Analysis
13.4.6 Key Developments
13.5 Panasonic Corporation
13.5.1 Key Facts
13.5.2 Business Description
13.5.3 Products and Services
13.5.4 Financial Overview
13.5.5 SWOT Analysis
13.5.6 Key Developments
13.6 Samsung Group
13.6.1 Key Facts
13.6.2 Business Description
13.6.3 Products and Services
13.6.4 Financial Overview
13.6.5 SWOT Analysis
13.6.6 Key Developments
13.7 Sharp Corporation
13.7.1 Key Facts
13.7.2 Business Description
13.7.3 Products and Services
13.7.4 Financial Overview
13.7.5 SWOT Analysis
13.7.6 Key Developments
13.8 Looking Glass Factory Inc.
13.8.1 Key Facts
13.8.2 Business Description
13.8.3 Products and Services
13.8.4 Financial Overview
13.8.5 SWOT Analysis
13.8.6 Key Developments
13.9 Toshiba Corporation
13.9.1 Key Facts
13.9.2 Business Description
13.9.3 Products and Services
13.9.4 Financial Overview
13.9.5 SWOT Analysis
13.9.6 Key Developments
13.10 Fujifilm Corporation
13.10.1 Key Facts
13.10.2 Business Description
13.10.3 Products and Services
13.10.4 Financial Overview
13.10.5 SWOT Analysis
13.10.6 Key Developments
13.11 BOE Technology Group
13.11.1 Key Facts
13.11.2 Business Description
13.11.3 Products and Services
13.11.4 Financial Overview
13.11.5 SWOT Analysis
13.11.6 Key Developments
14. Appendix
14.1 About The Insight Partners
14.2 Word Index
LIST OF TABLES
Table 1. MEA 3D Display Market – Revenue and Forecast to 2028 (US$ Million)
Table 2. South Africa: 3D Display Market, by Type – Revenue and Forecast to 2028 (US$ Million)
Table 3. South Africa: 3D Display Market, by Technology – Revenue and Forecast to 2028 (US$ Million)
Table 4. South Africa: 3D Display Market, by Application – Revenue and Forecast to 2028 (US$ Million)
Table 5. Saudi Arabia: 3D Display Market, by Type – Revenue and Forecast to 2028 (US$ Million)
Table 6. Saudi Arabia: 3D Display Market, by Technology – Revenue and Forecast to 2028 (US$ Million)
Table 7. Saudi Arabia: 3D Display Market, by Application – Revenue and Forecast to 2028 (US$ Million)
Table 8. UAE: 3D Display Market, by Type – Revenue and Forecast to 2028 (US$ Million)
Table 9. UAE: 3D Display Market, by Technology – Revenue and Forecast to 2028 (US$ Million)
Table 10. UAE: 3D Display Market, by Application – Revenue and Forecast to 2028 (US$ Million)
Table 11. Rest of MEA: 3D Display Market, by Type – Revenue and Forecast to 2028 (US$ Million)
Table 12. Rest of MEA: 3D Display Market, by Technology – Revenue and Forecast to 2028 (US$ Million)
Table 13. Rest of MEA: 3D Display Market, by Application – Revenue and Forecast to 2028 (US$ Million)
Table 14. List of Abbreviation
LIST OF FIGURES
Figure 1. MEA 3D Display Market Segmentation
Figure 2. MEA 3D Display Market Segmentation – By Country
Figure 3. MEA 3D Display Market Overview
Figure 4. Autostereoscopic 3D display segment Held the Largest Share During Forecast Period
Figure 5. Digital Light Processing Segment Held the Largest Share During Forecast Period
Figure 6. Advertising segment Held the Largest Share During Forecast Period
Figure 7. MEA 3D Display Market, Country Analysis
Figure 8. MEA: PEST Analysis
Figure 9. MEA 3D Display Market– Ecosystem Analysis
Figure 10. Expert Opinion
Figure 11. MEA 3D Display Market – Revenue and Forecast to 2028 (US$ Million)
Figure 12. MEA 3D Display Market: Impact Analysis of Drivers and Restraints
Figure 13. MEA 3D Display Market Revenue Share, by Type (2020 and 2028)
Figure 14. MEA Stereoscopic 3D Display: 3D Display Market – Revenue and Forecast to 2028 (US$ Million)
Figure 15. MEA Autostereoscopic 3D Display: 3D Display Market – Revenue and Forecast to 2028 (US$ Million)
Figure 16. MEA 3D Display Market Revenue Share, by Technology (2020 and 2028)
Figure 17. MEA Digital Light Processing: 3D Display Market – Revenue and Forecast to 2028 (US$ Million)
Figure 18. MEA Organic Light Emitting Diode: 3D Display Market– Revenue and Forecast to 2028 (US$ Million)
Figure 19. MEA Light Emitting Diode: 3D Display Market – Revenue and Forecast to 2028 (US$ Million)
Figure 20. MEA 3D Display Market Revenue Share, by Application (2020 and 2028)
Figure 21. MEA Consumer Electronics: 3D Display Market – Revenue and Forecast to 2028 (US$ Million)
Figure 22. MEA Automotive: 3D Display Market – Revenue and Forecast to 2028 (US$ Million)
Figure 23. MEA Medical: 3D Display Market – Revenue and Forecast to 2028 (US$ Million)
Figure 24. MEA Advertising: 3D Display Market – Revenue and Forecast to 2028 (US$ Million)
Figure 25. MEA Retail: 3D Display Market – Revenue and Forecast to 2028 (US$ Million)
Figure 26. MEA Military & Defense: 3D Display Market – Revenue and Forecast to 2028 (US$ Million)
Figure 27. MEA Others: 3D Display Market – Revenue and Forecast to 2028 (US$ Million)
Figure 28. MEA: 3D Display Market, by Key Country – Revenue (2020) (US$ Million)
Figure 29. MEA: 3D Display Market Revenue Share, by Key Country (2020 and 2028)
Figure 30. South Africa: 3D Display Market – Revenue and Forecast to 2028 (US$ Million)
Figure 31. Saudi Arabia: 3D Display Market – Revenue and Forecast to 2028 (US$ Million)
Figure 32. UAE: 3D Display Market – Revenue and Forecast to 2028 (US$ Million)
Figure 33. Rest of MEA: 3D Display Market – Revenue and Forecast to 2028 (US$ Million)
Figure 34. Impact of COVID-19 Pandemic in MEA Country Markets
- AU Optronics Corp.
- BOE Technology Group
- Fujifilm Corporation
- Innolux Corporation
- LG Electronics Inc.
- Looking Glass Factory Inc
- Mitsubishi Electric Corporation
- Panasonic Corporation
- Samsung Group
- Sharp Corporation
- Toshiba Corporation
- Save and reduce time carrying out entry-level research by identifying the growth, size, leading players, and segments in the MEA 3D display market
- Highlights key business priorities in order to assist companies to realign their business strategies
- The key findings and recommendations highlight crucial progressive industry trends in the MEA 3D display market, thereby allowing players across the value chain to develop effective long-term strategies
- Develop/modify business expansion plans by using substantial growth offering developed and emerging markets
- Scrutinize in-depth MEA market trends and outlook coupled with the factors driving the 3D display market, as well as those hindering it
- Enhance the decision-making process by understanding the strategies that underpin commercial interest with respect to client products, segmentation, pricing and distribution