Europe Revenue Assurance Market Forecast to 2030 - Regional Analysis - by Component (Solution and Services), Deployment (On-Premise and Cloud-Based), Organization Size (SMEs and Large Enterprises), and Vertical (BFSI, Hospitality, Telecom, Utilities, and Others)

BMIRE00030429 | Pages: 100 | Technology, Media and Telecommunications | Jul 2024 | Type: Regional | Status: Published

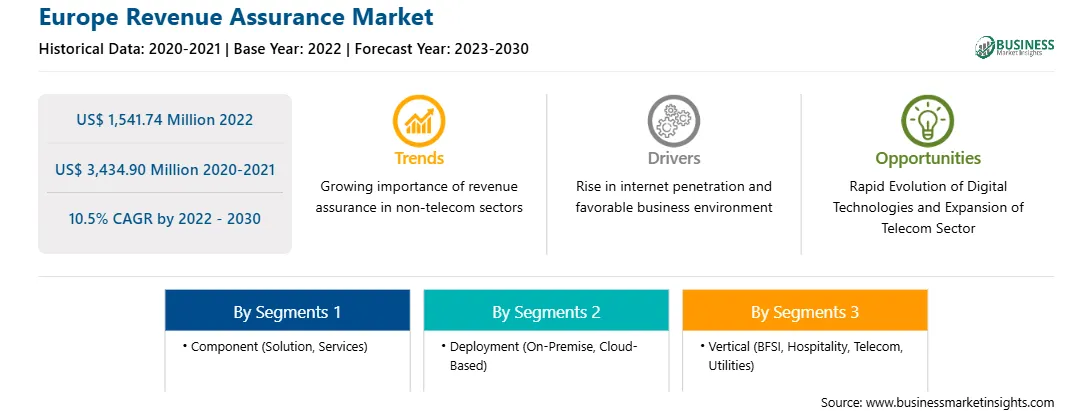
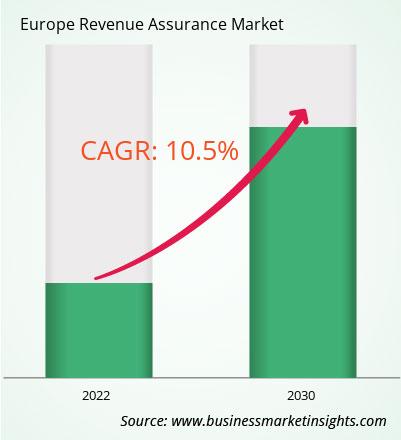
The Europe revenue assurance market was valued at US$ 1,541.74 million in 2022 and is expected to reach US$ 3,434.90 million by 2030; it is estimated to record a CAGR of 10.5% from 2022 to 2030.

Rise in Internet Penetration Drives Europe Revenue Assurance Market

As internet usage continues to grow, more businesses are conducting their operations online, leading to an increase in the generation of digital transactions and revenue streams. According to World Bank data, globally, the number of individuals using the Internet in 2021 was 63%, an increase from 60% in 2020. With more people accessing the Internet, more digital transactions are taking place. This includes online purchases, digital payments, and other online financial activities. The larger the volume of transactions, the greater the need for effective revenue assurance measures to ensure accurate billing, prevent revenue leakages, and detect fraudulent activities. Moreover, the rise in internet penetration has fueled the growth of the e-commerce industry. Online retail platforms and marketplaces are experiencing increased activity, with more businesses and consumers participating in online buying and selling. Revenue assurance is crucial in ensuring accurate revenue recognition, managing inventory, and preventing revenue leakages in e-commerce. There is a significant increase in the use of mobile internet. As more people access the Internet through their mobile devices, there is a need for revenue assurance solutions that can effectively monitor and manage revenue streams from mobile services, such as mobile data, voice calls, and value-added services. Hence, the rising internet penetration is a significant driver for the revenue assurance market.

Europe Revenue Assurance Market Overview

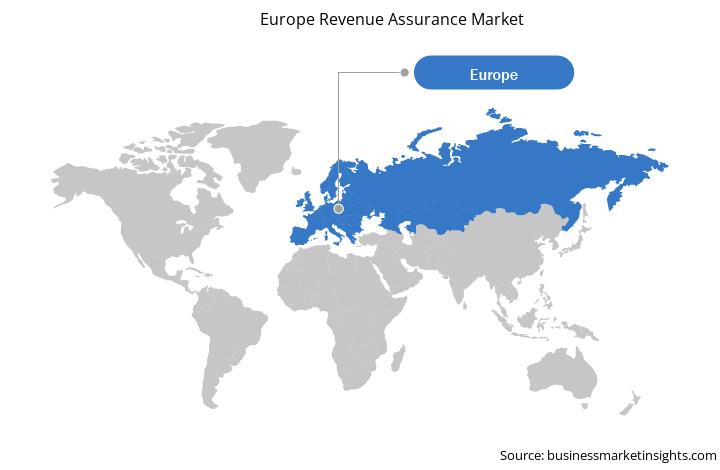
The Europe revenue assurance market is segmented into Germany, France, Italy, the UK, Russia, and the Rest of Europe. The Rest of Europe market is further segmented into Spain, Switzerland, the Netherlands, and Denmark. These countries are technologically advanced, and the governments of the countries mentioned above continuously invest substantial amounts in adopting robust and enhanced technologies. The revenue assurance market is experiencing significant growth in Europe, driven by factors such as rising instances of revenue leakage. Increased complexity in business models and service offerings, coupled with evolving technologies, creates more opportunities for revenue to slip through the cracks. Companies are recognizing the need for robust assurance solutions. Further, the UK businesses estimate that 5.87% of revenues remain uncollected each year, equating to US$ 263 billion in annual losses.

Several companies in Europe are engaged in strategies for the implementation of revenue assurance services. For instance, in May 2021, Global Message Services (GMS), an international messaging service provider and one of the pioneers in A2P, P2P, and P2A messaging and monetization, inked a partnership with leading telecom security solutions provider Cellusys to offer the highest degree of A2P revenue assurance through comprehensive SMS security and control. The integrated solution with onboard analytics improves the quality of service and protects mobile network operators against SMS fraud and revenue leakage in messaging.

An increase in telecommunication activity in Europe can potentially offer significant benefits to the revenue assurance market. With more users subscribing to diverse services such as 5G, IoT, cloud computing, and advanced data packages, telecom operators grapple with intricate billing systems and contracts.

This complexity creates more opportunities for errors and revenue leakage, hence requiring robust revenue assurance solutions. Moreover, emerging technologies such as artificial intelligence (AI) and machine learning (ML) can automate time-consuming tasks and provide real-time insights into potential revenue leaks. This improves the efficiency and effectiveness of revenue assurance practices. Thus, owing to the above factors, such as the rise in revenue leakage, the rising implementation of revenue assurance, and the increasing telecom industry, the revenue assurance market in Europe is propelling.

Europe Revenue Assurance Market Revenue and Forecast to 2030 (US$ Million)

Europe Revenue Assurance Market Revenue and Forecast to 2030 (US$ Million)

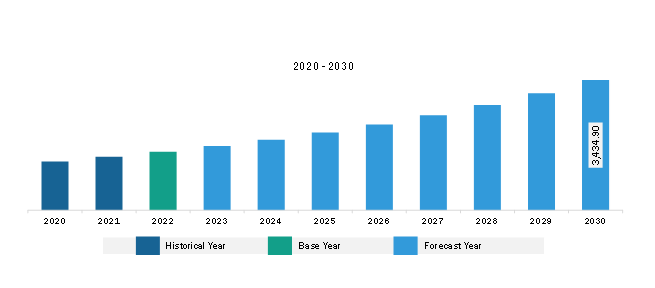
Get more information on this report :

Europe Revenue Assurance Market Segmentation

The Europe revenue assurance market is categorized into components, deployment, organization size, vertical, and country.

Based on component, the Europe revenue assurance market is bifurcated into solution and services. The solution segment held a larger market share in 2022.

Based on deployment, the Europe revenue assurance market is bifurcated into on-premises and cloud-based. The cloud-based segment held a larger market share in 2022.

Based on organization size, the Europe revenue assurance market is bifurcated into SMEs and large enterprises. The large enterprises segment held a larger market share in 2022.

Based on vertical, the Europe revenue assurance market is categorized into BFSI, hospitality, telecom, utilities, and others. The telecom segment held the largest market share in 2022.

By country, the Europe revenue assurance market is segmented into the Germany, France, Italy, the UK, Russia, and the Rest of Europe. The UK dominated the Europe revenue assurance market share in 2022.

Cartesian Inc, Nokia Corp, Tata Consultancy Services Ltd, Amdocs, Subex Ltd, LATRO Services Inc, Araxxe SAS, Panamax Inc, and Adapt IT Holdings Proprietary Ltd are some of the leading companies operating in the Europe revenue assurance market.

TABLE OF CONTENTS


1. Introduction

1.1 The Insight Partners Research Report Guidance

1.2 Market Segmentation

2. Executive Summary

2.1 Key Insights

2.2 Market Attractiveness

3. Research Methodology

3.1 Coverage

3.2 Secondary Research

3.3 Primary Research

4. Revenue Assurance Market Landscape

4.1 Overview

4.2 PEST Analysis

4.3 Ecosystem Analysis

4.3.1 Solution Providers:

4.3.2 Service Providers

4.3.3 End Users:

4.3.4 List of Vendors in the Value Chain

5. Europe Revenue Assurance Market - Key Market Dynamics

5.1 Drivers

5.1.1 Rise in Internet Penetration

5.1.2 Favorable Business Environment

5.2 Restraints

5.2.1 Lack of Awareness and Understanding of Revenue Assurance

5.2.2 Organizational Management Issues

5.3 Opportunity

5.3.1 Rapid Evolution of Digital Technologies

5.4 Future Trends

5.4.1 Growing Importance of Revenue Assurance in Non-Telecom Sectors

5.5 Impact of Drivers and Restraints:

6. Revenue Assurance Market - Europe Market Analysis

6.1 Revenue Assurance Market Revenue (US$ Million), 2020-2030

6.2 Revenue Assurance Market Forecast Analysis

7. Europe Revenue Assurance Market Analysis - by Component

7.1 Solution

7.1.1 Overview

7.1.2 Solution: Revenue Assurance Market - Revenue and Forecast to 2030 (US$ Million)

7.2 Services

7.2.1 Overview

7.2.2 Services: Revenue Assurance Market - Revenue and Forecast to 2030 (US$ Million)

8. Europe Revenue Assurance Market Analysis - by Deployment

8.1 On-premise

8.1.1 Overview

8.1.2 On-premise: Revenue Assurance Market - Revenue and Forecast to 2030 (US$ Million)

8.2 Cloud-based

8.2.1 Overview

8.2.2 Cloud-based: Revenue Assurance Market - Revenue and Forecast to 2030 (US$ Million)

9. Europe Revenue Assurance Market Analysis - by Organization Size

9.1 SMEs

9.1.1 Overview

9.1.2 SMEs: Revenue Assurance Market - Revenue and Forecast to 2030 (US$ Million)

9.2 Large Enterprises

9.2.1 Overview

9.2.2 Large Enterprises: Revenue Assurance Market - Revenue and Forecast to 2030 (US$ Million)

10. Europe Revenue Assurance Market Analysis - by Vertical

10.1 BFSI

10.1.1 Overview

10.1.2 BFSI: Revenue Assurance Market - Revenue and Forecast to 2030 (US$ Million)

10.2 Hospitality

10.2.1 Overview

10.2.2 Hospitality: Revenue Assurance Market - Revenue and Forecast to 2030 (US$ Million)

10.3 Telecom

10.3.1 Overview

10.3.2 Telecom: Revenue Assurance Market - Revenue and Forecast to 2030 (US$ Million)

10.4 Utilities

10.4.1 Overview

10.4.2 Utilities: Revenue Assurance Market - Revenue and Forecast to 2030 (US$ Million)

10.5 Others

10.5.1 Overview

10.5.2 Others: Revenue Assurance Market - Revenue and Forecast to 2030 (US$ Million)

11. Europe Revenue Assurance Market - Country Analysis

11.1 Europe Revenue Assurance Market Overview

11.1.1 Europe: Revenue Assurance Market - Revenue and Forecast Analysis - by Country

11.1.1.1 Europe: Revenue Assurance Market - Revenue and Forecast Analysis - by Country

11.1.1.2 Germany: Revenue Assurance Market - Revenue and Forecast to 2030 (US$ Million)

11.1.1.2.1 Germany: Revenue Assurance Market Breakdown, by Component

11.1.1.2.2 Germany: Revenue Assurance Market Breakdown, by Deployment

11.1.1.2.3 Germany: Revenue Assurance Market Breakdown, by Organization Size

11.1.1.2.4 Germany: Revenue Assurance Market Breakdown, by Vertical

11.1.1.3 France: Revenue Assurance Market - Revenue and Forecast to 2030 (US$ Million)

11.1.1.3.1 France: Revenue Assurance Market Breakdown, by Component

11.1.1.3.2 France: Revenue Assurance Market Breakdown, by Deployment

11.1.1.3.3 France: Revenue Assurance Market Breakdown, by Organization Size

11.1.1.3.4 France: Revenue Assurance Market Breakdown, by Vertical

11.1.1.4 Italy: Revenue Assurance Market - Revenue and Forecast to 2030 (US$ Million)

11.1.1.4.1 Italy: Revenue Assurance Market Breakdown, by Component

11.1.1.4.2 Italy: Revenue Assurance Market Breakdown, by Deployment

11.1.1.4.3 Italy: Revenue Assurance Market Breakdown, by Organization Size

11.1.1.4.4 Italy: Revenue Assurance Market Breakdown, by Vertical

11.1.1.5 United Kingdom: Revenue Assurance Market - Revenue and Forecast to 2030 (US$ Million)

11.1.1.5.1 United Kingdom: Revenue Assurance Market Breakdown, by Component

11.1.1.5.2 United Kingdom: Revenue Assurance Market Breakdown, by Deployment

11.1.1.5.3 United Kingdom: Revenue Assurance Market Breakdown, by Organization Size

11.1.1.5.4 United Kingdom: Revenue Assurance Market Breakdown, by Vertical

11.1.1.6 Russia: Revenue Assurance Market - Revenue and Forecast to 2030 (US$ Million)

11.1.1.6.1 Russia: Revenue Assurance Market Breakdown, by Component

11.1.1.6.2 Russia: Revenue Assurance Market Breakdown, by Deployment

11.1.1.6.3 Russia: Revenue Assurance Market Breakdown, by Organization Size

11.1.1.6.4 Russia: Revenue Assurance Market Breakdown, by Vertical

11.1.1.7 Rest of Europe: Revenue Assurance Market - Revenue and Forecast to 2030 (US$ Million)

11.1.1.7.1 Rest of Europe: Revenue Assurance Market Breakdown, by Component

11.1.1.7.2 Rest of Europe: Revenue Assurance Market Breakdown, by Deployment

11.1.1.7.3 Rest of Europe: Revenue Assurance Market Breakdown, by Organization Size

11.1.1.7.4 Rest of Europe: Revenue Assurance Market Breakdown, by Vertical

12. Competitive Landscape

12.1 Heat Map Analysis by Key Players

12.2 Company Positioning & Concentration

13. Industry Landscape

13.1 Overview

13.2 Market Initiative

13.3 Mergers & Acquisitions

14. Company Profiles

14.1 Cartesian, Inc

14.1.1 Key Facts

14.1.2 Business Description

14.1.3 Products and Services

14.1.4 Financial Overview

14.1.5 SWOT Analysis

14.1.6 Key Developments

14.2 Nokia Corp

14.2.1 Key Facts

14.2.2 Business Description

14.2.3 Products and Services

14.2.4 Financial Overview

14.2.5 SWOT Analysis

14.2.6 Key Developments

14.3 Tata Consultancy Services Ltd

14.3.1 Key Facts

14.3.2 Business Description

14.3.3 Products and Services

14.3.4 Financial Overview

14.3.5 SWOT Analysis

14.3.6 Key Developments

14.4 Amdocs Ltd

14.4.1 Key Facts

14.4.2 Business Description

14.4.3 Products and Services

14.4.4 Financial Overview

14.4.5 SWOT Analysis

14.4.6 Key Developments

14.5 Subex Ltd

14.5.1 Key Facts

14.5.2 Business Description

14.5.3 Products and Services

14.5.4 Financial Overview

14.5.5 SWOT Analysis

14.5.6 Key Developments

14.6 Araxxe SAS

14.6.1 Key Facts

14.6.2 Business Description

14.6.3 Products and Services

14.6.4 Financial Overview

14.6.5 SWOT Analysis

14.6.6 Key Developments

14.7 Panamax Inc

14.7.1 Key Facts

14.7.2 Business Description

14.7.3 Products and Services

14.7.4 Financial Overview

14.7.5 SWOT Analysis

14.7.6 Key Developments

14.8 Adapt IT Holdings Proprietary Ltd

14.8.1 Key Facts

14.8.2 Business Description

14.8.3 Products and Services

14.8.4 Financial Overview

14.8.5 SWOT Analysis

14.8.6 Key Developments

14.9 LATRO Services Inc

14.9.1 Key Facts

14.9.2 Business Description

14.9.3 Products and Services

14.9.4 Financial Overview

14.9.5 SWOT Analysis

14.9.6 Key Developments

15. Appendix

15.1 About The Insight Partners

15.2 Word Index

List of Tables

Table 1. Revenue Assurance Market Segmentation

Table 2. List of Vendors

Table 3. Revenue Assurance Market - Revenue and Forecast to 2030 (US$ Million)

Table 4. Revenue Assurance Market - Revenue and Forecast to 2030 (US$ Million) - by Component

Table 5. Revenue Assurance Market - Revenue and Forecast to 2030 (US$ Million) - by Deployment

Table 6. Revenue Assurance Market - Revenue and Forecast to 2030 (US$ Million) - by Organization Size

Table 7. Revenue Assurance Market - Revenue and Forecast to 2030 (US$ Million) - by Vertical

Table 8. Europe: Revenue Assurance Market - Revenue and Forecast to 2030(US$ Million) - by Country

Table 9. Germany: Revenue Assurance Market - Revenue and Forecast to 2030(US$ Million) - by Component

Table 10. Germany: Revenue Assurance Market - Revenue and Forecast to 2030(US$ Million) - by Deployment

Table 11. Germany: Revenue Assurance Market - Revenue and Forecast to 2030(US$ Million) - by Organization Size

Table 12. Germany: Revenue Assurance Market - Revenue and Forecast to 2030(US$ Million) - by Vertical

Table 13. France: Revenue Assurance Market - Revenue and Forecast to 2030(US$ Million) - by Component

Table 14. France: Revenue Assurance Market - Revenue and Forecast to 2030(US$ Million) - by Deployment

Table 15. France: Revenue Assurance Market - Revenue and Forecast to 2030(US$ Million) - by Organization Size

Table 16. France: Revenue Assurance Market - Revenue and Forecast to 2030(US$ Million) - by Vertical

Table 17. Italy: Revenue Assurance Market - Revenue and Forecast to 2030(US$ Million) - by Component

Table 18. Italy: Revenue Assurance Market - Revenue and Forecast to 2030(US$ Million) - by Deployment

Table 19. Italy: Revenue Assurance Market - Revenue and Forecast to 2030(US$ Million) - by Organization Size

Table 20. Italy: Revenue Assurance Market - Revenue and Forecast to 2030(US$ Million) - by Vertical

Table 21. United Kingdom: Revenue Assurance Market - Revenue and Forecast to 2030(US$ Million) - by Component

Table 22. United Kingdom: Revenue Assurance Market - Revenue and Forecast to 2030(US$ Million) - by Deployment

Table 23. United Kingdom: Revenue Assurance Market - Revenue and Forecast to 2030(US$ Million) - by Organization Size

Table 24. United Kingdom: Revenue Assurance Market - Revenue and Forecast to 2030(US$ Million) - by Vertical

Table 25. Russia: Revenue Assurance Market - Revenue and Forecast to 2030(US$ Million) - by Component

Table 26. Russia: Revenue Assurance Market - Revenue and Forecast to 2030(US$ Million) - by Deployment

Table 27. Russia: Revenue Assurance Market - Revenue and Forecast to 2030(US$ Million) - by Organization Size

Table 28. Russia: Revenue Assurance Market - Revenue and Forecast to 2030(US$ Million) - by Vertical

Table 29. Rest of Europe: Revenue Assurance Market - Revenue and Forecast to 2030(US$ Million) - by Component

Table 30. Rest of Europe: Revenue Assurance Market - Revenue and Forecast to 2030(US$ Million) - by Deployment

Table 31. Rest of Europe: Revenue Assurance Market - Revenue and Forecast to 2030(US$ Million) - by Organization Size

Table 32. Rest of Europe: Revenue Assurance Market - Revenue and Forecast to 2030(US$ Million) - by Vertical

Table 33. Heat Map Analysis

Table 34. List of Abbreviation

List of Figures

Figure 1. Revenue Assurance Market Segmentation, by Country

Figure 2. PEST Analysis

Figure 3. Ecosystem Analysis

Figure 4. Revenue Assurance Market - Key Market Dynamics

Figure 5. Impact Analysis of Drivers and Restraints

Figure 6. Revenue Assurance Market Revenue (US$ Million), 2020-2030

Figure 7. Revenue Assurance Market Share (%) - by Component (2022 and 2030)

Figure 8. Solution: Revenue Assurance Market - Revenue and Forecast to 2030 (US$ Million)

Figure 9. Services: Revenue Assurance Market - Revenue and Forecast to 2030 (US$ Million)

Figure 10. Revenue Assurance Market Share (%) - by Deployment (2022 and 2030)

Figure 11. On-premise: Revenue Assurance Market - Revenue and Forecast to 2030 (US$ Million)

Figure 12. Cloud-based: Revenue Assurance Market - Revenue and Forecast to 2030 (US$ Million)

Figure 13. Revenue Assurance Market Share (%) - by Organization Size (2022 and 2030)

Figure 14. SMEs: Revenue Assurance Market - Revenue and Forecast to 2030 (US$ Million)

Figure 15. Large Enterprises: Revenue Assurance Market - Revenue and Forecast to 2030 (US$ Million)

Figure 16. Revenue Assurance Market Share (%) - by Vertical (2022 and 2030)

Figure 17. BFSI: Revenue Assurance Market - Revenue and Forecast to 2030 (US$ Million)

Figure 18. Hospitality: Revenue Assurance Market - Revenue and Forecast to 2030 (US$ Million)

Figure 19. Telecom: Revenue Assurance Market - Revenue and Forecast to 2030 (US$ Million)

Figure 20. Utilities: Revenue Assurance Market - Revenue and Forecast to 2030 (US$ Million)

Figure 21. Others: Revenue Assurance Market - Revenue and Forecast to 2030 (US$ Million)

Figure 22. Europe: Revenue Assurance Market, by Key Country - Revenue (2022) (US$ Million)

Figure 23. Europe: Revenue Assurance Market Breakdown, by Key Countries, 2022 and 2030 (%)

Figure 24. Germany: Revenue Assurance Market - Revenue and Forecast to 2030(US$ Million)

Figure 25. France: Revenue Assurance Market - Revenue and Forecast to 2030(US$ Million)

Figure 26. Italy: Revenue Assurance Market - Revenue and Forecast to 2030(US$ Million)

Figure 27. United Kingdom: Revenue Assurance Market - Revenue and Forecast to 2030(US$ Million)

Figure 28. Russia: Revenue Assurance Market - Revenue and Forecast to 2030(US$ Million)

Figure 29. Rest of Europe: Revenue Assurance Market - Revenue and Forecast to 2030(US$ Million)

Figure 30. Company Positioning & Concentration

1. Cartesian Inc 
2. Nokia Corp 
3. Tata Consultancy Services Ltd 
4. Amdocs 
5. Subex Ltd 
6. LATRO Services Inc 
7. Araxxe SAS 
8. Panamax Inc 
9. Adapt IT Holdings Proprietary Ltd 

  • Save and reduce time carrying out entry-level research by identifying the growth, size, leading players, and segments in the Europe revenue assurance market.
  • Highlights key business priorities in order to assist companies to realign their business strategies.
  • The key findings and recommendations highlight crucial progressive industry trends in the Europe revenue assurance market, thereby allowing players across the value chain to develop effective long-term strategies.
  • Develop/modify business expansion plans by using substantial growth offering developed and emerging markets.
  • Scrutinize in-depth Europe market trends and outlook coupled with the factors driving the Europe revenue assurance market, as well as those hindering it.
  • Enhance the decision-making process by understanding the strategies that underpin commercial interest with respect to client products, segmentation, pricing, and distribution.
Report Code
Full Name
Country Name
Email Id
Phone Number
Job Title
Company
Requirement

Note : Your data will never be shared with third parties, however, we may send you information from time to time about our products that may be of interest to you. By submitting your details, you agree to be contacted by us. You may contact us at any time to opt-out.


Purchase Options
Single User License
$3550
$2840
Site License
$4550
$3640
Enterprise License
$5550
$4440