Europe Diagramming Software Market
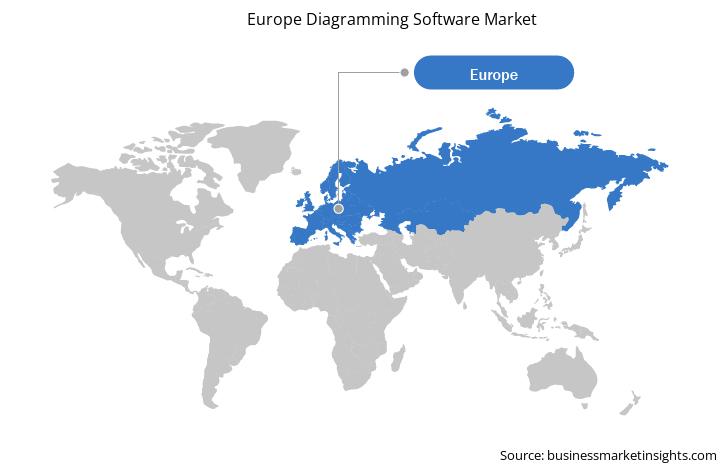
The diagramming software market in Europe is sub segmented into France, Germany, Russia, Italy, the UK, and the Rest of Europe. In comparison with the Nordic and Eastern European countries, western European countries are more developed and technologically advanced. Germany, Norway, Finland, Sweden, the Netherlands, Denmark, Switzerland, and the UK hold a strong position in national tech strength, which contributes to developing advanced technologies and software for industries. This is anticipated to nurture the growth of the diagramming software market. Currently, every organization has departments, wherein the work revolves mostly around PowerPoint presentations and Excel sheets, and the simplest representation of data that could be easily understood in the form of charts and graphs. The need for visual data by large enterprises and SMEs and ease of using the diagramming software are expected to drive the diagramming software market in this region. Companies in the European diagramming software market focus on mergers and acquisitions as major strategies for enhancing their brand value across the world. These players also adopt inorganic growth strategies such as takeovers and partnerships for building business relations with other providers, thereby improving the existing market position. In March 2019, Visirule, a UK-based organization, integrated artificial intelligence with its diagram software platform. Countries in the region have the best management systems, which—coupled with trends prevailing in education institutes and the corporate sector—is fueling the demand for diagramming software, leading to increased deployment of software in the region. Increasing usage of advanced software for learning and rising presence of foreign as well as local students in several countries are propelling the demand for diagramming software in education institutes application. For instance, the UK is a global hub for further education, which creates a huge opportunity to deploy advanced education systems in the country such as diagramming software.
In Europe, the COVID-19 pandemic has a different impact on different countries, as only selective countries have witnessed the rise in the number of COVID-19 cases and subsequently imposed strict and prolonged lockdown and social isolation norms. However, Western European countries such as Germany, France, Russia, and the UK have seen a comparatively modest decrease in their growth activities because of the robust healthcare systems. The sudden COVID-19 outbreak across the region has not only led to the standstill of business operations but have also led to the closure of several small and medium enterprises across the region. Europe experienced a dip in technological investments across the region.

Strategic insights for the Europe Diagramming Software provides data-driven analysis of the industry landscape, including current trends, key players, and regional nuances. These insights offer actionable recommendations, enabling readers to differentiate themselves from competitors by identifying untapped segments or developing unique value propositions. Leveraging data analytics, these insights help industry players anticipate the market shifts, whether investors, manufacturers, or other stakeholders. A future-oriented perspective is essential, helping stakeholders anticipate market shifts and position themselves for long-term success in this dynamic region. Ultimately, effective strategic insights empower readers to make informed decisions that drive profitability and achieve their business objectives within the market.
| Report Attribute | Details |
|---|---|
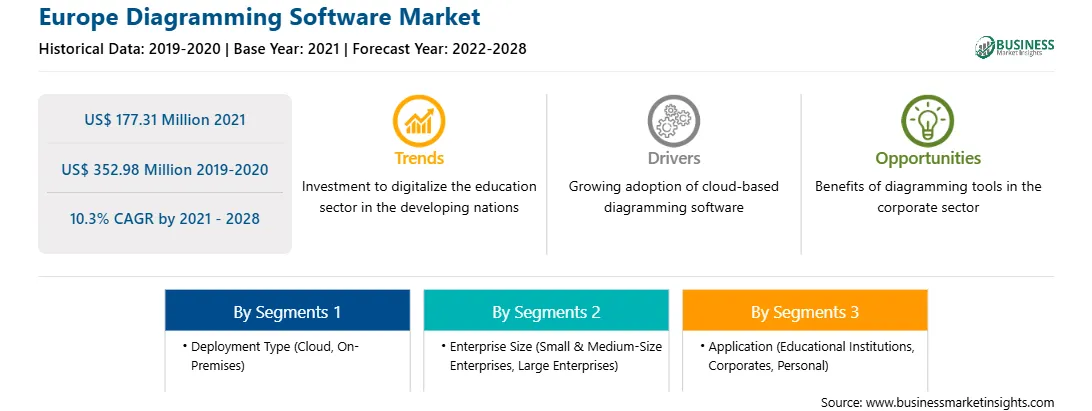
| Market size in 2021 | US$ 177.31 Million |
| Market Size by 2028 | US$ 352.98 Million |
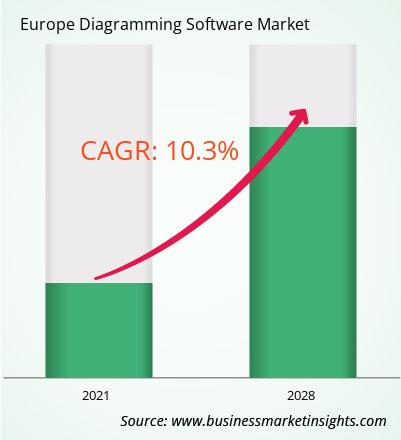
| Global CAGR (2021 - 2028) | 10.3% |
| Historical Data | 2019-2020 |
| Forecast period | 2022-2028 |
| Segments Covered |
By Deployment Type
|
| Regions and Countries Covered | Europe
|
| Market leaders and key company profiles |
The geographic scope of the Europe Diagramming Software refers to the specific areas in which a business operates and competes. Understanding local distinctions, such as diverse consumer preferences (e.g., demand for specific plug types or battery backup durations), varying economic conditions, and regulatory environments, is crucial for tailoring strategies to specific markets. Businesses can expand their reach by identifying underserved areas or adapting their offerings to meet local demands. A clear market focus allows for more effective resource allocation, targeted marketing campaigns, and better positioning against local competitors, ultimately driving growth in those targeted areas.
The diagramming software market in Europe is expected to grow from US$ 177.31 million in 2021 to US$ 352.98 million by 2028; it is estimated to grow at a CAGR of 10.3% from 2021 to 2028. Combination of advanced technologies with diagramming software; automation in documentation and diagramming is being highly adopted across industries to eliminate repetitive human work. Technologies like artificial intelligence (AI) are integrated with diagramming software to automate the creation of flowcharts, organization charts, mapping charts, and workflows. The integration of advanced technologies like AI with diagramming solutions is enabling the automation across both the creation and updating of charts based on pre-entered criteria. For instance, Edrawsoft offers an automatic vector-based org chart maker solution that enables enterprises to create organizational charts in various formats such as basic organization charts, photo organization charts, family trees, custom organization charts, and people organization charts. The solution is integrated with human resource systems, and it automatically makes the charts based on information and designation available on such systems. The solution also updates the information automatically when an employee leaves the organization. These advantages are expected to influence the adoption of technologically advanced diagramming software. Thus, the above-mentioned factors are expected to propel the growth of the Europe diagramming software market over the forecast period. This is bolstering the growth of the diagramming software market.
Based on deployment type, the diagramming software market can be bifurcated into cloud and on-premises. In 2020, the cloud segment held the largest share Europe diagramming software market. Based on enterprise size, the diagramming software market is categorized into small & medium-size enterprises and large enterprises. In 2020, the large enterprises segment held the largest share Europe diagramming software market. Based on application, the diagramming software can be categorized into educational institutions, corporates, and personals. The corporates segment contributed a substantial share in 2020.
A few major primary and secondary sources referred to for preparing this report on the diagramming software market in Europe are company websites, annual reports, financial reports, national government documents, and statistical database, among others. Major companies listed in the report are CREATELY (CINERGIX PTY LTD); DRAW.IO (//SEIBERT/MEDIA GMBH); Edrawsoft; Gliffy (Perforce Software, Inc.); Lucid Software Inc; Microsoft Corporation; Miro; MYDRAW (NEVRON SOFTWARE LLC); Nulab Inc; Samepage.io; and SmartDraw, LLC among others.
The Europe Diagramming Software Market is valued at US$ 177.31 Million in 2021, it is projected to reach US$ 352.98 Million by 2028.
As per our report Europe Diagramming Software Market, the market size is valued at US$ 177.31 Million in 2021, projecting it to reach US$ 352.98 Million by 2028. This translates to a CAGR of approximately 10.3% during the forecast period.
The Europe Diagramming Software Market report typically cover these key segments-
The historic period, base year, and forecast period can vary slightly depending on the specific market research report. However, for the Europe Diagramming Software Market report:
The Europe Diagramming Software Market is populated by several key players, each contributing to its growth and innovation. Some of the major players include:
The Europe Diagramming Software Market report is valuable for diverse stakeholders, including:
Essentially, anyone involved in or considering involvement in the Europe Diagramming Software Market value chain can benefit from the information contained in a comprehensive market report.
Office No. 1011, First floor, Farena Corporate Park, Magarpatta-Mundhwa road, Pune - 411028, Maharashtra, India
US:+16467917070
sales@businessmarketinsights.com


 Get Free Sample For Europe Diagramming Software Market
