Asia Pacific Visual Analytics Market
.PNG")
Strategic insights for the Asia Pacific Visual Analytics provides data-driven analysis of the industry landscape, including current trends, key players, and regional nuances. These insights offer actionable recommendations, enabling readers to differentiate themselves from competitors by identifying untapped segments or developing unique value propositions. Leveraging data analytics, these insights help industry players anticipate the market shifts, whether investors, manufacturers, or other stakeholders. A future-oriented perspective is essential, helping stakeholders anticipate market shifts and position themselves for long-term success in this dynamic region. Ultimately, effective strategic insights empower readers to make informed decisions that drive profitability and achieve their business objectives within the market.
| Report Attribute | Details |
|---|---|
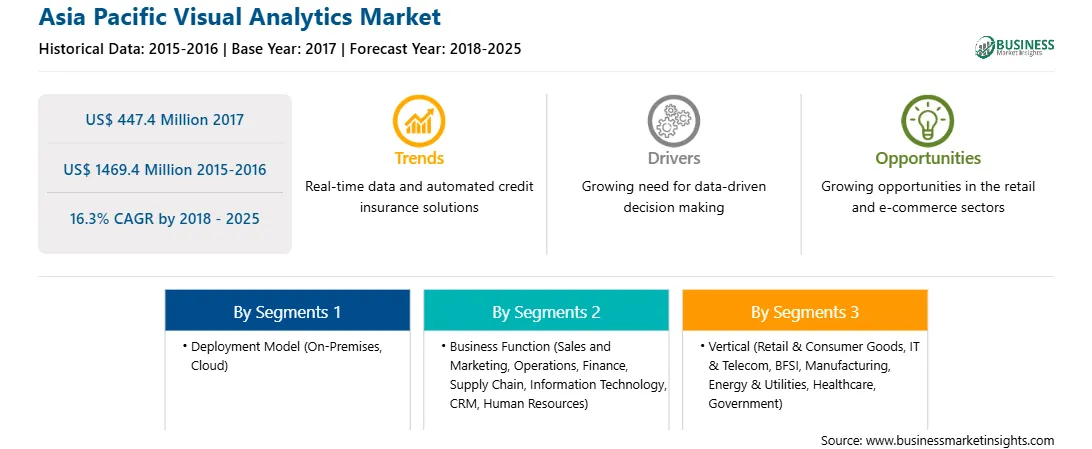
| Market size in 2017 | US$ 447.4 Million |
| Market Size by 2025 | US$ 1469.4 Million |
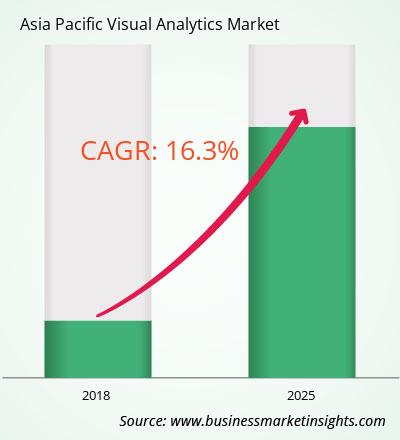
| Global CAGR (2018 - 2025) | 16.3% |
| Historical Data | 2015-2016 |
| Forecast period | 2018-2025 |
| Segments Covered |
By Deployment Model
|
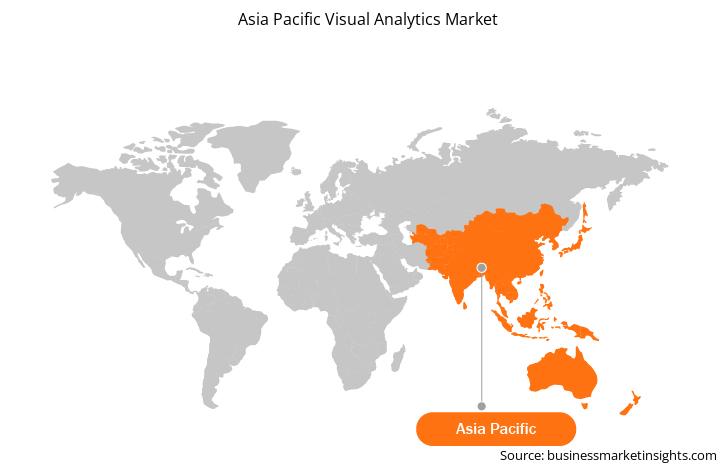
| Regions and Countries Covered | Asia-Pacific
|
| Market leaders and key company profiles |
The geographic scope of the Asia Pacific Visual Analytics refers to the specific areas in which a business operates and competes. Understanding local distinctions, such as diverse consumer preferences (e.g., demand for specific plug types or battery backup durations), varying economic conditions, and regulatory environments, is crucial for tailoring strategies to specific markets. Businesses can expand their reach by identifying underserved areas or adapting their offerings to meet local demands. A clear market focus allows for more effective resource allocation, targeted marketing campaigns, and better positioning against local competitors, ultimately driving growth in those targeted areas.
The List of Companies
The Asia Pacific Visual Analytics Market is valued at US$ 447.4 Million in 2017, it is projected to reach US$ 1469.4 Million by 2025.
As per our report Asia Pacific Visual Analytics Market, the market size is valued at US$ 447.4 Million in 2017, projecting it to reach US$ 1469.4 Million by 2025. This translates to a CAGR of approximately 16.3% during the forecast period.
The Asia Pacific Visual Analytics Market report typically cover these key segments-
The historic period, base year, and forecast period can vary slightly depending on the specific market research report. However, for the Asia Pacific Visual Analytics Market report:
The Asia Pacific Visual Analytics Market is populated by several key players, each contributing to its growth and innovation. Some of the major players include:
The Asia Pacific Visual Analytics Market report is valuable for diverse stakeholders, including:
Essentially, anyone involved in or considering involvement in the Asia Pacific Visual Analytics Market value chain can benefit from the information contained in a comprehensive market report.
Office No. 1011, First floor, Farena Corporate Park, Magarpatta-Mundhwa road, Pune - 411028, Maharashtra, India
US:+16467917070
sales@businessmarketinsights.com


 Get Free Sample For Asia Pacific Visual Analytics Market
