Asia Pacific Vanilla Extract Market
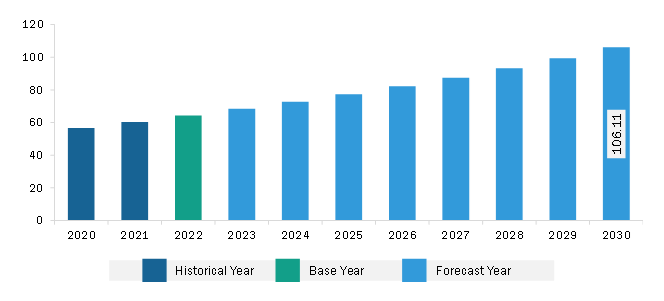
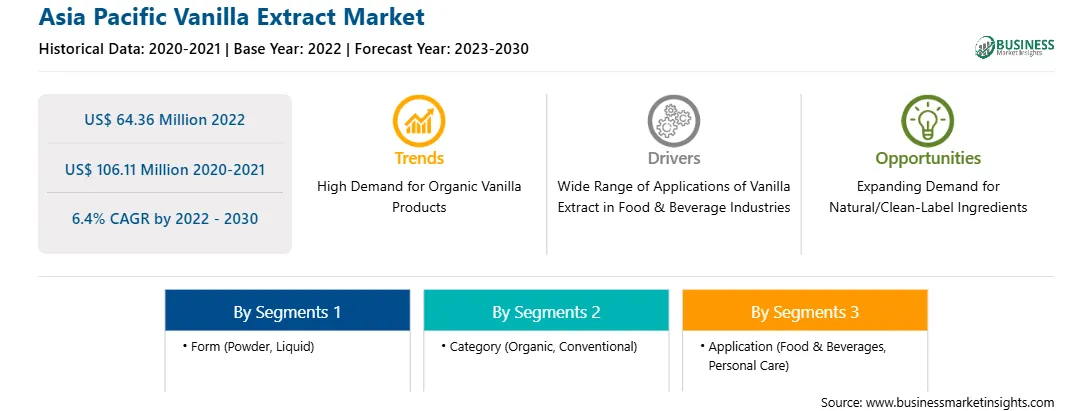
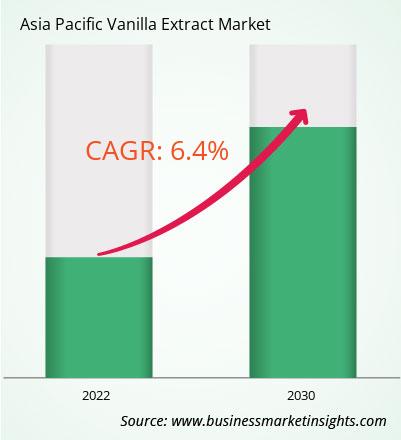
The Asia Pacific vanilla extract market was valued at US$ 64.36 million in 2022 and is expected to reach US$ 106.11 million by 2030; it is estimated to record a CAGR of 6.4% from 2022 to 2030.
Consumers across the world are leaning toward the adoption of a healthier lifestyle. Natural flavors can satisfy consumers' dietary requirements. Descriptions on menus and labels on food packaging highly influence consumer preferences. Clean-label products are becoming increasingly popular as consumers prefer 100% natural products with no synthetic ingredients such as preservatives, artificial colors, flavors, and others.
Consumer demand and international regulations have prompted various application industries to seek active ingredients from natural sources to produce safe and sustainable products. Thus, manufacturers of vanilla extracts expand their product portfolio to fulfil the increasing demand for natural and clean-label ingredients.
Thus, the rising demand for natural and clean-label ingredients is expected to provide lucrative opportunities for the Asia Pacific vanilla extract market during the forecast period.
The Rest of Asia Pacific vanilla extract market is segmented into Singapore, Indonesia, Thailand, Malaysia, and New Zealand, among others. These countries are expected to witness significant growth in the vanilla extract market owing to consumers' growing popularity of natural & organic food products. Singapore, Indonesia, Thailand, and Malaysia are among the few countries famous for aromatic therapies. Many spas, beauty clinics, massage centers, and aromatherapy centers in these countries use essential oils containing vanilla extract that have healing, moisturizing, and soothing properties. Further, the increasing adoption of natural detoxifying cleaners and sanitizers is anticipated to accelerate the demand for vanilla extract.
Strategic insights for the Asia Pacific Vanilla Extract provides data-driven analysis of the industry landscape, including current trends, key players, and regional nuances. These insights offer actionable recommendations, enabling readers to differentiate themselves from competitors by identifying untapped segments or developing unique value propositions. Leveraging data analytics, these insights help industry players anticipate the market shifts, whether investors, manufacturers, or other stakeholders. A future-oriented perspective is essential, helping stakeholders anticipate market shifts and position themselves for long-term success in this dynamic region. Ultimately, effective strategic insights empower readers to make informed decisions that drive profitability and achieve their business objectives within the market.
| Report Attribute | Details |
|---|---|
| Market size in 2022 | US$ 64.36 Million |
| Market Size by 2030 | US$ 106.11 Million |
| Global CAGR (2022 - 2030) | 6.4% |
| Historical Data | 2020-2021 |
| Forecast period | 2023-2030 |
| Segments Covered |
By Form
|
| Regions and Countries Covered | Asia-Pacific
|
| Market leaders and key company profiles |
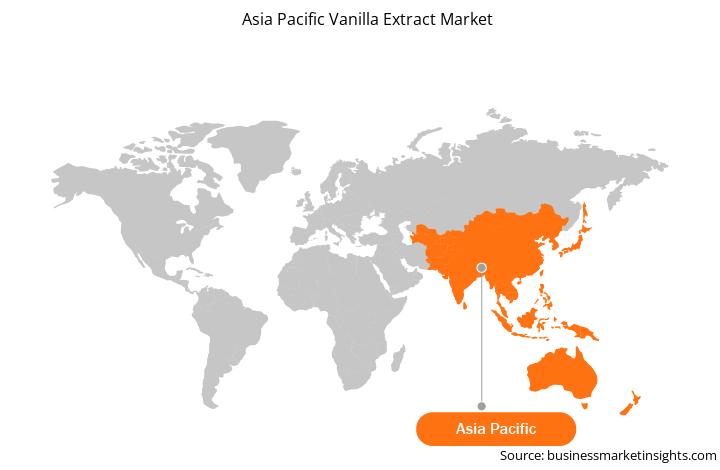
The geographic scope of the Asia Pacific Vanilla Extract refers to the specific areas in which a business operates and competes. Understanding local distinctions, such as diverse consumer preferences (e.g., demand for specific plug types or battery backup durations), varying economic conditions, and regulatory environments, is crucial for tailoring strategies to specific markets. Businesses can expand their reach by identifying underserved areas or adapting their offerings to meet local demands. A clear market focus allows for more effective resource allocation, targeted marketing campaigns, and better positioning against local competitors, ultimately driving growth in those targeted areas.
The Asia Pacific vanilla extract market is segmented based on form, category, application, and country. Based on form, the Asia Pacific vanilla extract market is bifurcated into powder and liquid. The liquid segment held a larger market share in 2022.
In terms of category, the Asia Pacific vanilla extract market is bifurcated into organic and conventional. The conventional segment held a larger market share in 2022.
By application, the Asia Pacific vanilla extract market is categorized into food & beverages, personal care, and others. The food & beverages segment held the largest market share in 2022. Further, food & beverages segment is categorized into bakery & confectionery, dairy & frozen desserts, beverages, sweet & savory snacks, and others.
Based on country, the Asia Pacific vanilla extract market is segmented into China, Japan, India, Australia, South Korea, Southeast Asia, and the Rest of Asia Pacific. The Rest of Asia Pacific dominated the Asia Pacific vanilla extract market share in 2022.
Prova SAS, Tharakan and Co, Natural Vanilla Pty Ltd, Kerry Group Plc, Archer-Daniels-Midland Co, and Synergy Flavors Inc are some of the leading players operating in the Asia Pacific vanilla extract market.
1. Prova SAS
2. Tharakan and Co
3. Natural Vanilla Pty Ltd
4. Kerry Group Plc
5. Archer-Daniels-Midland Co
6. Synergy Flavors Inc
The Asia Pacific Vanilla Extract Market is valued at US$ 64.36 Million in 2022, it is projected to reach US$ 106.11 Million by 2030.
As per our report Asia Pacific Vanilla Extract Market, the market size is valued at US$ 64.36 Million in 2022, projecting it to reach US$ 106.11 Million by 2030. This translates to a CAGR of approximately 6.4% during the forecast period.
The Asia Pacific Vanilla Extract Market report typically cover these key segments-
The historic period, base year, and forecast period can vary slightly depending on the specific market research report. However, for the Asia Pacific Vanilla Extract Market report:
The Asia Pacific Vanilla Extract Market is populated by several key players, each contributing to its growth and innovation. Some of the major players include:
The Asia Pacific Vanilla Extract Market report is valuable for diverse stakeholders, including:
Essentially, anyone involved in or considering involvement in the Asia Pacific Vanilla Extract Market value chain can benefit from the information contained in a comprehensive market report.
Office No. 1011, First floor, Farena Corporate Park, Magarpatta-Mundhwa road, Pune - 411028, Maharashtra, India
US:+16467917070
sales@businessmarketinsights.com


 Get Free Sample For Asia Pacific Vanilla Extract Market
