Asia Pacific Spend Analytics for Electronics and Semiconductor Market Forecast to 2030 - Regional analysis - by Component (Software and Service), Type (Descriptive Analytics, Predictive Analytics, and Prescriptive Analytics), Deployment (On-Premise and Cloud), and Application (Financial Management, Risk Management, Governance and Compliance Management, Supplier Sourcing and Performance Management, Demand and Supply Forecasting, and Others)

BMIRE00030385 | Pages: 96 | Electronics and Semiconductor | Jul 2024 | Type: Regional | Status: Published

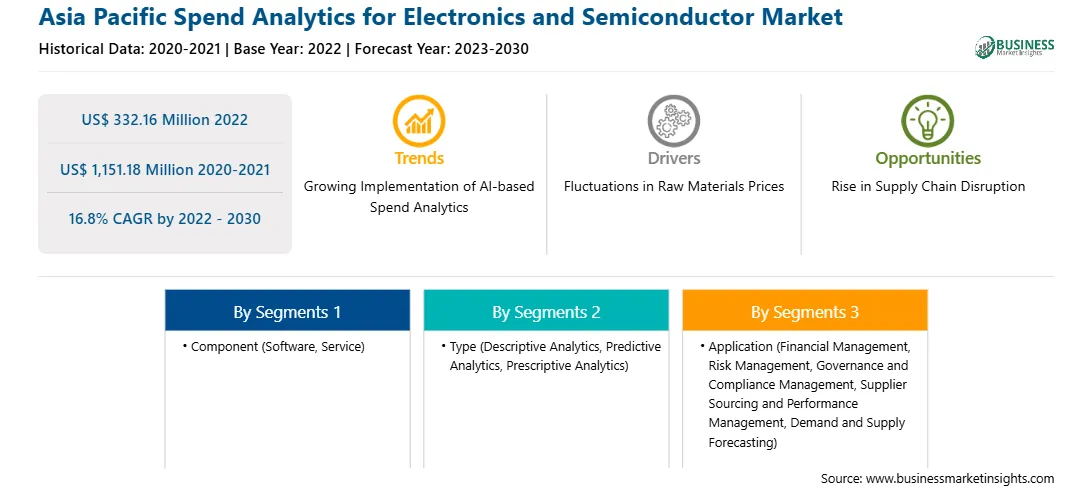
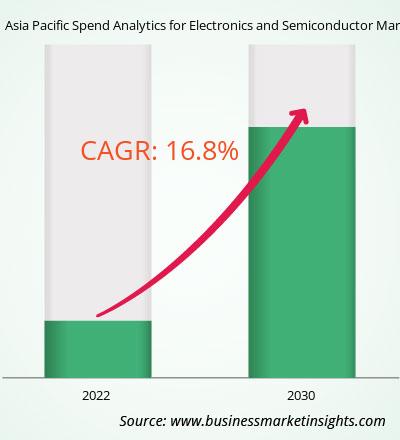
The Asia Pacific spend analytics for electronics and semiconductor market was valued at US$ 332.16 million in 2022 and is expected to reach US$ 1,151.18 million by 2030; it is estimated to register a CAGR of 16.8% from 2022 to 2030.

Incorporation of Miniaturized Electronic Devices Boosts Asia Pacific Spend Analytics for Electronics and Semiconductor Market.

The growing incorporation of miniaturized electronic devices, such as microchips and sensors, necessitates the use of spend analytics in the electronics & semiconductor sector. Companies must effectively manage their expenditures on components, materials, and manufacturing processes to ensure cost-effectiveness. Development in digital electronics, including reduced microprocessor prices, increased memory capacity, improved sensors, and advancements in digital camera pixels, can be attributed to the ongoing trend of miniaturization. Integrated circuits have profoundly impacted the field of electronics, enabling device miniaturization and enhanced functionality. The rising adoption of semiconductor technology, coupled with the need for miniaturization and incorporation of electronic components, has created a demand for spend analytics in the electronics and semiconductor industry. By analyzing their expenditures on components, materials, and manufacturing processes, companies can identify solutions for cost savings, optimize their supply chain, and ensure cost-effectiveness in producing miniaturized electronic devices. Thus, the incorporation of miniaturized electronic devices is expected to create opportunities for the spend analytics for electronics and semiconductor market growth during the forecast period.

Asia Pacific Spend Analytics for Electronics and Semiconductor Market Overview

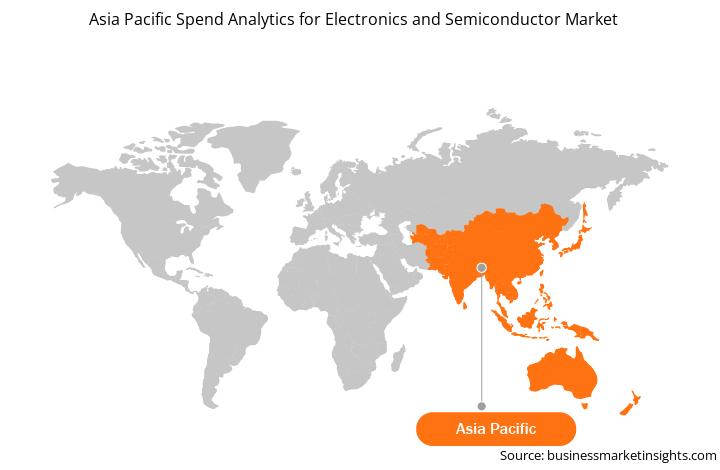
The spend analytics for electronics and semiconductors market in Asia Pacific is projected to experience rapid growth in the coming years. Market progress in this region can be attributed to the increasing acceptance of analytics tools among consumers and businesses. The big data and analytics sector is witnessing significant spending and revenue growth in Asia Pacific. The Asia Pacific region is witnessing a growing demand for spend analytics software, driven by the increased adoption of analytics tools, the growth of the big data and analytics sectors, and the specific needs of industries such as telecommunications, banking, central government, discrete manufacturing, and professional services. China, Japan, and India are at the forefront of spend analytics adoption in the region, driven by data explosion, urbanization, machine learning development, and many MSMEs. Key players in the electronics and semiconductor sector in Asia Pacific include Powerchip Semiconductor Manufacturing (PSMC), Taiwan Semiconductor Manufacturing Company (TSMC), United Microelectronics (UMC), and Vanguard International Semiconductor (VIS).

The adoption of spend analytics enables organizations in the electronics and semiconductor market to optimize purchase processes and make well-informed spending decisions. By analyzing spending patterns, organizations can identify opportunities to reduce costs, effectively manage suppliers, and mitigate risks arising from disruptions in the supply chain. Spend analytics is also valuable in addressing supply chain disruptions, which have become increasingly prevalent in Asia Pacific due to geopolitical threats and other global events. The recent semiconductor shortage that impacted the industry emphasizes the need for improved supply chain management. By closely monitoring and analyzing spending data, organizations can identify alternative suppliers, effectively manage costs, and ensure a stable supply of electronic components and semiconductors.

Asia Pacific Spend Analytics for Electronics and Semiconductor Market Revenue and Forecast to 2030 (US$ Million)

Asia Pacific Spend Analytics for Electronics and Semiconductor Market Revenue and Forecast to 2030 (US$ Million)

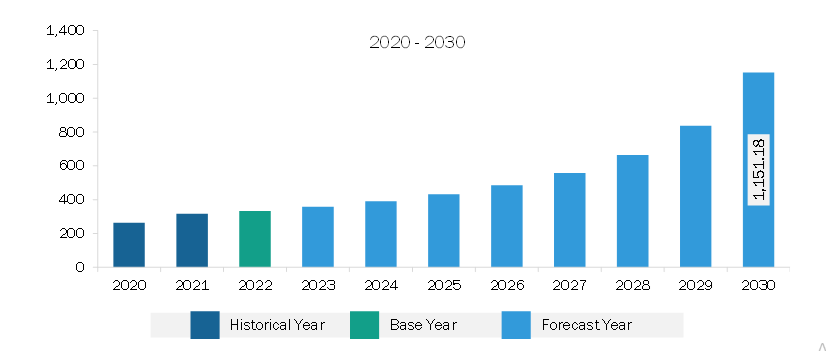
Get more information on this report :

Asia Pacific Spend Analytics for Electronics and Semiconductor Market Segmentation 

The Asia Pacific spend analytics for electronics and semiconductor market is segmented based on component, type, deployment, application, and country. Based on component, the Asia Pacific spend analytics for electronics and semiconductor market is bifurcated into software and services. The software services held a larger market share in 2022.

Based on type, the Asia Pacific spend analytics for electronics and semiconductor market is segmented into descriptive analytics, predictive analytics, and prescriptive analytics. The predictive analytics held the largest market share in 2022.

Based on deployment, the Asia Pacific spend analytics for electronics and semiconductor market is bifurcated into on-premise and cloud. The cloud held a larger market share in 2022.

Based on application, the Asia Pacific spend analytics for electronics and semiconductor market is segmented into financial management, risk management, governance & compliance management, supplier sourcing & performance management, demand & supply forecasting, and others. The supplier sourcing & performance management held the largest market share in 2022.

Based on country, the Asia Pacific spend analytics for electronics and semiconductor market is segmented into Australia, China, India, Japan, South Korea, and the Rest of Asia Pacific. China dominated the Asia Pacific spend analytics for electronics and semiconductor market share in 2022.

Coupa Software Inc, International Business Machines Corp, Ivalua Inc, NB Ventures Inc, SAP SE, Scanmarket AS, Synertrade Inc, and Zycus Inc are some of the leading companies operating in the Asia Pacific spend analytics for electronics and semiconductor market.

TABLE OF CONTENTS


1. Introduction

1.1 The Insight Partners Research Report Guidance

1.2 Market Segmentation

2. Executive Summary

2.1 Key Insights

2.2 Market Attractiveness

3. Research Methodology

3.1 Coverage

3.2 Secondary Research

3.3 Primary Research

4. Asia Pacific Spend Analytics for Electronics and Semiconductor Market Landscape

4.1 Overview

4.2 Ecosystem Analysis

5. Asia Pacific Spend Analytics for Electronics and Semiconductor Market - Key Market Dynamics

5.1 Market Drivers

5.1.1 Fluctuations in Raw Materials Prices

5.1.2 Rise in Demand for Consumer Electronics

5.2 Market Restraints

5.2.1 Technological Complexity

5.3 Market Opportunities

5.3.1 Rise in Supply Chain Disruption

5.3.2 Incorporation of Miniaturized Electronic Devices

5.4 Future Trends

5.4.1 Growing Implementation of AI-based Spend Analytics

5.5 Impact of Drivers and Restraints:

6. Spend Analytics for Electronics and Semiconductor Market - Asia Pacific Market Analysis

6.1 Spend Analytics for Electronics and Semiconductor Market Revenue (US$ Million), 2020-2030

6.2 Spend Analytics for Electronics and Semiconductor Market Forecast Analysis

7. Asia Pacific Spend Analytics for Electronics and Semiconductor Market Analysis - by Component

7.1 Software

7.1.1 Overview

7.1.2 Software: Spend Analytics for Electronics and Semiconductor Market - Revenue and Forecast to 2030 (US$ Million)

7.2 Service

7.2.1 Overview

7.2.2 Service: Spend Analytics for Electronics and Semiconductor Market - Revenue and Forecast to 2030 (US$ Million)

8. Asia Pacific Spend Analytics for Electronics and Semiconductor Market Analysis - by Type

8.1 Descriptive Analytics

8.1.1 Overview

8.1.2 Descriptive Analytics: Spend Analytics for Electronics and Semiconductor Market - Revenue and Forecast to 2030 (US$ Million)

8.2 Predictive Analytics

8.2.1 Overview

8.2.2 Predictive Analytics: Spend Analytics for Electronics and Semiconductor Market - Revenue and Forecast to 2030 (US$ Million)

8.3 Prescriptive Analytics

8.3.1 Overview

8.3.2 Prescriptive Analytics: Spend Analytics for Electronics and Semiconductor Market - Revenue and Forecast to 2030 (US$ Million)

9. Asia Pacific Spend Analytics for Electronics and Semiconductor Market Analysis - by Deployment

9.1 On-Premise

9.1.1 Overview

9.1.2 On-Premise: Spend Analytics for Electronics and Semiconductor Market - Revenue and Forecast to 2030 (US$ Million)

9.2 Cloud

9.2.1 Overview

9.2.2 Cloud: Spend Analytics for Electronics and Semiconductor Market - Revenue and Forecast to 2030 (US$ Million)

10. Asia Pacific Spend Analytics for Electronics and Semiconductor Market Analysis - by Application

10.1 Financial Management

10.1.1 Overview

10.1.2 Financial Management: Spend Analytics for Electronics and Semiconductor Market - Revenue and Forecast to 2030 (US$ Million)

10.2 Risk Management

10.2.1 Overview

10.2.2 Risk Management: Spend Analytics for Electronics and Semiconductor Market - Revenue and Forecast to 2030 (US$ Million)

10.3 Governance and Compliance Management

10.3.1 Overview

10.3.2 Governance and Compliance Management: Spend Analytics for Electronics and Semiconductor Market - Revenue and Forecast to 2030 (US$ Million)

10.4 Supplier Sourcing and Performance Management

10.4.1 Overview

10.4.2 Supplier Sourcing and Performance Management: Spend Analytics for Electronics and Semiconductor Market - Revenue and Forecast to 2030 (US$ Million)

10.5 Demand and Supply Forecasting

10.5.1 Overview

10.5.2 Demand and Supply Forecasting: Spend Analytics for Electronics and Semiconductor Market - Revenue and Forecast to 2030 (US$ Million)

10.6 Others

10.6.1 Overview

10.6.2 Others: Spend Analytics for Electronics and Semiconductor Market - Revenue and Forecast to 2030 (US$ Million)

11. Asia Pacific Spend Analytics for Electronics and Semiconductor Market - Country Analysis

11.1 Asia Pacific Market Overview

11.1.1 Asia Pacific: Spend Analytics for Electronics and Semiconductor Market - Revenue and Forecast Analysis by Country

11.1.1.1 Asia Pacific: Spend Analytics for Electronics and Semiconductor Market - Revenue and Forecast Analysis - by Country

11.1.1.2 Australia: Spend Analytics for Electronics and Semiconductor Market - Revenue and Forecast to 2030 (US$ Million)

11.1.1.2.1 Australia: Spend Analytics for Electronics and Semiconductor Market Breakdown, by Component

11.1.1.2.2 Australia: Spend Analytics for Electronics and Semiconductor Market Breakdown, by Type

11.1.1.2.3 Australia: Spend Analytics for Electronics and Semiconductor Market Breakdown, by Deployment

11.1.1.2.4 Australia: Spend Analytics for Electronics and Semiconductor Market Breakdown, by Application

11.1.1.3 China: Spend Analytics for Electronics and Semiconductor Market - Revenue and Forecast to 2030 (US$ Million)

11.1.1.3.1 China: Spend Analytics for Electronics and Semiconductor Market Breakdown, by Component

11.1.1.3.2 China: Spend Analytics for Electronics and Semiconductor Market Breakdown, by Type

11.1.1.3.3 China: Spend Analytics for Electronics and Semiconductor Market Breakdown, by Deployment

11.1.1.3.4 China: Spend Analytics for Electronics and Semiconductor Market Breakdown, by Application

11.1.1.4 India: Spend Analytics for Electronics and Semiconductor Market - Revenue and Forecast to 2030 (US$ Million)

11.1.1.4.1 India: Spend Analytics for Electronics and Semiconductor Market Breakdown, by Component

11.1.1.4.2 India: Spend Analytics for Electronics and Semiconductor Market Breakdown, by Type

11.1.1.4.3 India: Spend Analytics for Electronics and Semiconductor Market Breakdown, by Deployment

11.1.1.4.4 India: Spend Analytics for Electronics and Semiconductor Market Breakdown, by Application

11.1.1.5 Japan: Spend Analytics for Electronics and Semiconductor Market - Revenue and Forecast to 2030 (US$ Million)

11.1.1.5.1 Japan: Spend Analytics for Electronics and Semiconductor Market Breakdown, by Component

11.1.1.5.2 Japan: Spend Analytics for Electronics and Semiconductor Market Breakdown, by Type

11.1.1.5.3 Japan: Spend Analytics for Electronics and Semiconductor Market Breakdown, by Deployment

11.1.1.5.4 Japan: Spend Analytics for Electronics and Semiconductor Market Breakdown, by Application

11.1.1.6 South Korea: Spend Analytics for Electronics and Semiconductor Market - Revenue and Forecast to 2030 (US$ Million)

11.1.1.6.1 South Korea: Spend Analytics for Electronics and Semiconductor Market Breakdown, by Component

11.1.1.6.2 South Korea: Spend Analytics for Electronics and Semiconductor Market Breakdown, by Type

11.1.1.6.3 South Korea: Spend Analytics for Electronics and Semiconductor Market Breakdown, by Deployment

11.1.1.6.4 South Korea: Spend Analytics for Electronics and Semiconductor Market Breakdown, by Application

11.1.1.7 Rest of Asia Pacific: Spend Analytics for Electronics and Semiconductor Market - Revenue and Forecast to 2030 (US$ Million)

11.1.1.7.1 Rest of Asia Pacific: Spend Analytics for Electronics and Semiconductor Market Breakdown, by Component

11.1.1.7.2 Rest of Asia Pacific: Spend Analytics for Electronics and Semiconductor Market Breakdown, by Type

11.1.1.7.3 Rest of Asia Pacific: Spend Analytics for Electronics and Semiconductor Market Breakdown, by Deployment

11.1.1.7.4 Rest of Asia Pacific: Spend Analytics for Electronics and Semiconductor Market Breakdown, by Application

12. Competitive Landscape

12.1 Heat Map Analysis by Key Players

12.2 Company Positioning & Concentration

13. Industry Landscape

13.1 Overview

13.2 Market Initiative

13.3 Product Development

13.4 Merger and Acquisition

14. Company Profiles

14.1 Coupa Software Inc

14.1.1 Key Facts

14.1.2 Business Description

14.1.3 Products and Services

14.1.4 Financial Overview

14.1.5 SWOT Analysis

14.1.6 Key Developments

14.2 International Business Machines Corp

14.2.1 Key Facts

14.2.2 Business Description

14.2.3 Products and Services

14.2.4 Financial Overview

14.2.5 SWOT Analysis

14.2.6 Key Developments

14.3 Ivalua Inc

14.3.1 Key Facts

14.3.2 Business Description

14.3.3 Products and Services

14.3.4 Financial Overview

14.3.5 SWOT Analysis

14.3.6 Key Developments

14.4 NB Ventures Inc

14.4.1 Key Facts

14.4.2 Business Description

14.4.3 Products and Services

14.4.4 Financial Overview

14.4.5 SWOT Analysis

14.4.6 Key Developments

14.5 SAP SE

14.5.1 Key Facts

14.5.2 Business Description

14.5.3 Products and Services

14.5.4 Financial Overview

14.5.5 SWOT Analysis

14.5.6 Key Developments

14.6 Scanmarket A/S

14.6.1 Key Facts

14.6.2 Business Description

14.6.3 Products and Services

14.6.4 Financial Overview

14.6.5 SWOT Analysis

14.6.6 Key Developments

14.7 Synertrade Inc

14.7.1 Key Facts

14.7.2 Business Description

14.7.3 Products and Services

14.7.4 Financial Overview

14.7.5 SWOT Analysis

14.7.6 Key Developments

14.8 Zycus Inc

14.8.1 Key Facts

14.8.2 Business Description

14.8.3 Products and Services

14.8.4 Financial Overview

14.8.5 SWOT Analysis

14.8.6 Key Developments

15. Appendix

15.1 Word Index

List of Tables

Table 1. Spend Analytics for Electronics and Semiconductor Market Segmentation

Table 2. Spend Analytics for Electronics and Semiconductor Market - Revenue and Forecast to 2030 (US$ Million)

Table 3. Spend Analytics for Electronics and Semiconductor Market - Revenue and Forecast to 2030 (US$ Million) - by Component

Table 4. Spend Analytics for Electronics and Semiconductor Market - Revenue and Forecast to 2030 (US$ Million) - by Type

Table 5. Spend Analytics for Electronics and Semiconductor Market - Revenue and Forecast to 2030 (US$ Million) - by Deployment

Table 6. Spend Analytics for Electronics and Semiconductor Market - Revenue and Forecast to 2030 (US$ Million) - by Application

Table 7. Asia Pacific: Spend Analytics for Electronics and Semiconductor Market - Revenue and Forecast to 2030 (US$ Million) - by Country

Table 8. Australia: Spend Analytics for Electronics and Semiconductor Market - Revenue and Forecast to 2030 (US$ Million) - by Component

Table 9. Australia: Spend Analytics for Electronics and Semiconductor Market - Revenue and Forecast to 2030 (US$ Million) - by Type

Table 10. Australia: Spend Analytics for Electronics and Semiconductor Market - Revenue and Forecast to 2030 (US$ Million) - by Deployment

Table 11. Australia: Spend Analytics for Electronics and Semiconductor Market - Revenue and Forecast to 2030 (US$ Million) - by Application

Table 12. China: Spend Analytics for Electronics and Semiconductor Market - Revenue and Forecast to 2030 (US$ Million) - by Component

Table 13. China: Spend Analytics for Electronics and Semiconductor Market - Revenue and Forecast to 2030 (US$ Million) - by Type

Table 14. China: Spend Analytics for Electronics and Semiconductor Market - Revenue and Forecast to 2030 (US$ Million) - by Deployment

Table 15. China: Spend Analytics for Electronics and Semiconductor Market - Revenue and Forecast to 2030 (US$ Million) - by Application

Table 16. India: Spend Analytics for Electronics and Semiconductor Market - Revenue and Forecast to 2030 (US$ Million) - by Component

Table 17. India: Spend Analytics for Electronics and Semiconductor Market - Revenue and Forecast to 2030 (US$ Million) - by Type

Table 18. India: Spend Analytics for Electronics and Semiconductor Market - Revenue and Forecast to 2030 (US$ Million) - by Deployment

Table 19. India: Spend Analytics for Electronics and Semiconductor Market - Revenue and Forecast to 2030 (US$ Million) - by Application

Table 20. Japan: Spend Analytics for Electronics and Semiconductor Market - Revenue and Forecast to 2030 (US$ Million) - by Component

Table 21. Japan: Spend Analytics for Electronics and Semiconductor Market - Revenue and Forecast to 2030 (US$ Million) - by Type

Table 22. Japan: Spend Analytics for Electronics and Semiconductor Market - Revenue and Forecast to 2030 (US$ Million) - by Deployment

Table 23. Japan: Spend Analytics for Electronics and Semiconductor Market - Revenue and Forecast to 2030 (US$ Million) - by Application

Table 24. South Korea: Spend Analytics for Electronics and Semiconductor Market - Revenue and Forecast to 2030 (US$ Million) - by Component

Table 25. South Korea: Spend Analytics for Electronics and Semiconductor Market - Revenue and Forecast to 2030 (US$ Million) - by Type

Table 26. South Korea: Spend Analytics for Electronics and Semiconductor Market - Revenue and Forecast to 2030 (US$ Million) - by Deployment

Table 27. South Korea: Spend Analytics for Electronics and Semiconductor Market - Revenue and Forecast to 2030 (US$ Million) - by Application

Table 28. Rest of Asia Pacific: Spend Analytics for Electronics and Semiconductor Market - Revenue and Forecast to 2030 (US$ Million) - by Component

Table 29. Rest of Asia Pacific: Spend Analytics for Electronics and Semiconductor Market - Revenue and Forecast to 2030 (US$ Million) - by Type

Table 30. Rest of Asia Pacific: Spend Analytics for Electronics and Semiconductor Market - Revenue and Forecast to 2030 (US$ Million) - by Deployment

Table 31. Rest of Asia Pacific: Spend Analytics for Electronics and Semiconductor Market - Revenue and Forecast to 2030 (US$ Million) - by Application

Table 32. Heat Map Analysis by Key Players

Table 33. List of Abbreviation

List of Figures

Figure 1. Spend Analytics for Electronics and Semiconductor Market Segmentation, by Country

Figure 2. Ecosystem: Spend Analytics for Electronics and Semiconductor Market

Figure 3. Spend Analytics for Electronics and Semiconductor Market - Key Market Dynamics

Figure 4. Impact Analysis of Drivers and Restraints

Figure 5. Spend Analytics for Electronics and Semiconductor Market Revenue (US$ Million), 2020-2030

Figure 6. Spend Analytics for Electronics and Semiconductor Market Share (%) - by Component (2022 and 2030)

Figure 7. Software: Spend Analytics for Electronics and Semiconductor Market - Revenue and Forecast to 2030 (US$ Million)

Figure 8. Service: Spend Analytics for Electronics and Semiconductor Market - Revenue and Forecast to 2030 (US$ Million)

Figure 9. Spend Analytics for Electronics and Semiconductor Market Share (%) - by Type (2022 and 2030)

Figure 10. Descriptive Analytics: Spend Analytics for Electronics and Semiconductor Market - Revenue and Forecast to 2030 (US$ Million)

Figure 11. Predictive Analytics: Spend Analytics for Electronics and Semiconductor Market - Revenue and Forecast to 2030 (US$ Million)

Figure 12. Prescriptive Analytics: Spend Analytics for Electronics and Semiconductor Market - Revenue and Forecast to 2030 (US$ Million)

Figure 13. Spend Analytics for Electronics and Semiconductor Market Share (%) - by Deployment (2022 and 2030)

Figure 14. On-Premise: Spend Analytics for Electronics and Semiconductor Market - Revenue and Forecast to 2030 (US$ Million)

Figure 15. Cloud: Spend Analytics for Electronics and Semiconductor Market - Revenue and Forecast to 2030 (US$ Million)

Figure 16. Spend Analytics for Electronics and Semiconductor Market Share (%) - by Application (2022 and 2030)

Figure 17. Financial Management: Spend Analytics for Electronics and Semiconductor Market - Revenue and Forecast to 2030 (US$ Million)

Figure 18. Risk Management: Spend Analytics for Electronics and Semiconductor Market - Revenue and Forecast to 2030 (US$ Million)

Figure 19. Governance and Compliance Management: Spend Analytics for Electronics and Semiconductor Market - Revenue and Forecast to 2030 (US$ Million)

Figure 20. Supplier Sourcing and Performance Management: Spend Analytics for Electronics and Semiconductor Market - Revenue and Forecast to 2030 (US$ Million)

Figure 21. Demand and Supply Forecasting: Spend Analytics for Electronics and Semiconductor Market - Revenue and Forecast to 2030 (US$ Million)

Figure 22. Others: Spend Analytics for Electronics and Semiconductor Market - Revenue and Forecast to 2030 (US$ Million)

Figure 23. Spend Analytics for Electronics and Semiconductor Market, by Key Countries - Revenue (2022) (US$ Million)

Figure 24. Asia Pacific: Spend Analytics for Electronics and Semiconductor Market Breakdown, by Key Countries, 2022 and 2030 (%)

Figure 25. Australia: Spend Analytics for Electronics and Semiconductor Market - Revenue and Forecast to 2030 (US$ Million)

Figure 26. China: Spend Analytics for Electronics and Semiconductor Market - Revenue and Forecast to 2030 (US$ Million)

Figure 27. India: Spend Analytics for Electronics and Semiconductor Market - Revenue and Forecast to 2030 (US$ Million)

Figure 28. Japan: Spend Analytics for Electronics and Semiconductor Market - Revenue and Forecast to 2030 (US$ Million)

Figure 29. South Korea: Spend Analytics for Electronics and Semiconductor Market - Revenue and Forecast to 2030 (US$ Million)

Figure 30. Rest of Asia Pacific: Spend Analytics for Electronics and Semiconductor Market - Revenue and Forecast to 2030 (US$ Million)

Figure 31. Company Positioning & Concentration

1. Coupa Software Inc
2. International Business Machines Corp
3. Ivalua Inc
4. NB Ventures Inc
5. SAP SE
6. Scanmarket AS
7. Synertrade Inc
8. Zycus Inc

  • Save and reduce time carrying out entry-level research by identifying the growth, size, leading players, and segments in the Asia Pacific spend analytics for electronics and semiconductor market.
  • Highlights key business priorities in order to assist companies to realign their business strategies.
  • The key findings and recommendations highlight crucial progressive industry trends in Asia Pacific spend analytics for electronics and semiconductor market, thereby allowing players across the value chain to develop effective long-term strategies.
  • Develop/modify business expansion plans by using substantial growth offering developed and emerging markets.
  • Scrutinize in-depth Asia Pacific market trends and outlook coupled with the factors driving the market, as well as those hindering it.
  • Enhance the decision-making process by understanding the strategies that underpin security interest with respect to client products, segmentation, pricing, and distribution.
Report Code
Full Name
Country Name
Email Id
Phone Number
Job Title
Company
Requirement

Note : Your data will never be shared with third parties, however, we may send you information from time to time about our products that may be of interest to you. By submitting your details, you agree to be contacted by us. You may contact us at any time to opt-out.


Purchase Options
Single User License
$3550
$2840
Site License
$4550
$3640
Enterprise License
$5550
$4440