Asia Pacific Revenue Assurance Market Forecast to 2030 - Regional Analysis - by Component (Solution and Services), Deployment (On-Premise and Cloud-Based), Organization Size (SMEs and Large Enterprises), and Vertical (BFSI, Hospitality, Telecom, Utilities, and Others)

BMIRE00030383 | Pages: 94 | Technology, Media and Telecommunications | Jul 2024 | Type: Regional | Status: Published

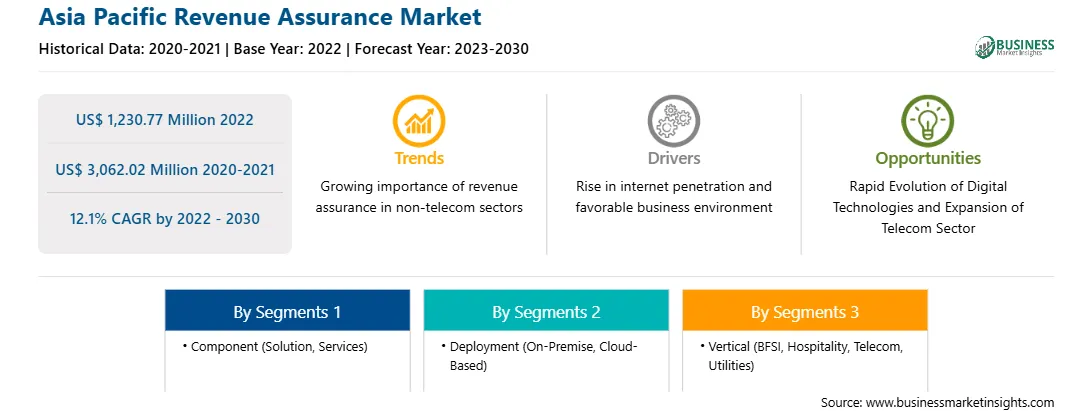
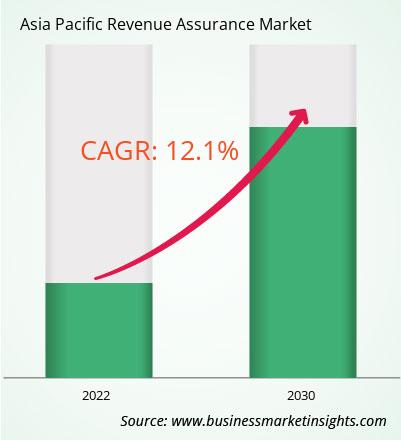
The Asia Pacific revenue assurance market was valued at US$ 1,230.77 million in 2022 and is expected to reach US$ 3,062.02 million by 2030; it is estimated to record a CAGR of 12.1% from 2022 to 2030.

Rapid Evolution of Digital Technologies Boosts Asia Pacific Revenue Assurance Market

Technological advancements have revolutionized various industries, and the revenue assurance market is no exception. With the rapid evolution of digital technologies such as machine learning and artificial intelligence, the revenue assurance market has been presented with new opportunities to enhance its effectiveness and drive business growth. Technology is crucial in revenue assurance as it provides innovative tools and solutions to monitor, analyze, and optimize revenue streams. It enables businesses to streamline processes, identify revenue leakages, and ensure compliance with regulatory standards. Embracing technological advancements in revenue assurance can lead to improved operational efficiency, increased revenue generation, and enhanced customer satisfaction.

Predictive analytics leverages historical and real-time data to forecast future revenue patterns, identify potential revenue leakages, and mitigate risks. By employing advanced algorithms and machine learning techniques, revenue assurance teams can predict revenue trends, identify potential areas of revenue loss, and implement preventive measures before issues arise. This proactive approach helps businesses optimize revenue streams and minimize financial risks. Furthermore, blockchain technology offers a transparent and secure platform for revenue assurance. By leveraging blockchain's decentralized ledger system, businesses can ensure the integrity and immutability of revenue-related data. This technology enables secure and tamper-proof recording of transactions, simplifies revenue reconciliation processes, and enhances stakeholder trust. Blockchain facilitates faster settlement processes, reducing revenue leakage caused by delayed payments or disputes.

Technological advancements, particularly in big data and machine learning (ML), are revolutionizing the revenue assurance market. These advancements empower businesses to manage and optimize their revenue streams effectively, leading to increased profitability and operational efficiency. Big data analytics allow organizations to gather and analyze vast amounts of data from various sources, including customer transactions, billing systems, and network operations. Using advanced analytics techniques, businesses can gain valuable insights into their revenue generation processes, identify potential revenue leakages, and proactively address them. This proactive approach helps minimize financial losses and ensures accurate billing and revenue recognition.

Machine learning (ML) plays a crucial role in revenue assurance by automating complex data analysis tasks and detecting anomalies or deviations in revenue patterns. ML algorithms can analyze historical data, identify trends, and predict potential revenue risks. This enables businesses to take preventive measures and implement proactive strategies to mitigate revenue losses. For this, various countries and global players are focused on infusing AI technology into their workflow. Various countries are on track to becoming the premier artificial intelligence (AI) hub by 2030. In addition, as per the International Trade Administration report, the AI global funding doubled to US$ 66.8 billion in 2021 compared to 2020. This signifies the immense potential and opportunities that AI brings to the business landscape globally and highlights the growth across several industries with AI-driven innovation and development

Asia Pacific Revenue Assurance Market Overview

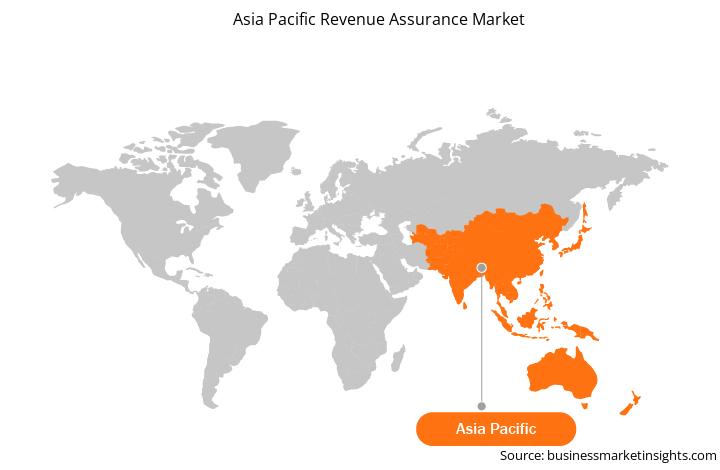
The Asia Pacific market is segmented into Australia, Japan, China, South Korea, India, and the Rest of Asia Pacific. It is experiencing substantial growth in the revenue assurance market. Rapidly growing economies in the region have surged the demand for telecommunication services and financial products. This complexity necessitates robust revenue assurance solutions to prevent revenue leakage and maintain financial integrity. In addition, to satisfy digital demands and habits, consumers have increased their use of digital services such as eCommerce, digital financial services, and videoconferencing. Businesses are also purchasing ICT solutions such as Big Data, cloud computing, and security to support their remote workers. In the digital age, connectivity is necessary for both individuals to stay in touch and businesses to carry on with their activities.

In July 2023, Telecom operators in APAC are estimated to invest US$ 259 billion on networks between 2023 and 2030, with most of it on 5G deployments, according to the GSMA's Mobile Economy Asia Pacific 2023 report. Furthermore, the growing adoption of 5G technology, cloud-based services, digital transactions, and complex financial products increases the need for advanced revenue assurance tools to ensure accurate billing and compliance. Moreover, businesses across industries are increasingly recognizing the value of investing in robust revenue assurance solutions to protect their financial health and ensure accurate billing. Thus, the APAC revenue assurance market is poised for strong growth, fueled by rapid digitalization, stringent regulations, and growing awareness of revenue leakage risks.

Asia Pacific Revenue Assurance Market Revenue and Forecast to 2030 (US$ Million)

Asia Pacific Revenue Assurance Market Revenue and Forecast to 2030 (US$ Million)

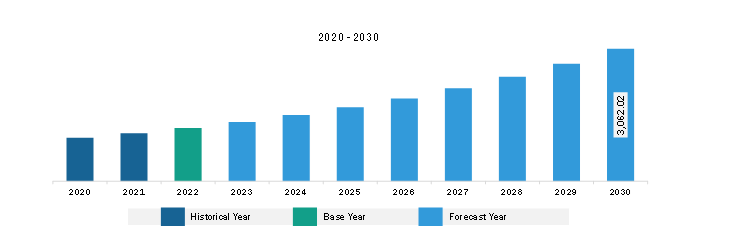
Get more information on this report :

Asia Pacific Revenue Assurance Market Segmentation

The Asia Pacific revenue assurance market is categorized into components, deployment, organization size, vertical, and country.

Based on component, the Asia Pacific revenue assurance market is bifurcated into solution and services. The solution segment held a larger market share in 2022.

Based on deployment, the Asia Pacific revenue assurance market is bifurcated into on-premises and cloud-based. The cloud-based segment held a larger market share in 2022.

Based on organization size, the Asia Pacific revenue assurance market is bifurcated into SMEs and large enterprises. The large enterprises segment held a larger market share in 2022.

Based on vertical, the Asia Pacific revenue assurance market is categorized into BFSI, hospitality, telecom, utilities, and others. The telecom segment held the largest market share in 2022.

By country, the Asia Pacific revenue assurance market is segmented into Australia, China, India, Japan, South Korea, New Zealand, and the Rest of Asia Pacific. China dominated the Asia Pacific revenue assurance market share in 2022.

Nokia Corp, Tata Consultancy Services Ltd, Amdocs, Subex, Araxxe SAS, Panamax Inc, Adapt IT Holding Proprietary Ltd, and Latro Services Inc are some of the leading companies operating in the Asia Pacific revenue assurance market.

TABLE OF CONTENTS


1. Introductions

1.1 The Insight Partners Research Report Guidance

1.2 Market Segmentation

2. Executive Summary

2.1 Key Insights

2.2 Market Attractiveness

3. Research Methodology

3.1 Coverage

3.2 Secondary Research

3.3 Primary Research

4. Revenue Assurance Market Landscape

4.1 Overview

4.2 PEST Analysis

4.3 Ecosystem Analysis

4.3.1 Solution Providers:

4.3.2 Service Providers

4.3.3 End Users:

4.3.4 List of Vendors in the Value Chain

5. Asia Pacific Revenue Assurance Market - Key Market Dynamics

5.1 Drivers

5.1.1 Rise in Internet Penetration

5.1.2 Favorable Business Environment

5.2 Restraints

5.2.1 Lack of Awareness and Understanding of Revenue Assurance

5.2.2 Organizational Management Issues

5.3 Opportunity

5.3.1 Rapid Evolution of Digital Technologies

5.3.2 Expansion of Telecom Sector

5.4 Future Trends

5.4.1 Growing Importance of Revenue Assurance in Non-Telecom Sectors

5.5 Impact of Drivers and Restraints:

6. Revenue Assurance Market - Asia Pacific Market Analysis

6.1 Revenue Assurance Market Revenue (US$ Million), 2020-2030

6.2 Revenue Assurance Market Forecast Analysis

7. Asia Pacific Revenue Assurance Market Analysis - by Component

7.1 Solution

7.1.1 Overview

7.1.2 Solution: Revenue Assurance Market - Revenue and Forecast to 2030 (US$ Million)

7.2 Services

7.2.1 Overview

7.2.2 Services: Revenue Assurance Market - Revenue and Forecast to 2030 (US$ Million)

8. Asia Pacific Revenue Assurance Market Analysis - by Deployment

8.1 On-premise

8.1.1 Overview

8.1.2 On-premise: Revenue Assurance Market - Revenue and Forecast to 2030 (US$ Million)

8.2 Cloud-based

8.2.1 Overview

8.2.2 Cloud-based: Revenue Assurance Market - Revenue and Forecast to 2030 (US$ Million)

9. Asia Pacific Revenue Assurance Market Analysis - by Organization Size

9.1 SMEs

9.1.1 Overview

9.1.2 SMEs: Revenue Assurance Market - Revenue and Forecast to 2030 (US$ Million)

9.2 Large Enterprises

9.2.1 Overview

9.2.2 Large Enterprises: Revenue Assurance Market - Revenue and Forecast to 2030 (US$ Million)

10. Asia Pacific Revenue Assurance Market Analysis - by Vertical

10.1 BFSI

10.1.1 Overview

10.1.2 BFSI: Revenue Assurance Market - Revenue and Forecast to 2030 (US$ Million)

10.2 Hospitality

10.2.1 Overview

10.2.2 Hospitality: Revenue Assurance Market - Revenue and Forecast to 2030 (US$ Million)

10.3 Telecom

10.3.1 Overview

10.3.2 Telecom: Revenue Assurance Market - Revenue and Forecast to 2030 (US$ Million)

10.4 Utilities

10.4.1 Overview

10.4.2 Utilities: Revenue Assurance Market - Revenue and Forecast to 2030 (US$ Million)

10.5 Others

10.5.1 Overview

10.5.2 Others: Revenue Assurance Market - Revenue and Forecast to 2030 (US$ Million)

11. Asia Pacific Revenue Assurance Market - Country Analysis

11.1 Asia Pacific Market Overview

11.1.1 Asia Pacific: Revenue Assurance Market - Revenue and Forecast Analysis - by Country

11.1.1.1 Asia Pacific: Revenue Assurance Market - Revenue and Forecast Analysis - by Country

11.1.1.2 China: Revenue Assurance Market - Revenue and Forecast to 2030 (US$ Million)

11.1.1.2.1 China: Revenue Assurance Market Breakdown, by Component

11.1.1.2.2 China: Revenue Assurance Market Breakdown, by Deployment

11.1.1.2.3 China: Revenue Assurance Market Breakdown, by Organization Size

11.1.1.2.4 China: Revenue Assurance Market Breakdown, by Vertical

11.1.1.3 Japan: Revenue Assurance Market - Revenue and Forecast to 2030 (US$ Million)

11.1.1.3.1 Japan: Revenue Assurance Market Breakdown, by Component

11.1.1.3.2 Japan: Revenue Assurance Market Breakdown, by Deployment

11.1.1.3.3 Japan: Revenue Assurance Market Breakdown, by Organization Size

11.1.1.3.4 Japan: Revenue Assurance Market Breakdown, by Vertical

11.1.1.4 South Korea: Revenue Assurance Market - Revenue and Forecast to 2030 (US$ Million)

11.1.1.4.1 South Korea: Revenue Assurance Market Breakdown, by Component

11.1.1.4.2 South Korea: Revenue Assurance Market Breakdown, by Deployment

11.1.1.4.3 South Korea: Revenue Assurance Market Breakdown, by Organization Size

11.1.1.4.4 South Korea: Revenue Assurance Market Breakdown, by Vertical

11.1.1.5 India: Revenue Assurance Market - Revenue and Forecast to 2030 (US$ Million)

11.1.1.5.1 India: Revenue Assurance Market Breakdown, by Component

11.1.1.5.2 India: Revenue Assurance Market Breakdown, by Deployment

11.1.1.5.3 India: Revenue Assurance Market Breakdown, by Organization Size

11.1.1.5.4 India: Revenue Assurance Market Breakdown, by Vertical

11.1.1.6 Australia: Revenue Assurance Market - Revenue and Forecast to 2030 (US$ Million)

11.1.1.6.1 Australia: Revenue Assurance Market Breakdown, by Component

11.1.1.6.2 Australia: Revenue Assurance Market Breakdown, by Deployment

11.1.1.6.3 Australia: Revenue Assurance Market Breakdown, by Organization Size

11.1.1.6.4 Australia: Revenue Assurance Market Breakdown, by Vertical

11.1.1.7 Rest of Asia Pacific: Revenue Assurance Market - Revenue and Forecast to 2030 (US$ Million)

11.1.1.7.1 Rest of Asia Pacific: Revenue Assurance Market Breakdown, by Component

11.1.1.7.2 Rest of Asia Pacific: Revenue Assurance Market Breakdown, by Deployment

11.1.1.7.3 Rest of Asia Pacific: Revenue Assurance Market Breakdown, by Organization Size

11.1.1.7.4 Rest of Asia Pacific: Revenue Assurance Market Breakdown, by Vertical

12. Competitive Landscape

12.1 Heat Map Analysis by Key Players

12.2 Company Positioning & Concentration

13. Industry Landscape

13.1 Overview

13.2 Market Initiative

13.3 Mergers & Acquisitions

14. Company Profiles

14.1 Nokia Corp

14.1.1 Key Facts

14.1.2 Business Description

14.1.3 Products and Services

14.1.4 Financial Overview

14.1.5 SWOT Analysis

14.1.6 Key Developments

14.2 Tata Consultancy Services Ltd

14.2.1 Key Facts

14.2.2 Business Description

14.2.3 Products and Services

14.2.4 Financial Overview

14.2.5 SWOT Analysis

14.2.6 Key Developments

14.3 Amdocs Ltd

14.3.1 Key Facts

14.3.2 Business Description

14.3.3 Products and Services

14.3.4 Financial Overview

14.3.5 SWOT Analysis

14.3.6 Key Developments

14.4 Subex Ltd

14.4.1 Key Facts

14.4.2 Business Description

14.4.3 Products and Services

14.4.4 Financial Overview

14.4.5 SWOT Analysis

14.4.6 Key Developments

14.5 Araxxe SAS

14.5.1 Key Facts

14.5.2 Business Description

14.5.3 Products and Services

14.5.4 Financial Overview

14.5.5 SWOT Analysis

14.5.6 Key Developments

14.6 Panamax Inc

14.6.1 Key Facts

14.6.2 Business Description

14.6.3 Products and Services

14.6.4 Financial Overview

14.6.5 SWOT Analysis

14.6.6 Key Developments

14.7 Adapt IT Holdings Proprietary Ltd

14.7.1 Key Facts

14.7.2 Business Description

14.7.3 Products and Services

14.7.4 Financial Overview

14.7.5 SWOT Analysis

14.7.6 Key Developments

14.8 LATRO Services Inc

14.8.1 Key Facts

14.8.2 Business Description

14.8.3 Products and Services

14.8.4 Financial Overview

14.8.5 SWOT Analysis

14.8.6 Key Developments

15. Appendix

15.1 About The Insight Partners

15.2 Word Index

List of Tables

Table 1. Revenue Assurance Market Segmentation

Table 2. List of Vendors

Table 3. Revenue Assurance Market - Revenue and Forecast to 2030 (US$ Million)

Table 4. Revenue Assurance Market - Revenue and Forecast to 2030 (US$ Million) - by Component

Table 5. Revenue Assurance Market - Revenue and Forecast to 2030 (US$ Million) - by Deployment

Table 6. Revenue Assurance Market - Revenue and Forecast to 2030 (US$ Million) - by Organization Size

Table 7. Revenue Assurance Market - Revenue and Forecast to 2030 (US$ Million) - by Vertical

Table 8. Asia Pacific: Revenue Assurance Market - Revenue and Forecast to 2030 (US$ Million) - by Country

Table 9. China: Revenue Assurance Market - Revenue and Forecast to 2030 (US$ Million) - by Component

Table 10. China: Revenue Assurance Market - Revenue and Forecast to 2030 (US$ Million) - by Deployment

Table 11. China: Revenue Assurance Market - Revenue and Forecast to 2030 (US$ Million) - by Organization Size

Table 12. China: Revenue Assurance Market - Revenue and Forecast to 2030 (US$ Million) - by Vertical

Table 13. Japan: Revenue Assurance Market - Revenue and Forecast to 2030 (US$ Million) - by Component

Table 14. Japan: Revenue Assurance Market - Revenue and Forecast to 2030 (US$ Million) - by Deployment

Table 15. Japan: Revenue Assurance Market - Revenue and Forecast to 2030 (US$ Million) - by Organization Size

Table 16. Japan: Revenue Assurance Market - Revenue and Forecast to 2030 (US$ Million) - by Vertical

Table 17. South Korea: Revenue Assurance Market - Revenue and Forecast to 2030 (US$ Million) - by Component

Table 18. South Korea: Revenue Assurance Market - Revenue and Forecast to 2030 (US$ Million) - by Deployment

Table 19. South Korea: Revenue Assurance Market - Revenue and Forecast to 2030 (US$ Million) - by Organization Size

Table 20. South Korea: Revenue Assurance Market - Revenue and Forecast to 2030 (US$ Million) - by Vertical

Table 21. India: Revenue Assurance Market - Revenue and Forecast to 2030 (US$ Million) - by Component

Table 22. India: Revenue Assurance Market - Revenue and Forecast to 2030 (US$ Million) - by Deployment

Table 23. India: Revenue Assurance Market - Revenue and Forecast to 2030 (US$ Million) - by Organization Size

Table 24. India: Revenue Assurance Market - Revenue and Forecast to 2030 (US$ Million) - by Vertical

Table 25. Australia: Revenue Assurance Market - Revenue and Forecast to 2030 (US$ Million) - by Component

Table 26. Australia: Revenue Assurance Market - Revenue and Forecast to 2030 (US$ Million) - by Deployment

Table 27. Australia: Revenue Assurance Market - Revenue and Forecast to 2030 (US$ Million) - by Organization Size

Table 28. Australia: Revenue Assurance Market - Revenue and Forecast to 2030 (US$ Million) - by Vertical

Table 29. Rest of Asia Pacific: Revenue Assurance Market - Revenue and Forecast to 2030 (US$ Million) - by Component

Table 30. Rest of Asia Pacific: Revenue Assurance Market - Revenue and Forecast to 2030 (US$ Million) - by Deployment

Table 31. Rest of Asia Pacific: Revenue Assurance Market - Revenue and Forecast to 2030 (US$ Million) - by Organization Size

Table 32. Rest of Asia Pacific: Revenue Assurance Market - Revenue and Forecast to 2030 (US$ Million) - by Vertical

Table 33. Heat Map Analysis

Table 34. List of Abbreviation

List of Figures

Figure 1. Revenue Assurance Market Segmentation, by Country

Figure 2. PEST Analysis

Figure 3. Ecosystem Analysis

Figure 4. Revenue Assurance Market - Key Market Dynamics

Figure 5. Impact Analysis of Drivers and Restraints

Figure 6. Revenue Assurance Market Revenue (US$ Million), 2020-2030

Figure 7. Revenue Assurance Market Share (%) - by Component (2022 and 2030)

Figure 8. Solution: Revenue Assurance Market - Revenue and Forecast to 2030 (US$ Million)

Figure 9. Services: Revenue Assurance Market - Revenue and Forecast to 2030 (US$ Million)

Figure 10. Revenue Assurance Market Share (%) - by Deployment (2022 and 2030)

Figure 11. On-premise: Revenue Assurance Market - Revenue and Forecast to 2030 (US$ Million)

Figure 12. Cloud-based: Revenue Assurance Market - Revenue and Forecast to 2030 (US$ Million)

Figure 13. Revenue Assurance Market Share (%) - by Organization Size (2022 and 2030)

Figure 14. SMEs: Revenue Assurance Market - Revenue and Forecast to 2030 (US$ Million)

Figure 15. Large Enterprises: Revenue Assurance Market - Revenue and Forecast to 2030 (US$ Million)

Figure 16. Revenue Assurance Market Share (%) - by Vertical (2022 and 2030)

Figure 17. BFSI: Revenue Assurance Market - Revenue and Forecast to 2030 (US$ Million)

Figure 18. Hospitality: Revenue Assurance Market - Revenue and Forecast to 2030 (US$ Million)

Figure 19. Telecom: Revenue Assurance Market - Revenue and Forecast to 2030 (US$ Million)

Figure 20. Utilities: Revenue Assurance Market - Revenue and Forecast to 2030 (US$ Million)

Figure 21. Others: Revenue Assurance Market - Revenue and Forecast to 2030 (US$ Million)

Figure 22. Asia Pacific: Revenue Assurance Market, by Key Country - Revenue (2022) (US$ Million)

Figure 23. Asia Pacific: Revenue Assurance Market Breakdown, by Key Countries, 2022 and 2030 (%)

Figure 24. China: Revenue Assurance Market - Revenue and Forecast to 2030 (US$ Million)

Figure 25. Japan: Revenue Assurance Market - Revenue and Forecast to 2030 (US$ Million)

Figure 26. South Korea: Revenue Assurance Market - Revenue and Forecast to 2030 (US$ Million)

Figure 27. India: Revenue Assurance Market - Revenue and Forecast to 2030 (US$ Million)

Figure 28. Australia: Revenue Assurance Market - Revenue and Forecast to 2030 (US$ Million)

Figure 29. Rest of Asia Pacific: Revenue Assurance Market - Revenue and Forecast to 2030 (US$ Million)

Figure 30. Company Positioning & Concentration

1. Nokia Corp 
2. Tata Consultancy Services Ltd 
3. Amdocs 
4. Subex Ltd 
5. Araxxe SAS 
6. Panamax Inc 
7. Adapt IT Holdings Proprietary Ltd 
8. LATRO Services Inc

  • Save and reduce time carrying out entry-level research by identifying the growth, size, leading players, and segments in the Asia Pacific revenue assurance market.
  • Highlights key business priorities in order to assist companies to realign their business strategies.
  • The key findings and recommendations highlight crucial progressive industry trends in the Asia Pacific revenue assurance market, thereby allowing players across the value chain to develop effective long-term strategies.
  • Develop/modify business expansion plans by using substantial growth offering developed and emerging markets.
  • Scrutinize in-depth Asia Pacific market trends and outlook coupled with the factors driving the Asia Pacific revenue assurance market, as well as those hindering it.
  • Enhance the decision-making process by understanding the strategies that underpin commercial interest with respect to client products, segmentation, pricing, and distribution.
Report Code
Full Name
Country Name
Email Id
Phone Number
Job Title
Company
Requirement

Note : Your data will never be shared with third parties, however, we may send you information from time to time about our products that may be of interest to you. By submitting your details, you agree to be contacted by us. You may contact us at any time to opt-out.


Purchase Options
Single User License
$3550
$2840
Site License
$4550
$3640
Enterprise License
$5550
$4440