Asia Pacific Returns Management Software Market Forecast to 2031 - Regional Analysis - by Component (Software and Services), Deployment (Cloud and On Premises), and Enterprise Size (Large Enterprises and SMEs)

BMIRE00030887 | Pages: 80 | Technology, Media and Telecommunications | Oct 2024 | Type: Regional | Status: Published

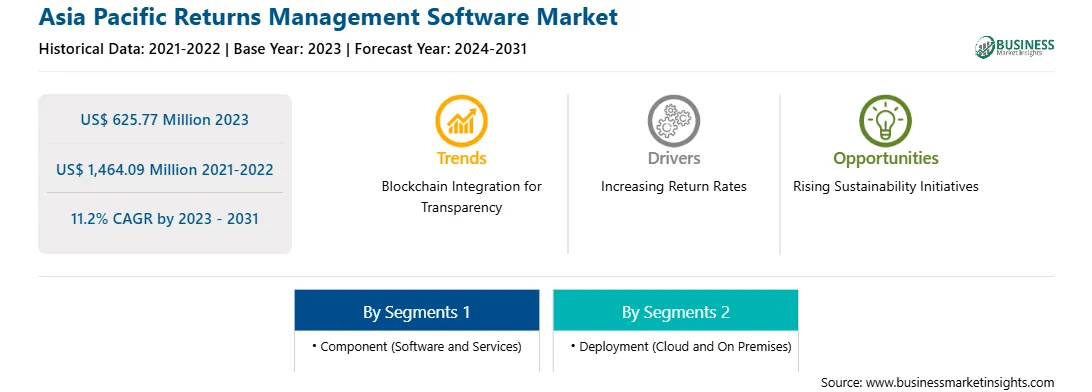
The Asia Pacific returns management software market was valued at US$ 625.77 million in 2023 and is projected to reach US$ 1,464.09 million by 2031; it is estimated to register a CAGR of 11.2% from 2023 to 2031.

Technological Advancements Boost Asia Pacific Returns Management Software Market

Technological advancements have opened new opportunities for the returns management software market, enhancing operational efficiency and transforming the way businesses handle reverse logistics. The rise of e-commerce has led to a significant increase in product returns, necessitating advanced solutions to manage the complex and diverse challenges associated with reverse logistics. Returns management software leverages technology to streamline and automate the entire returns process, from initiation to final resolution.

The adoption of artificial intelligence (AI) and machine learning (ML) in return management software has been increasing in recent years. Companies are recognizing the benefits of using AI and ML technologies to improve their return management processes and enhance customer satisfaction. AI and ML can be utilized in return management software in various ways. One application is through pattern detection, where AI and ML algorithms can analyze past return data to provide accurate estimates of current return projects. By considering historical details such as bugs, test phases, actuals, and estimated values, the system can fine-tune its accuracy in predicting delivery schedules and creating work schedules for team members. This can lead to better execution of risk management and resource management in return management processes.

Asia Pacific Returns Management Software Market Overview

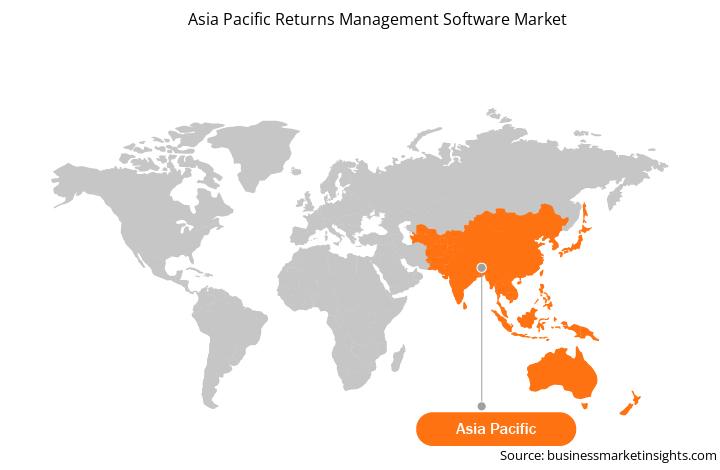
Asia Pacific comprises major economies such as Australia, China, Japan, South Korea, India, and the Rest of Asia Pacific. According to the Asian Development Bank, Asia Pacific currently dominates the global business-to-consumer (B2C) and retail e-commerce market, with a projected share of 61% by 2025. This significant market share is driven by factors such as the rising adoption of smartphones, the convenience and safety of online shopping for everyday necessities and luxury items, the vast range of products and sellers available, and the rapid advancement of cutting-edge technologies such as voice recognition, augmented reality, and artificial intelligence. Cross-border e-commerce is another influential factor fueling the demand for returns management software. With the rise of international online transactions, businesses require sophisticated systems to navigate the complexities of cross-border returns, including compliance with different regulations and optimizing logistics across diverse markets within Asia Pacific. Based on data provided by Indian e-commerce players, the return rate for online shopping in India is estimated to range between 25 and 40%, surpassing the global average in the year 2022. This presents a substantial challenge for businesses, as returns have a direct impact on their profit margins and erode their overall profitability. Technological advancements and the proliferation of smart devices contribute significantly to market growth. As consumers across Asia-Pacific adopt digital platforms for shopping, returns management software becomes integral for businesses to manage and process returns efficiently, leveraging automation and analytics to enhance overall operational effectiveness.

Asia Pacific Returns Management Software Market Revenue and Forecast to 2031 (US$ Million)

Asia Pacific Returns Management Software Market Revenue and Forecast to 2031 (US$ Million)

Get more information on this report :

Asia Pacific Returns Management Software Market Segmentation

The Asia Pacific returns management software market is categorized into component, deployment, enterprise size, and country.

Based on component, the Asia Pacific returns management software market is bifurcated into software and services. The software segment held a larger market share in 2023.

In terms of deployment, the Asia Pacific returns management software market is segmented into cloud and on premises. The cloud segment held a larger market share in 2023.

Based on enterprise size, the Asia Pacific returns management software market is bifurcated into large enterprises and SMEs. The large enterprise segment held a larger market share in 2023.

By country, the Asia Pacific returns management software market is segmented into China, Japan, South Korea, India, Australia, and the Rest of Asia Pacific. China dominated the Asia Pacific returns management software market share in 2023.

ReverseLogix, United Parcel Service of America Inc, SAP SE, and AfterShip are some of the leading companies operating in the Asia Pacific returns management software market.

TABLE OF CONTENTS


1. Introduction

1.1 The Insight Partners Research Report Guidance

1.2 Market Segmentation

2. Executive Summary

2.1 Key Insights

2.2 Market Attractiveness

3. Research Methodology

3.1 Scope

3.2 Coverage

3.3 Secondary Research

3.4 Primary Research

3.4.1 Hypothesis Formulation:

3.4.2 Developing Base Number:

3.4.3 Data Triangulation:

3.4.4 Country Level Data:

3.5 Key Sources and Factors Considered During the Market Analysis

3.5.1 Key Secondary Sources:

3.5.2 Key Factors Considered:

3.6 Key Companies Considered During Market Analysis

4. Asia Pacific Returns Management Software Market Landscape

4.1 Overview

4.2 Ecosystem Analysis

4.2.1 Solution Providers:

4.2.2 End-Users:

4.2.3 List of Vendors in the Value Chain

4.3 Premium Insights

4.3.1 Comparison of Frontend Vs Backend

4.3.1.1 User Requirement Analysis - Frontend Features Present Vs Frontend Features Required

4.3.1.1.1 Frontend Features Present

4.3.1.1.2 Frontend Features Required

4.3.1.2 User Requirement Analysis - Backend Features Present Vs Backend Features Required

4.3.1.2.1 Backend Features Present

4.3.1.2.2 Backend Features Required

5. Asia Pacific Returns Management Software Market - Key Market Dynamics

5.1 Market Drivers

5.1.1 Increase in Return Rates

5.1.2 Growth of E-commerce Sector

5.1.3 Rising Need for Customer Satisfaction

5.2 Market Restraints

5.2.1 High Implementation Costs

5.2.2 Data Security Concerns

5.3 Market Opportunities

5.3.1 Rising Sustainability Initiatives

5.3.2 Technological Advancements

5.4 Future Trends

5.4.1 Integration of Blockchain Technology

5.5 Impact of Drivers and Restraints:

6. Returns Management Software Market - Asia Pacific Analysis

6.1 Returns Management Software Market Revenue (US$ Million), 2021-2031

6.2 Returns Management Software Market Forecast Analysis

7. Asia Pacific Returns Management Software Market Analysis - by Component

7.1 Software

7.1.1 Overview

7.1.2 Software: Returns Management Software Market - Revenue and Forecast to 2031 (US$ Million)

7.2 Services

7.2.1 Overview

7.2.2 Services: Returns Management Software Market - Revenue and Forecast to 2031 (US$ Million)

8. Asia Pacific Returns Management Software Market Analysis - by Deployment

8.1 Cloud

8.1.1 Overview

8.1.2 Cloud: Returns Management Software Market - Revenue and Forecast to 2031 (US$ Million)

8.2 On Premises

8.2.1 Overview

8.2.2 On Premises: Returns Management Software Market - Revenue and Forecast to 2031 (US$ Million)

9. Asia Pacific Returns Management Software Market Analysis - by Enterprise Size

9.1 Large Enterprises

9.1.1 Overview

9.1.2 Large Enterprises: Returns Management Software Market - Revenue and Forecast to 2031 (US$ Million)

9.2 SMEs

9.2.1 Overview

9.2.2 SMEs: Returns Management Software Market - Revenue and Forecast to 2031 (US$ Million)

10. Asia Pacific Returns Management Software Market - Country Analysis

10.1 Asia Pacific Market Overview

10.1.1 Asia Pacific: Returns Management Software Market - Revenue and Forecast Analysis - by Country

10.1.1.1 Asia Pacific: Returns Management Software Market - Revenue and Forecast Analysis - by Country

10.1.1.2 China: Returns Management Software Market - Revenue and Forecast to 2031 (US$ Million)

10.1.1.2.1 China: Returns Management Software Market Breakdown, by Component

10.1.1.2.2 China: Returns Management Software Market Breakdown, by Deployment

10.1.1.2.3 China: Returns Management Software Market Breakdown, by Enterprise Size

10.1.1.3 Japan: Returns Management Software Market - Revenue and Forecast to 2031 (US$ Million)

10.1.1.3.1 Japan: Returns Management Software Market Breakdown, by Component

10.1.1.3.2 Japan: Returns Management Software Market Breakdown, by Deployment

10.1.1.3.3 Japan: Returns Management Software Market Breakdown, by Enterprise Size

10.1.1.4 South Korea: Returns Management Software Market - Revenue and Forecast to 2031 (US$ Million)

10.1.1.4.1 South Korea: Returns Management Software Market Breakdown, by Component

10.1.1.4.2 South Korea: Returns Management Software Market Breakdown, by Deployment

10.1.1.4.3 South Korea: Returns Management Software Market Breakdown, by Enterprise Size

10.1.1.5 India: Returns Management Software Market - Revenue and Forecast to 2031 (US$ Million)

10.1.1.5.1 India: Returns Management Software Market Breakdown, by Component

10.1.1.5.2 India: Returns Management Software Market Breakdown, by Deployment

10.1.1.5.3 India: Returns Management Software Market Breakdown, by Enterprise Size

10.1.1.6 Australia: Returns Management Software Market - Revenue and Forecast to 2031 (US$ Million)

10.1.1.6.1 Australia: Returns Management Software Market Breakdown, by Component

10.1.1.6.2 Australia: Returns Management Software Market Breakdown, by Deployment

10.1.1.6.3 Australia: Returns Management Software Market Breakdown, by Enterprise Size

10.1.1.7 Rest of Asia Pacific: Returns Management Software Market - Revenue and Forecast to 2031 (US$ Million)

10.1.1.7.1 Rest of Asia Pacific: Returns Management Software Market Breakdown, by Component

10.1.1.7.2 Rest of Asia Pacific: Returns Management Software Market Breakdown, by Deployment

10.1.1.7.3 Rest of Asia Pacific: Returns Management Software Market Breakdown, by Enterprise Size

11. Competitive Landscape

11.1 Company Positioning & Concentration

11.2 Heat Map Analysis by Key Player

11.3 Company Market Global Share Analysis

11.4 Product Benchmarking

12. Industry Landscape

12.1 Overview

12.2 Market Initiative

12.3 New Product Development

12.4 Merger and Acquisition

13. Company Profiles

13.1 ReverseLogix

13.1.1 Key Facts

13.1.2 Business Description

13.1.3 Products and Services

13.1.4 Financial Overview

13.1.5 SWOT Analysis

13.1.6 Key Developments

13.2 United Parcel Service of America, Inc.

13.2.1 Key Facts

13.2.2 Business Description

13.2.3 Products and Services

13.2.4 Financial Overview

13.2.5 SWOT Analysis

13.2.6 Key Developments

13.3 SAP SE

13.3.1 Key Facts

13.3.2 Business Description

13.3.3 Products and Services

13.3.4 Financial Overview

13.3.5 SWOT Analysis

13.3.6 Key Developments

13.4 AfterShip

13.4.1 Key Facts

13.4.2 Business Description

13.4.3 Products and Services

13.4.4 Financial Overview

13.4.5 SWOT Analysis

13.4.6 Key Developments

14. Appendix

14.1 Word Index

14.2 About The Insight Partners


List of Tables

Table 1. Asia Pacific Returns Management Software Market Segmentation

Table 2. List of Vendors

Table 3. Returns Management Software Market - Revenue and Forecast to 2031 (US$ Million)

Table 4. Returns Management Software Market - Revenue and Forecast to 2031 (US$ Million) - by Component

Table 5. Returns Management Software Market - Revenue and Forecast to 2031 (US$ Million) - by Deployment

Table 6. Returns Management Software Market - Revenue and Forecast to 2031 (US$ Million) - by Enterprise Size

Table 7. Asia Pacific: Returns Management Software Market - Revenue and Forecast to 2031(US$ Million) - by Country

Table 8. China: Returns Management Software Market - Revenue and Forecast to 2031(US$ Million) - by Component

Table 9. China: Returns Management Software Market - Revenue and Forecast to 2031(US$ Million) - by Deployment

Table 10. China: Returns Management Software Market - Revenue and Forecast to 2031(US$ Million) - by Enterprise Size

Table 11. Japan: Returns Management Software Market - Revenue and Forecast to 2031(US$ Million) - by Component

Table 12. Japan: Returns Management Software Market - Revenue and Forecast to 2031(US$ Million) - by Deployment

Table 13. Japan: Returns Management Software Market - Revenue and Forecast to 2031(US$ Million) - by Enterprise Size

Table 14. South Korea: Returns Management Software Market - Revenue and Forecast to 2031(US$ Million) - by Component

Table 15. South Korea: Returns Management Software Market - Revenue and Forecast to 2031(US$ Million) - by Deployment

Table 16. South Korea: Returns Management Software Market - Revenue and Forecast to 2031(US$ Million) - by Enterprise Size

Table 17. India: Returns Management Software Market - Revenue and Forecast to 2031(US$ Million) - by Component

Table 18. India: Returns Management Software Market - Revenue and Forecast to 2031(US$ Million) - by Deployment

Table 19. India: Returns Management Software Market - Revenue and Forecast to 2031(US$ Million) - by Enterprise Size

Table 20. Australia: Returns Management Software Market - Revenue and Forecast to 2031(US$ Million) - by Component

Table 21. Australia: Returns Management Software Market - Revenue and Forecast to 2031(US$ Million) - by Deployment

Table 22. Australia: Returns Management Software Market - Revenue and Forecast to 2031(US$ Million) - by Enterprise Size

Table 23. Rest of Asia Pacific: Returns Management Software Market - Revenue and Forecast to 2031(US$ Million) - by Component

Table 24. Rest of Asia Pacific: Returns Management Software Market - Revenue and Forecast to 2031(US$ Million) - by Deployment

Table 25. Rest of Asia Pacific: Returns Management Software Market - Revenue and Forecast to 2031(US$ Million) - by Enterprise Size

Table 26. Heat Map Analysis by Key Player

Table 27. List of Abbreviation


List of Figures

Figure 1. Asia Pacific Returns Management Software Market Segmentation, by Country

Figure 2. Returns Management Software Market - Key Market Dynamics

Figure 3. Impact Analysis of Drivers and Restraints

Figure 4. Returns Management Software Market Revenue (US$ Million), 2021-2031

Figure 5. Returns Management Software Market Share (%) - by Component (2023 and 2031)

Figure 6. Software: Returns Management Software Market - Revenue and Forecast to 2031 (US$ Million)

Figure 7. Services: Returns Management Software Market - Revenue and Forecast to 2031 (US$ Million)

Figure 8. Returns Management Software Market Share (%) - by Deployment (2023 and 2031)

Figure 9. Cloud: Returns Management Software Market - Revenue and Forecast to 2031 (US$ Million)

Figure 10. On Premises: Returns Management Software Market - Revenue and Forecast to 2031 (US$ Million)

Figure 11. Returns Management Software Market Share (%) - by Enterprise Size (2023 and 2031)

Figure 12. Large Enterprises: Returns Management Software Market - Revenue and Forecast to 2031 (US$ Million)

Figure 13. SMEs: Returns Management Software Market - Revenue and Forecast to 2031 (US$ Million)

Figure 14. Asia Pacific Returns Management Software Market, by Key Countries - Revenue (2023) (US$ Million)

Figure 15. Asia Pacific: Returns Management Software Market Breakdown, by Key Countries, 2023 and 2031 (%)

Figure 16. China: Returns Management Software Market - Revenue and Forecast to 2031(US$ Million)

Figure 17. Japan: Returns Management Software Market - Revenue and Forecast to 2031(US$ Million)

Figure 18. South Korea: Returns Management Software Market - Revenue and Forecast to 2031(US$ Million)

Figure 19. India: Returns Management Software Market - Revenue and Forecast to 2031(US$ Million)

Figure 20. Australia: Returns Management Software Market - Revenue and Forecast to 2031(US$ Million)

Figure 21. Rest of Asia Pacific: Returns Management Software Market - Revenue and Forecast to 2031(US$ Million)

Figure 22. Company Positioning & Concentration

  1. ReverseLogix.
  2. United Parcel Service of America, Inc.
  3. SAP SE.
  4. AfterShip.
  • Save and reduce time carrying out entry-level research by identifying the growth, size, leading players, and segments in the Asia Pacific returns management software market.
  • Highlights key business priorities in order to assist companies to realign their business strategies.
  • The key findings and recommendations highlight crucial progressive industry trends in the Asia Pacific returns management software market, thereby allowing players across the value chain to develop effective long-term strategies.
  • Develop/modify business expansion plans by using substantial growth offering developed and emerging markets.
  • Scrutinize in-depth Asia Pacific market trends and outlook coupled with the factors driving the Asia Pacific returns management software market, as well as those hindering it.
  • Enhance the decision-making process by understanding the strategies that underpin commercial interest with respect to client products, segmentation, pricing, and distribution.
Report Code
Full Name
Country Name
Email Id
Phone Number
Job Title
Company
Requirement

Note : Your data will never be shared with third parties, however, we may send you information from time to time about our products that may be of interest to you. By submitting your details, you agree to be contacted by us. You may contact us at any time to opt-out.


Purchase Options
Single User License
$3550
$2485
Site License
$4550
$3185
Enterprise License
$5550
$3885