Asia Pacific Mining Chemicals Market Forecast to 2030 - Regional Analysis - by Type [Flotation Chemicals (Frothers, Flocculants, Depressants, Collectors, and Others), Solvent Extractants, Grinding Aids, and Others], Mineral Type (Base Metals, Non-Metallic Minerals, Precious Metals, and Others), and Application (Mineral Processing, Wastewater Treatment, and Others)

BMIRE00030199 | Pages: 132 | Chemicals and Materials | Jun 2024 | Type: Regional | Status: Published

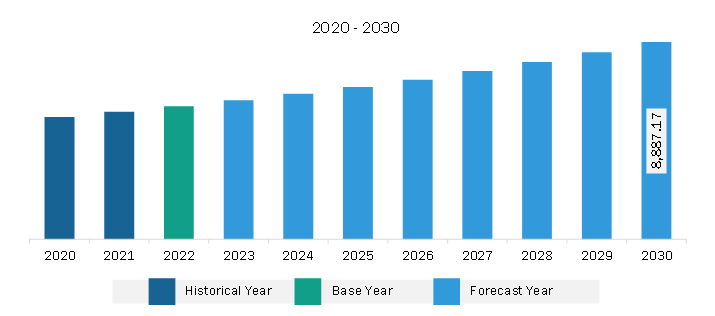
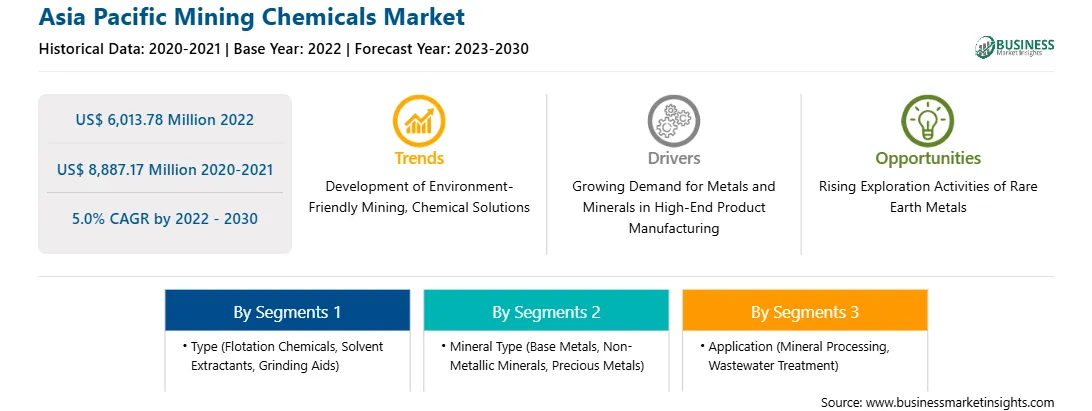
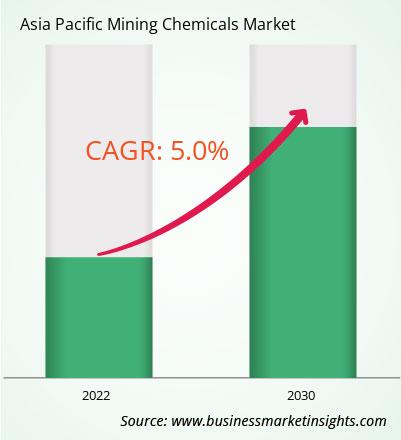
The Asia Pacific mining chemicals market was valued at US$ 6,013.78 million in 2022 and is expected to reach US$ 8,887.17 million by 2030; it is estimated to register at a CAGR of 5.0% from 2022 to 2030.

Increasing Investments and Operations in Global Mining Sector Boost Asia Pacific Mining Chemicals Market

The increase in mining activities worldwide has resulted in rising demand for mining chemicals. Further, the adoption of advanced mining technologies, such as automation and digitization, improves efficiency and environmental sustainability in mining operations globally. According to the World Bank, production of graphite, lithium, and cobalt is expected to rise by ~500% by 2050 to meet the growing demand for clean energy technologies.

The region is witnessing an increase in mining activities due to the discovery of new mineral deposits, growing infrastructure developments, and increasing demand for minerals and resources. Governments and organizations in countries such as Australia, China, the Czech Republic, Portugal, the US, Canada, and others are actively promoting exploration and mining activities. As per a report by the Green Finance and Development Centre, investments in the metals and mining industries in China reached US$ 10 billion in the first half of 2023, a rise of 131% compared to the same period in 2022. Further, in October 2023, the government of Australia invested an additional US$ 3.9 billion in the Export Finance Australia-managed Critical Minerals Facility. The funding targeted support for mining projects aligned with Australia's Critical Minerals Strategy 2023-2030. The expansion activities and rising investments in the mining sector drive the demand for mining chemicals.

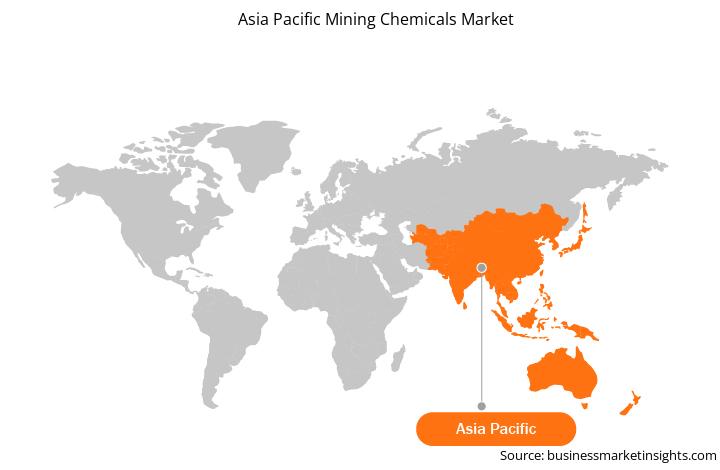
Asia Pacific Mining Chemicals Market Overview

Asia Pacific marks the presence of major mining companies such as Mitsubishi Materials Corporation, Jiangxi Copper Co Ltd, Aluminum Corporation of China Ltd, Coal India Limited, China Molybdenum Co Ltd, BHP, and others. Asia Pacific has 10 major surface mining projects-Green mine (China), Sangatta mine (Indonesia), Heidaigou mine (China), Oyu Tolgoi Copper-Gold mine (Mongolia), Gevra OC mine (India), Letpadaung Copper mine (Myanmar), Li mine (Thailand), FTB Project (Thailand), and Pasir mine (Indonesia). According to the report published by the US Geological Survey in 2022, China was the largest supplier of 25 non-fuel mineral commodities to several countries globally in 2021. Additionally, China is the producer of 16 critical minerals out of 25 listed minerals. According to research conducted by the Norwegian Institute of International Affairs in 2022, Central Asia recorded a presence of 38.6% of global manganese ore reserves, 30.07% of chromium, 20% of lead, 12.6% of zinc, 8.7% of titanium, 5.8% of aluminum, and 5.3% of copper.

China, Tajikistan, Australia, Vietnam, and other countries account for major antimony mine production and reserves worldwide. As per the World Mining Data 2022 report released by the Federal Ministry Republic of Austria, the mining production rate for minerals in Australia recorded a rise of 142.2% during 2000-2020. As per the International Energy Agency, Chinese companies doubled their investments in critical mineral exploration, especially in lithium projects. The demand for mining chemicals is directly proportional to the mining operations and mineral exploration activities in the region. Therefore, growth in mining operations bolsters the demand for mining chemicals in Asia Pacific.

Asia Pacific Mining Chemicals Market Revenue and Forecast to 2030 (US$ Million)

Get more information on this report :


Asia Pacific Mining Chemicals Market Segmentation

The Asia Pacific mining chemicals market is segmented based on type, mineral type, application, and country.

In terms of type, the Asia Pacific mining chemicals market is segmented into flotation chemicals, solvent extractants, grinding aids, and others. The flotation chemicals segment is sub-segmented into frothers, flocculants, depressants, collectors, and others. The flotation chemicals segment held the largest share in 2022.

By mineral type, the Asia Pacific mining chemicals market is segmented into base metals, non-metallic minerals, precious metals, and others. The non-metallic minerals segment held the largest share in 2022.

In terms of application, the Asia Pacific mining chemicals market is segmented into mineral processing, wastewater treatment, and others. The mineral processing segment held the largest share in 2022.

Based on country, the Asia Pacific mining chemicals market is categorized into Australia, China, India, Japan, South Korea, and the Rest of Asia Pacific. China dominated the Asia Pacific mining chemicals market in 2022.

Orica Ltd, Kemira Oyj, BASF SE, Clariant AG, Dow Inc, AECI Ltd, Nouryon Chemicals Holding BV, Solvay SA, and Arkema SA are some of the leading companies operating in the Asia Pacific mining chemicals market.

Table of Content


1. Introduction

1.1 The Insight Partners Research Report Guidance

1.2 Market Segmentation

2. Executive Summary

2.1 Key Insights

2.2 Market Attractiveness

2.2.1 Market Attractiveness

3. Research Methodology

3.1 Coverage

3.2 Secondary Research

3.3 Primary Research

4. Asia Pacific Mining Chemicals Market Landscape

4.1 Overview

4.2 Porter's Five Forces Analysis

4.2.1 Bargaining Power of Suppliers

4.2.2 Bargaining Power of Buyers

4.2.3 Threat of New Entrants

4.2.4 Competitive Rivalry

4.2.5 Threat of Substitutes

4.3 Ecosystem Analysis

4.3.1 Raw Material Suppliers:

4.3.2 Manufacturers:

4.3.3 Distributors or Suppliers:

4.3.4 End Use Industry:

4.4 List of Vendors in the Value Chain

5. Asia Pacific Mining Chemicals Market - Key Market Dynamics

5.1 Market Drivers

5.1.1 Growing Demand for Metals and Minerals in High-End Product Manufacturing

5.1.2 Increasing Investments and Operations in Global Mining Sector

5.2 Market Restraints

5.2.1 Stringent Government Regulations Related to Hazardous Mining Chemicals

5.3 Market Opportunities

5.3.1 Rising Exploration Activities of Rare Earth Metals

5.4 Future Trends

5.4.1 Development of Environment-Friendly Mining Chemical Solutions

5.5 Impact Analysis

6. Mining Chemicals Market - Asia Pacific Market Analysis

6.1 Asia Pacific Mining Chemicals Market Revenue (US$ Million), 2022 - 2030

6.2 Asia Pacific Mining Chemicals Market Forecast and Analysis

7. Asia Pacific Mining Chemicals Market Analysis - Type

7.1 Flotation Chemicals

7.1.1 Overview

7.1.2 Flotation Chemicals Market Revenue and Forecast to 2030 (US$ Million)

7.1.2.1 Flotation Chemicals Market Volume and Forecast to 2030 (Kilo tons)

7.1.3 Frothers

7.1.3.1 Overview

7.1.3.2 Frothers Market Revenue and Forecast to 2030 (US$ Million)

7.1.3.3 Frothers Market Volume and Forecast to 2030 (Kilo tons)

7.1.4 Flocculants

7.1.4.1 Overview

7.1.4.2 Flocculants Market Revenue and Forecast to 2030 (US$ Million)

7.1.4.3 Flocculants Market Volume and Forecast to 2030 (Kilo tons)

7.1.5 Depressants

7.1.5.1 Overview

7.1.5.2 Depressants Market Revenue and Forecast to 2030 (US$ Million)

7.1.5.3 Depressants Market Volume and Forecast to 2030 (Kilo tons)

7.1.6 Collectors

7.1.6.1 Overview

7.1.6.2 Collectors Market Revenue and Forecast to 2030 (US$ Million)

7.1.6.3 Collectors Market Volume and Forecast to 2030 (Kilo tons)

7.1.7 Others

7.1.7.1 Overview

7.1.7.2 Others Market Revenue and Forecast to 2030 (US$ Million)

7.1.7.3 Others Market Volume and Forecast to 2030 (Kilo tons)

7.2 Solvent Extractants

7.2.1 Overview

7.2.1.1 Solvent Extractants Market Revenue and Forecast to 2030 (US$ Million)

7.2.1.2 Solvent Extractants Market Volume and Forecast to 2030 (Kilo tons)

7.3 Grinding Aids

7.3.1 Overview

7.3.1.1 Grinding Aids Market Revenue and Forecast to 2030 (US$ Million)

7.3.1.2 Grinding Aids Market Volume and Forecast to 2030 (Kilo tons)

7.4 Others

7.4.1 Overview

7.4.1.1 Others Market Revenue and Forecast to 2030 (US$ Million)

7.4.1.2 Others Market Volume and Forecast to 2030 (Kilo tons)

8. Asia Pacific Mining Chemicals Market Analysis - Mineral Type

8.1 Base Metals

8.1.1 Overview

8.1.1.1 Base Metals Market Revenue and Forecast to 2030 (US$ Million)

8.2 Non-Metallic Minerals

8.2.1 Overview

8.2.1.1 Non-metallic minerals Market Revenue and Forecast to 2030 (US$ Million)

8.3 Precious Metals

8.3.1 Overview

8.3.1.1 Precious Metals Market Revenue and Forecast to 2030 (US$ Million)

8.4 Others

8.4.1 Overview

8.4.1.1 Others Market Revenue and Forecast to 2030 (US$ Million)

9. Asia Pacific Mining Chemicals Market Analysis - Application

9.1 Mineral Processing

9.1.1 Overview

9.1.1.1 Mineral Processing Market Revenue and Forecast to 2030 (US$ Million)

9.2 Wastewater Treatment

9.2.1 Overview

9.2.1.1 Wastewater Treatment Market Revenue and Forecast to 2030 (US$ Million)

9.3 Others

9.3.1 Overview

9.3.1.1 Others Market Revenue and Forecast to 2030 (US$ Million)

10. Asia Pacific Mining Chemicals Market - Country Analysis

10.1.1 Asia Pacific Mining Chemicals Market Revenue and Forecasts and Analysis - By Countries

10.1.1.1 Mining Chemicals market Breakdown by Country

10.1.1.2 Australia Mining Chemicals Market Volume and Forecasts to 2030 (Kilo tons)

10.1.1.3 Australia Mining Chemicals Market Revenue and Forecasts to 2030 (US$ Million)

10.1.1.3.1 Australia Mining Chemicals Market Breakdown by Type

10.1.1.3.2 Australia Mining Chemicals Market Breakdown by Type

10.1.1.3.3 Australia Mining Chemicals Market Breakdown by Mineral Type

10.1.1.3.4 Australia Mining Chemicals Market Breakdown by Application

10.1.1.4 China Mining Chemicals Market Volume and Forecasts to 2030 (Kilo tons)

10.1.1.5 China Mining Chemicals Market Revenue and Forecasts to 2030 (US$ Million)

10.1.1.5.1 China Mining Chemicals Market Breakdown by Type

10.1.1.5.2 China Mining Chemicals Market Breakdown by Type

10.1.1.5.3 China Mining Chemicals Market Breakdown by Mineral Type

10.1.1.5.4 China Mining Chemicals Market Breakdown by Application

10.1.1.6 India Mining Chemicals Market Volume and Forecasts to 2030 (Kilo tons)

10.1.1.7 India Mining Chemicals Market Revenue and Forecasts to 2030 (US$ Million)

10.1.1.7.1 India Mining Chemicals Market Breakdown by Type

10.1.1.7.2 India Mining Chemicals Market Breakdown by Type

10.1.1.7.3 India Mining Chemicals Market Breakdown by Mineral Type

10.1.1.7.4 India Mining Chemicals Market Breakdown by Application

10.1.1.8 Japan Mining Chemicals Market Volume and Forecasts to 2030 (Kilo tons)

10.1.1.9 Japan Mining Chemicals Market Revenue and Forecasts to 2030 (US$ Million)

10.1.1.9.1 Japan Mining Chemicals Market Breakdown by Type

10.1.1.9.2 Japan Mining Chemicals Market Breakdown by Type

10.1.1.9.3 Japan Mining Chemicals Market Breakdown by Mineral Type

10.1.1.9.4 Japan Mining Chemicals Market Breakdown by Application

10.1.1.10 South Korea Mining Chemicals Market Volume and Forecasts to 2030 (Kilo tons)

10.1.1.11 South Korea Mining Chemicals Market Revenue and Forecasts to 2030 (US$ Million)

10.1.1.11.1 South Korea Mining Chemicals Market Breakdown by Type

10.1.1.11.2 South Korea Mining Chemicals Market Breakdown by Type

10.1.1.11.3 South Korea Mining Chemicals Market Breakdown by Mineral Type

10.1.1.11.4 South Korea Mining Chemicals Market Breakdown by Application

10.1.1.12 Rest of Asia Pacific Mining Chemicals Market Volume and Forecasts to 2030 (Kilo tons)

10.1.1.13 Rest of Asia Pacific Mining Chemicals Market Revenue and Forecasts to 2030 (US$ Million)

10.1.1.13.1 Rest of Asia Pacific Mining Chemicals Market Breakdown by Type

10.1.1.13.2 Rest of Asia Pacific Mining Chemicals Market Breakdown by Type

10.1.1.13.3 Rest of Asia Pacific Mining Chemicals Market Breakdown by Mineral Type

10.1.1.13.4 Rest of Asia Pacific Mining Chemicals Market Breakdown by Application

11. Industry Landscape

11.1 Overview

11.2 Product launch

11.3 Other Strategies and Developments

12. Company Profiles

12.1 Orica Ltd

12.1.1 Key Facts

12.1.2 Business Description

12.1.3 Products and Services

12.1.4 Financial Overview

12.1.5 SWOT Analysis

12.1.6 Key Developments

12.2 Kemira Oyj

12.2.1 Key Facts

12.2.2 Business Description

12.2.3 Products and Services

12.2.4 Financial Overview

12.2.5 SWOT Analysis

12.2.6 Key Developments

12.3 BASF SE

12.3.1 Key Facts

12.3.2 Business Description

12.3.3 Products and Services

12.3.4 Financial Overview

12.3.5 SWOT Analysis

12.3.6 Key Developments

12.4 Clariant AG

12.4.1 Key Facts

12.4.2 Business Description

12.4.3 Products and Services

12.4.4 Financial Overview

12.4.5 SWOT Analysis

12.4.6 Key Developments

12.5 Dow Inc

12.5.1 Key Facts

12.5.2 Business Description

12.5.3 Products and Services

12.5.4 Financial Overview

12.5.5 SWOT Analysis

12.5.6 Key Developments

12.6 AECI Ltd

12.6.1 Key Facts

12.6.2 Business Description

12.6.3 Products and Services

12.6.4 Financial Overview

12.6.5 SWOT Analysis

12.6.6 Key Developments

12.7 Nouryon Chemicals Holding BV

12.7.1 Key Facts

12.7.2 Business Description

12.7.3 Products and Services

12.7.4 Financial Overview

12.7.5 SWOT Analysis

12.7.6 Key Developments

12.8 Solvay SA

12.8.1 Key Facts

12.8.2 Business Description

12.8.3 Products and Services

12.8.4 Financial Overview

12.8.5 SWOT Analysis

12.8.6 Key Developments

12.9 Arkema SA

12.9.1 Key Facts

12.9.2 Business Description

12.9.3 Products and Services

12.9.4 Financial Overview

12.9.5 SWOT Analysis

12.9.6 Key Developments

13. Appendix

List of Tables

Table 1. Asia Pacific Mining Chemicals Market Segmentation

Table 2. List of Raw Material Suppliers

Table 3. Asia Pacific Mining Chemicals Market Revenue and Forecasts to 2030 (US$ Million)

Table 4. Asia Pacific Mining Chemicals Market Volume and Forecasts to 2030 (Kilo tons) - Type

Table 5. Asia Pacific Mining Chemicals Market Revenue and Forecasts to 2030 (US$ Million) - Type

Table 6. Asia Pacific Mining Chemicals Market Revenue and Forecasts to 2030 (US$ Million) - Mineral Type

Table 7. Asia Pacific Mining Chemicals Market Revenue and Forecasts to 2030 (US$ Million) - Application

Table 8. Australia Mining Chemicals Market Volume and Forecasts to 2030 (Kilo tons) - By Type

Table 9. Australia Mining Chemicals Market Revenue and Forecasts to 2030 (US$ Million) - By Type

Table 10. Australia Mining Chemicals Market Revenue and Forecasts to 2030 (US$ Million) - By Mineral Type

Table 11. Australia Mining Chemicals Market Revenue and Forecasts to 2030 (US$ Million) - By Application

Table 12. China Mining Chemicals Market Volume and Forecasts to 2030 (Kilo tons) - By Type

Table 13. China Mining Chemicals Market Revenue and Forecasts to 2030 (US$ Million) - By Type

Table 14. China Mining Chemicals Market Revenue and Forecasts to 2030 (US$ Million) - By Mineral Type

Table 15. China Mining Chemicals Market Revenue and Forecasts to 2030 (US$ Million) - By Application

Table 16. India Mining Chemicals Market Volume and Forecasts to 2030 (Kilo tons) - By Type

Table 17. India Mining Chemicals Market Revenue and Forecasts to 2030 (US$ Million) - By Type

Table 18. India Mining Chemicals Market Revenue and Forecasts to 2030 (US$ Million) - By Mineral Type

Table 19. India Mining Chemicals Market Revenue and Forecasts to 2030 (US$ Million) - By Application

Table 20. Japan Mining Chemicals Market Volume and Forecasts to 2030 (Kilo tons) - By Type

Table 21. Japan Mining Chemicals Market Revenue and Forecasts to 2030 (US$ Million) - By Type

Table 22. Japan Mining Chemicals Market Revenue and Forecasts to 2030 (US$ Million) - By Mineral Type

Table 23. Japan Mining Chemicals Market Revenue and Forecasts to 2030 (US$ Million) - By Application

Table 24. South Korea Mining Chemicals Market Revenue and Forecasts to 2030 (US$ Million) - By Type

Table 25. South Korea Mining Chemicals Market Revenue and Forecasts to 2030 (US$ Million) - By Type

Table 26. South Korea Mining Chemicals Market Revenue and Forecasts to 2030 (US$ Million) - By Mineral Type

Table 27. South Korea Mining Chemicals Market Revenue and Forecasts to 2030 (US$ Million) - By Application

Table 28. Rest of Asia Pacific Mining Chemicals Market Volume and Forecasts to 2030 (Kilo tons) - By Type

Table 29. Rest of Asia Pacific Mining Chemicals Market Revenue and Forecasts to 2030 (US$ Million) - By Type

Table 30. Rest of Asia Pacific Mining Chemicals Market Revenue and Forecasts to 2030 (US$ Million) - By Mineral Type

Table 31. Rest of Asia Pacific Mining Chemicals Market Revenue and Forecasts to 2030 (US$ Million) - By Application

List of Figures

Figure 1. Asia Pacific Mining Chemicals Market Segmentation, By Country

Figure 2. Porter's Five Forces Analysis

Figure 3. Ecosystem: Asia Pacific Mining Chemicals Market

Figure 4. Asia Pacific Mining Chemicals Market Impact Analysis of Drivers and Restraints

Figure 5. Asia Pacific Mining Chemicals Market Revenue (US$ Million), 2022 - 2030

Figure 6. Asia Pacific Mining Chemicals Market Share (%) - Type, 2022 and 2030

Figure 7. Flotation Chemicals Market Revenue and Forecasts to 2030 (US$ Million)

Figure 8. Flotation Chemicals Market Volume and Forecasts to 2030 (Kilo tons)

Figure 9. Frothers Market Revenue and Forecasts to 2030 (US$ Million)

Figure 10. Frothers Market Volume and Forecasts to 2030 (Kilo tons)

Figure 11. Flocculants Market Revenue and Forecasts to 2030 (US$ Million)

Figure 12. Flocculants Market Volume and Forecasts to 2030 (Kilo tons)

Figure 13. Depressants Market Revenue and Forecasts to 2030 (US$ Million)

Figure 14. Depressants Market Volume and Forecasts to 2030 (Kilo tons)

Figure 15. Collectors Market Revenue and Forecasts to 2030 (US$ Million)

Figure 16. Collectors Market Volume and Forecasts to 2030 (Kilo tons)

Figure 17. Others Market Revenue and Forecasts to 2030 (US$ Million)

Figure 18. Others Market Volume and Forecasts to 2030 (Kilo tons)

Figure 19. Solvent Extractants Market Revenue and Forecasts to 2030 (US$ Million)

Figure 20. Solvent Extractants Market Volume and Forecasts to 2030 (Kilo tons)

Figure 21. Grinding Aids Market Revenue and Forecasts to 2030 (US$ Million)

Figure 22. Grinding Aids Market Volume and Forecasts to 2030 (Kilo tons)

Figure 23. Others Market Revenue and Forecasts to 2030 (US$ Million)

Figure 24. Others Market Volume and Forecasts to 2030 (Kilo tons)

Figure 25. Asia Pacific Mining Chemicals Market Share (%) - Mineral Type, 2022 and 2030

Figure 26. Base Metals Market Revenue and Forecasts to 2030 (US$ Million)

Figure 27. Non-Metallic Minerals Market Revenue and Forecasts to 2030 (US$ Million)

Figure 28. Precious Metals Market Revenue and Forecasts to 2030 (US$ Million)

Figure 29. Others Market Revenue and Forecasts to 2030 (US$ Million)

Figure 30. Asia Pacific Mining Chemicals Market Share (%) - Application, 2022 and 2030

Figure 31. Mineral Processing Market Revenue and Forecasts to 2030 (US$ Million)

Figure 32. Wastewater Treatment Market Revenue and Forecasts to 2030 (US$ Million)

Figure 33. Others Market Revenue and Forecasts to 2030 (US$ Million)

Figure 34. Asia Pacific Mining Chemicals Market Breakdown, by Key Countries, 2022 (US$)

Figure 35. Mining Chemicals market Breakdown by Key Countries, 2022 and 2030 (%)

Figure 36. Australia Mining Chemicals Market Volume and Forecasts to 2030 (Kilo tons)

Figure 37. Australia Mining Chemicals Market Revenue and Forecasts to 2030 (US$ Million)

Figure 38. China Mining Chemicals Market Volume and Forecasts to 2030 (Kilo tons)

Figure 39. China Mining Chemicals Market Revenue and Forecasts to 2030 (US$ Million)

Figure 40. India Mining Chemicals Market Volume and Forecasts to 2030 (Kilo tons)

Figure 41. India Mining Chemicals Market Revenue and Forecasts to 2030 (US$ Million)

Figure 42. Japan Mining Chemicals Market Volume and Forecasts to 2030 (Kilo tons)

Figure 43. Japan Mining Chemicals Market Revenue and Forecasts to 2030 (US$ Million)

Figure 44. South Korea Mining Chemicals Market Volume and Forecasts to 2030 (Kilo tons)

Figure 45. South Korea Mining Chemicals Market Revenue and Forecasts to 2030 (US$ Million)

Figure 46. Rest of Asia Pacific Mining Chemicals Market Volume and Forecasts to 2030 (Kilo tons)

Figure 47. Rest of Asia Pacific Mining Chemicals Market Revenue and Forecasts to 2030 (US$ Million)


1. Orica Ltd

2. Kemira Oyj

3. BASF SE

4. Clariant AG

5. Dow Inc

6. AECI Ltd

7. Nouryon Chemicals Holding BV

8. Solvay SA

9. Arkema SA

  • Save and reduce time carrying out entry-level research by identifying the growth, size, leading players, and segments in the Asia Pacific mining chemicals market.
  • Highlights key business priorities in order to assist companies to realign their business strategies.
  • The key findings and recommendations highlight crucial progressive industry trends in Asia Pacific mining chemicals market, thereby allowing players across the value chain to develop effective long-term strategies.
  • Develop/modify business expansion plans by using substantial growth offering developed and emerging markets.
  • Scrutinize in-depth Asia Pacific market trends and outlook coupled with the factors driving the market, as well as those hindering it.
  • Enhance the decision-making process by understanding the strategies that underpin security interest with respect to client products, segmentation, pricing, and distribution.
Report Code
Full Name
Country Name
Email Id
Phone Number
Job Title
Company
Requirement

Note : Your data will never be shared with third parties, however, we may send you information from time to time about our products that may be of interest to you. By submitting your details, you agree to be contacted by us. You may contact us at any time to opt-out.


Purchase Options
Single User License
$3550
$2840
Site License
$4550
$3640
Enterprise License
$5550
$4440