Asia Pacific Metabolomics Services Market Forecast to 2028 - COVID-19 Impact and Regional Analysis By Service Type (Targeted Metabolomics Service and Untargeted Metabolomics Service) and Application (Pharmaceutical and Biotechnology Industry, Agritech, and Environment)

TIPRE00026146 | Pages: 138 | Biotechnology | Dec 2021 | Type: Regional | Status: Published

Market Introduction

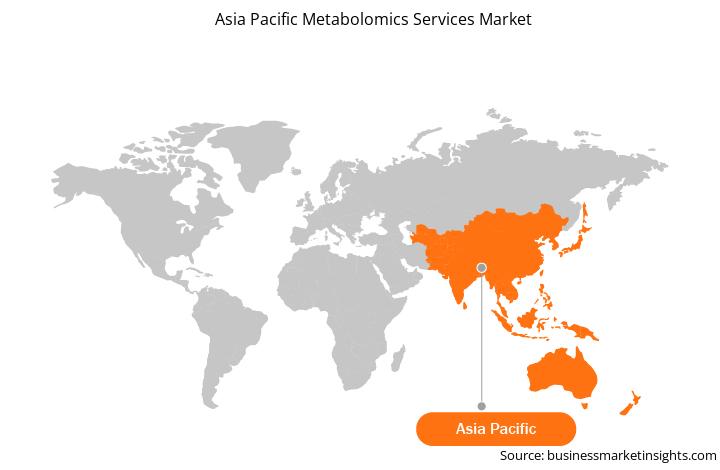
Asia Pacific (APAC) is the fastest-growing regional market for metabolomics services; and China, India, Japan, South Korea, Australia, and Rest of APAC are the major contributors to the market in this region. Asia Pacific is likely to account for over 25.68% market share of the global metabolomics services market in 2021 owing to the growing investments from international players in China and India, improving government support in countries, expanding base of CRO services, and advancing healthcare infrastructure. Therefore, the region holds huge potential for the metabolomics services market players to grow during the forecast period. The Japanese healthcare industry is witnessing massive developments and financial aids to accelerate its adoption and acceptance of cell therapy-based products. The government focuses on developing laws and policies to bolster the innovations and discoveries in novel diagnostics and therapeutics such as regenerative medicine. The country has the presence of contract research organizations which in turn is expected to support the market growth. The players in the related markets are actively investing in Japan. Development opportunities in several countries is the major factor driving the growth of the APAC metabolomics services market.

As a result of the ongoing COVID-19 pandemic, the healthcare sector is under tremendous pressure. The containment and social distancing measures have led to disruption in supply chains. Moreover, the demand for efficient diagnostics and treatments of COVID-19 has gained huge paramount importance in Asia Pacific. India, China, Japan, and South Korea are among the countries in the region that are experiencing various adverse effects due to the pandemic, which include damaged socioeconomics, inflation, low GDPs, and unemployment surge. Countries such as China, Japan, Singapore, and South Korea engaged in rapid clinical trials. High costs of operations in western countries drive the flow of medical affairs outsourcing to Asia Pacific. To leverage these opportunities, pharmaceutical companies in this region gaining expertise on new and changing regulatory environments for drugs, devices, and in-vitro diagnostics. New or improved regulations are implemented frequently in Asia, including changes in GMP standards, drug price controls, and medical device regulatory systems. Third-party guidance and advice are required for any new standard acquisition or improvements. Increasingly, third-party outsourcing service providers are playing a more significant role in supporting the associated markets in Asia Pacific. As of 2021, the market has stabilized owing to control procedures, awareness among people, vaccine development and administration, and supportive government policies boosting business growth.


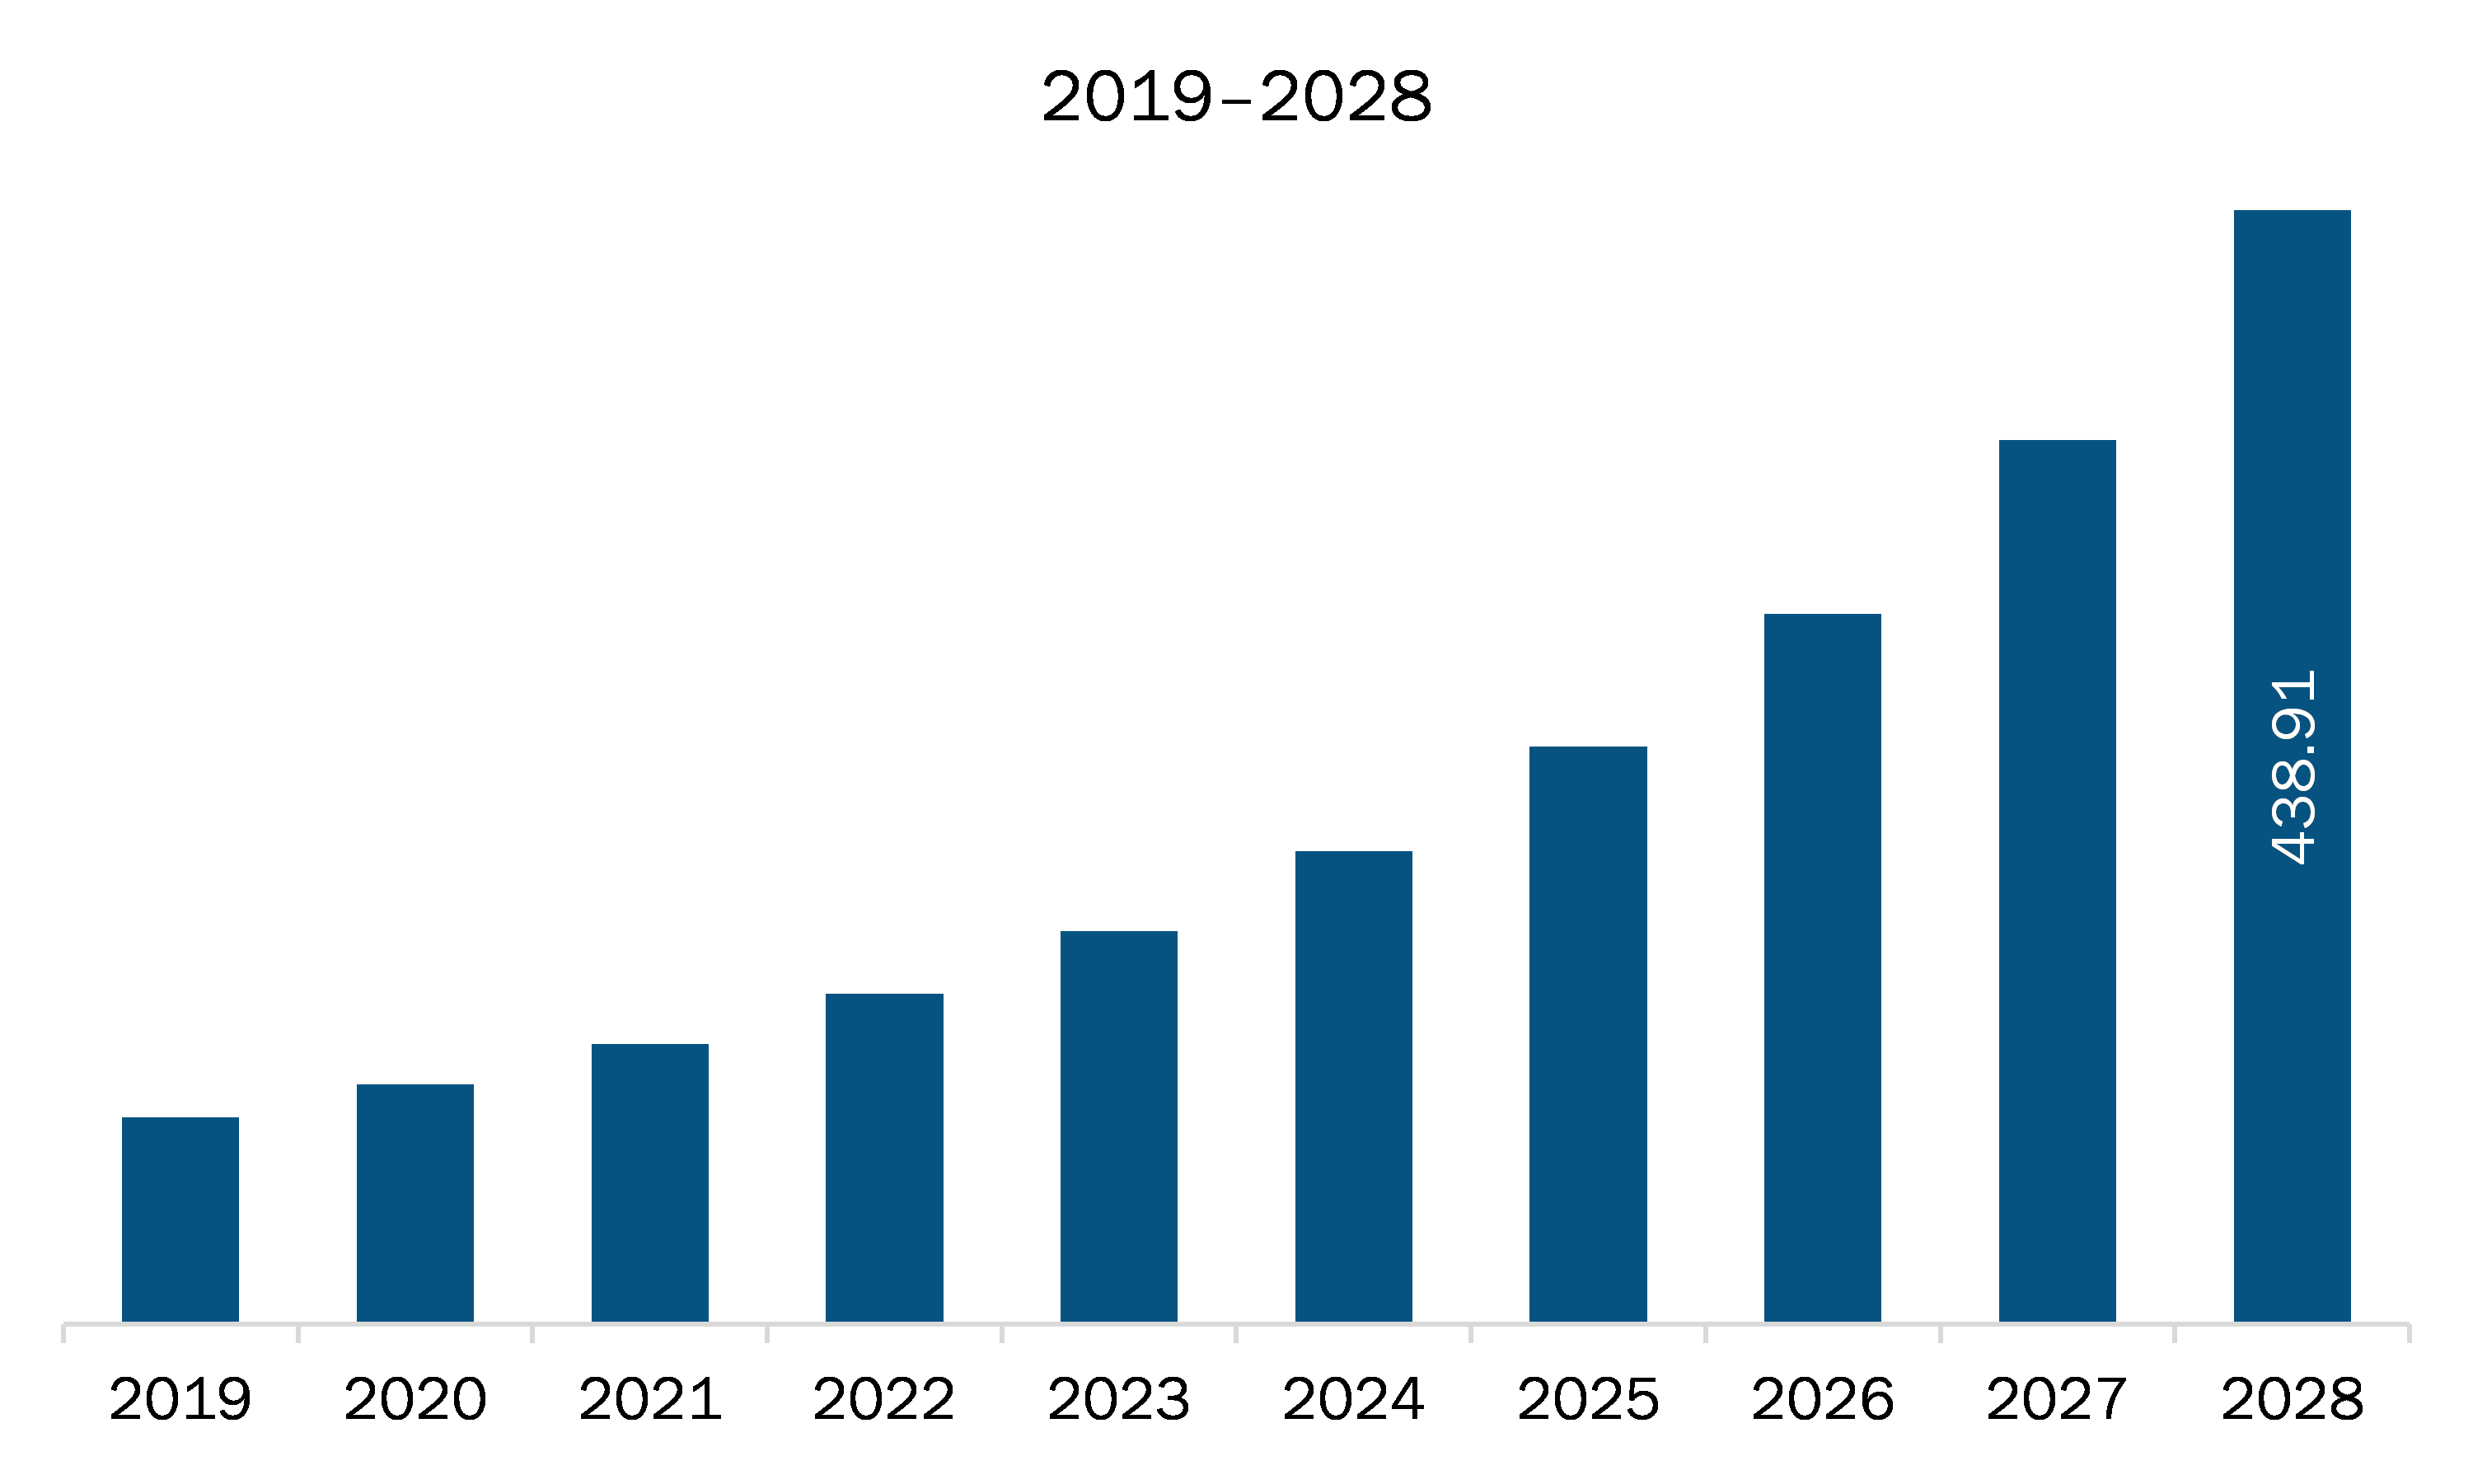
Get more information on this report :


Market Overview and Dynamics

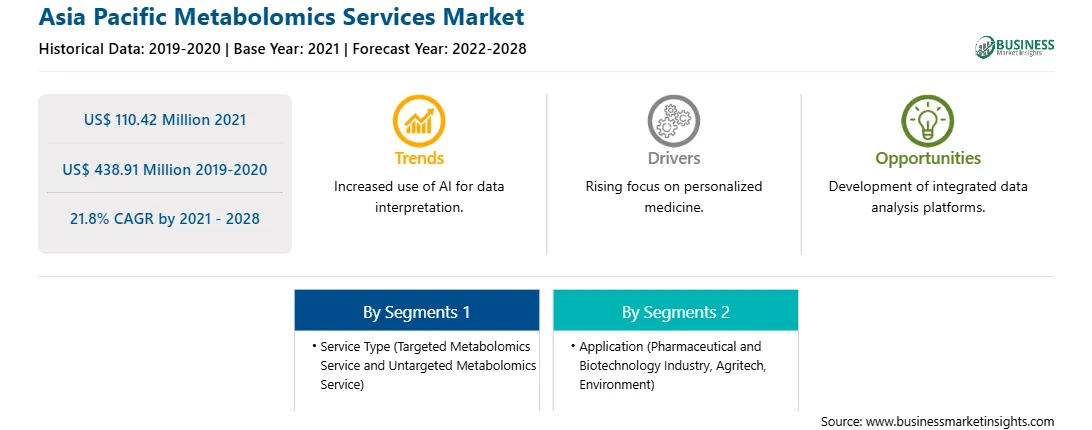
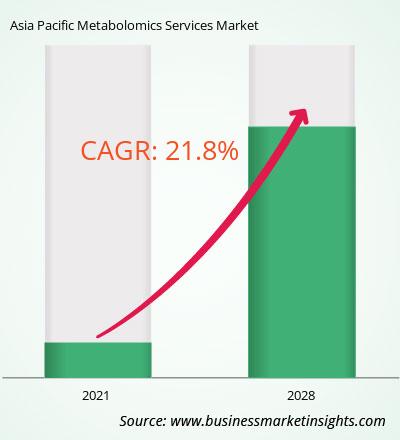
The metabolomics services market in APAC is expected to grow from US$ 110.42 million in 2021 to US$ 438.91 million by 2028; it is estimated to grow at a CAGR of 21.8% from 2021 to 2028. Metabolomics is among the growing and robust technologies for detecting a wide range of metabolites in tissues and biofluids. This process has a significant application in the analysis and studies associated with cancer disease. The rising prevalence of different types of cancer is expected to drive the market during the forecast period. Cancer diagnostics play an essential role in cancer treatment. As per the data published by the World Health Organization (WHO) in September 2021, nearly 70% of deaths from cancer were reported from the low- and mid-income countries across the region. Therefore, rising incidences of cancer is expected to surge the demand of metabolomics services, thereby driving the market growth.

Key Market Segments

The APAC metabolomics services market has been segmented based on service type, application, and country. On the basis of service type, the APAC metabolomics services market is segmented into targeted metabolomics service and untargeted metabolomics service. The targeted metabolomics service segment dominated the market in 2020 and is expected to be the fastest growing during the forecast period. Based on application, the market is segmented into pharmaceutical and biotechnology industry, agritech, and environment. The pharmaceutical and biotechnology industry segment dominated the market in 2020 and is expected to be the fastest growing during the forecast period. Likewise, the pharmaceutical and biotechnology industry segmented is categorized into biomarker discovery, drug discovery, toxicological testing, and others.

Major Sources and Companies Listed

A few major primary and secondary sources referred to for preparing this report on metabolomics services market in APAC are company websites, annual reports, financial reports, national government documents, and statistical database, among others. Major companies listed in the report are BASF SE, BGI, biocrates life sciences ag, C-CAMP, Chenomx Inc., Creative Proteomics, Fred Hutchinson Cancer Research Center, and RTI International are among others.

Reasons to buy report

  • To understand the APAC metabolomics services market landscape and identify market segments that are most likely to guarantee a strong return
  • Stay ahead of the race by comprehending the ever-changing competitive landscape for APAC metabolomics services market
  • Efficiently plan M&A and partnership deals in APAC metabolomics services market by identifying market segments with the most promising probable sales
  • Helps to take knowledgeable business decisions from perceptive and comprehensive analysis of market performance of various segment form APAC metabolomics services market
  • Obtain market revenue forecast for market by various segments from 2021-2028 in APAC region.

APAC Metabolomics Services Market Segmentation

APAC Metabolomics Services Market –By Service Type

  • Targeted Metabolomics Service
  • Untargeted Metabolomics Service

APAC Metabolomics Services Market –By Application

  • Pharmaceutical and Biotechnology Industry
    • Biomarker Discovery
    • Drug Discovery
    • Toxicological Testing
    • Others
  • Agritech
  • Environment

APAC Metabolomics Services Market -By Country

  • Japan
  • China
  • India
  • Australia
  • South Korea
  • Rest of APAC

APAC Metabolomics Services Market -Company Profiles

  • BASF SE
  • BGI
  • biocrates life sciences ag
  • C-CAMP
  • Chenomx Inc.
  • Creative Proteomics
  • Fred Hutchinson Cancer Research Center
  • RTI International

1.           Introduction

1.1         Scope of the Study

1.2         The Insight Partners Research Report Guidance

1.3         Market Segmentation

1.3.1        APAC Metabolomics Services Market – By Service Type

1.3.2        APAC Metabolomics Services Market – By Application

1.3.3        APAC Metabolomics Services Market – By Country

2.           Key Takeaways

3.        Research Methodology

3.1         Coverage

3.2         Secondary Research

3.3         Primary Research

4.           APAC Metabolomics Services Market – Market Landscape

4.1         Overview

4.2         APAC PEST Analysis

4.3         Experts Opinion

5.           APAC Metabolomics Services Market – Key Market Dynamics

5.1         Market Drivers

5.1.1        Soaring Incidences of Cancer

5.1.2        Increasing Adoption of Metabolomics and Investments by Market Players

5.2         Market Restraints

5.2.1        High Cost of Tools, Instruments, and Usage

5.3         Market Opportunities

5.3.1        Development Opportunities in Several Countries

5.4         Future Trends

5.4.1        Usage of Artificial Intelligence (AI) and Biomarkers in Biomarker-Related Analysis and Personalized Therapy

5.5         Impact Analysis

6.           Metabolomics Services Market– APAC Analysis

6.1         APAC Metabolomics Services Market Revenue Forecast and Analysis

7.           APAC Metabolomics Services Market Revenue and Forecasts to 2028– by Service Type

7.1         Overview

7.2         APAC Metabolomics Services Market, By Service Type 2021 & 2028 (%)

7.3         Targeted Metabolomics Service

7.3.1        Overview

7.3.2        Targeted Metabolomics Service: Metabolomics Services Market Revenue and Forecasts to 2028 (US$ Mn)

7.4         Untargeted Metabolomics Service

7.4.1        Overview

7.4.2        Untargeted Metabolomics Service: Metabolomics Services Market Revenue and Forecasts to 2028 (US$ Mn)

8.           APAC Metabolomics Services Market Revenue and Forecasts to 2028 – by Application

8.1         Overview

8.2         APAC Metabolomics Services Market Share by Application 2021 & 2028 (%)

8.3         Pharmaceutical and Biotechnology Industry

8.3.1        Overview

8.3.2        Pharmaceutical and Biotechnology Industry: Metabolomics Services Market Revenue and Forecast to 2028 (US$ Mn)

8.3.2.1          Biomarker Discovery

8.3.2.1.1          Overview

8.3.2.1.2          Biomarker Discovery: Metabolomics Services Market Revenue and Forecast to 2028 (US$ Mn)

8.3.2.2          Toxicological Testing

8.3.2.2.1          Overview

8.3.2.2.2          Toxicological Testing: Metabolomics Services Market Revenue and Forecast to 2028 (US$ Mn)

8.3.2.3          Drug Discovery

8.3.2.3.1          Overview

8.3.2.3.2          Drug Discovery: Metabolomics Services Market Revenue and Forecast to 2028 (US$ Mn)

8.3.2.4          Others

8.3.2.4.1          Overview

8.3.2.4.2          Others: Metabolomics Services Market Revenue and Forecast to 2028 (US$ Mn)

8.4         Agritech

8.4.1        Overview

8.4.2        Agritech: Metabolomics Services Market Revenue and Forecast to 2028 (US$ Mn)

8.5         Environment

8.5.1        Overview

8.5.2        Environment: Metabolomics Services Market Revenue and Forecast to 2028 (US$ Mn)

9.           APAC Metabolomics Services Market Revenue and Forecasts to 2028 – Country Analysis

9.1.1        Asia Pacific: Metabolomics Services Market Revenue and Forecasts to 2028, By Country (%)

9.1.1.1          Japan: Metabolomics Services Market Revenue and Forecasts to 2028 (US$ Mn)

9.1.1.1.1          Overview

9.1.1.1.2          Japan: Metabolomics Services Market Revenue and Forecasts to 2028 (US$ Mn)

9.1.1.1.3          Japan: Metabolomics Services Market Revenue and Forecasts to 2028, By Service Type (US$ Mn)

9.1.1.1.4          Japan: Metabolomics Services Market Revenue and Forecasts to 2028, By Application (US$ Mn)

9.1.1.1.4.1       Japan: Metabolomics Services Market, by Pharmaceutical and Biotechnology Industry – Revenue and Forecast to 2028 (USD Million)

9.1.1.2          China: Metabolomics Services Market Revenue and Forecasts to 2028 (US$ Mn)

9.1.1.2.1          Overview

9.1.1.2.2          China: Metabolomics Services Market Revenue and Forecasts to 2028 (US$ Mn)

9.1.1.2.3          China: Metabolomics Services Market Revenue and Forecasts to 2028, By Service Type (US$ Mn)

9.1.1.2.4          China: Metabolomics Services Market Revenue and Forecasts to 2028, By Application (US$ Mn)

9.1.1.2.4.1       China: Metabolomics Services Market, by Pharmaceutical and Biotechnology Industry – Revenue and Forecast to 2028 (USD Million)

9.1.1.3          India Metabolomics Services Market Revenue and Forecasts to 2028 (US$ Mn)

9.1.1.3.1          Overview

9.1.1.3.2          India: Metabolomics Services Market Revenue and Forecasts to 2028 (US$ Mn)

9.1.1.3.3          India: Metabolomics Services Market Revenue and Forecasts to 2028, By Service Type (US$ Mn)

9.1.1.3.4          India: Metabolomics Services Market Revenue and Forecasts to 2028, By Application (US$ Mn)

9.1.1.3.4.1       India: Metabolomics Services Market, by Pharmaceutical and Biotechnology Industry – Revenue and Forecast to 2028 (USD Million)

9.1.1.4          South Korea: Metabolomics Services Market Revenue and Forecasts to 2028 (US$ Mn)

9.1.1.4.1          Overview

9.1.1.4.2          South Korea: Metabolomics Services Market Revenue and Forecasts to 2028 (US$ Mn)

9.1.1.4.3          South Korea: Metabolomics Services Market Revenue and Forecasts to 2028, By Service Type (US$ Mn)

9.1.1.4.4          South Korea: Metabolomics Services Market Revenue and Forecasts to 2028, By Application (US$ Mn)

9.1.1.4.4.1       South Korea: Metabolomics Services Market, by Pharmaceutical and Biotechnology Industry – Revenue and Forecast to 2028 (USD Million)

9.1.1.5          Australia: Metabolomics Services Market Revenue and Forecasts to 2028(US$ Mn)

9.1.1.5.1          Overview

9.1.1.5.2          Australia: Metabolomics Services Market Revenue and Forecasts to 2028 (US$ Mn)

9.1.1.5.3          Australia: Metabolomics Services Market Revenue and Forecasts to 2028, By Service Type (US$ Mn)

9.1.1.5.4          Australia: Metabolomics Services Market Revenue and Forecasts to 2028, By Application (US$ Mn)

9.1.1.5.4.1       Australia: Metabolomics Services Market, by Pharmaceutical and Biotechnology Industry – Revenue and Forecast to 2028 (USD Million)

9.1.1.6          Rest of Asia Pacific: Metabolomics Services Market – Revenue and Forecast to 2028 (USD Million)

9.1.1.6.1          Overview

9.1.1.6.2          Rest of Asia Pacific: Metabolomics Services Market – Revenue and Forecast to 2028 (USD Million)

9.1.1.6.3          Rest of Asia Pacific: Metabolomics Services Market Revenue and Forecasts to 2028, By Service Type (US$ Mn)

9.1.1.6.4          Rest of Asia Pacific: Metabolomics Services Market Revenue and Forecasts to 2028, By Application (US$ Mn)

9.1.1.6.4.1       Rest of Asia Pacific: Metabolomics Services Market, by Pharmaceutical and Biotechnology Industry – Revenue and Forecast to 2028 (USD Million)

10.        Impact Of COVID-19 Pandemic on APAC Metabolomics Services Market

10.1      Overview

11.        APAC Metabolomics Services Market–Industry Landscape

11.1      Overview

11.2      Organic Developments

11.2.1     Overview

11.3      Inorganic Developments

11.3.1     Overview

12.        Company Profiles

12.1      BASF SE

12.1.1     Key Facts

12.1.2     Business Description

12.1.3     Products and Services

12.1.4     Financial Overview

12.1.5     SWOT Analysis

12.1.6     Key Developments

12.2      Creative Proteomics

12.2.1     Key Facts

12.2.2     Business Description

12.2.3     Products and Services

12.2.4     Financial Overview

12.2.5     SWOT Analysis

12.2.6     Key Developments

12.3      BGI

12.3.1     Key Facts

12.3.2     Business Description

12.3.3     Products and Services

12.3.4     Financial Overview

12.3.5     SWOT Analysis

12.3.6     Key Developments

12.4      RTI International

12.4.1     Key Facts

12.4.2     Business Description

12.4.3     Products and Services

12.4.4     Financial Overview

12.4.5     SWOT Analysis

12.4.6     Key Developments

12.5      Fred Hutchinson Cancer Research Center

12.5.1     Key Facts

12.5.2     Business Description

12.5.3     Products and Services

12.5.4     Financial Overview

12.5.5     SWOT Analysis

12.5.6     Key Developments

12.6      biocrates life sciences ag

12.6.1     Key Facts

12.6.2     Business Description

12.6.3     Products and Services

12.6.4     Financial Overview

12.6.5     SWOT Analysis

12.6.6     Key Developments

12.7      Chenomx Inc.

12.7.1     Key Facts

12.7.2     Business Description

12.7.3     Products and Services

12.7.4     Financial Overview

12.7.5     SWOT Analysis

12.7.6     Key Developments

12.8      C-CAMP

12.8.1     Key Facts

12.8.2     Business Description

12.8.3     Products and Services

12.8.4     Financial Overview

12.8.5     SWOT Analysis

12.8.6     Key Developments

13.        Appendix

13.1      About The Insight Partners

13.2      Glossary of Terms


LIST OF TABLES

Table 1.             APAC Metabolomics Services Market Revenue and Forecast to 2028 (US$ Million)

Table 2.             Japan: Metabolomics Services Market Revenue and Forecasts to 2028, By Service Type (US$ Mn)

Table 3.             Japan: Metabolomics Services Market Revenue and Forecasts to 2028, By Application (US$ Mn)

Table 4.             Japan: Metabolomics Services Market, by Pharmaceutical and Biotechnology Industry – Revenue and Forecast to 2028 (USD Million)

Table 5.             China: Metabolomics Services Market Revenue and Forecasts to 2028, By Service Type (US$ Mn)

Table 6.             China: Metabolomics Services Market Revenue and Forecasts to 2028, By Application (US$ Mn)

Table 7.             China: Metabolomics Services Market, by Pharmaceutical and Biotechnology Industry – Revenue and Forecast to 2028 (USD Million)

Table 8.             India: Metabolomics Services Market Revenue and Forecasts to 2028, By Service Type (US$ Mn)

Table 9.             India: Metabolomics Services Market Revenue and Forecasts to 2028, By Application (US$ Mn)

Table 10.          India: Metabolomics Services Market, by Pharmaceutical and Biotechnology Industry – Revenue and Forecast to 2028 (USD Million)

Table 11.          South Korea: Metabolomics Services Market Revenue and Forecasts to 2028, By Service Type (US$ Mn)

Table 12.          South Korea: Metabolomics Services Market Revenue and Forecasts to 2028, By Application (US$ Mn)

Table 13.          South Korea: Metabolomics Services Market, by Pharmaceutical and Biotechnology Industry – Revenue and Forecast to 2028 (USD Million)

Table 14.          Australia: Metabolomics Services Market Revenue and Forecasts to 2028, By Service Type (US$ Mn)

Table 15.          Australia: Metabolomics Services Market Revenue and Forecasts to 2028, By Application (US$ Mn)

Table 16.          Australia: Metabolomics Services Market, by Pharmaceutical and Biotechnology Industry – Revenue and Forecast to 2028 (USD Million)

Table 17.          Rest of Asia Pacific: Metabolomics Services Market Revenue and Forecasts to 2028, By Service Type (US$ Mn)

Table 18.          Rest of Asia Pacific: Metabolomics Services Market Revenue and Forecasts to 2028, By Application (US$ Mn)

Table 19.          Rest of Asia Pacific: Metabolomics Services Market, by Pharmaceutical and Biotechnology Industry – Revenue and Forecast to 2028 (USD Million)

Table 20.          Organic Developments Done By Companies

Table 21.          Inorganic Developments Done By Companies

Table 22.          Glossary of Terms, APAC Metabolomics Services Market


LIST OF FIGURES

Figure 1.           APAC Metabolomics Services Market Segmentation

Figure 2.           APAC Metabolomics Services Market, By Country

Figure 3.           APAC Metabolomics Services Market Overview

Figure 4.           Targeted Metabolomics Service Segment Held Largest Share of Type Segment in APAC Metabolomics Services Market

Figure 5.           India is Expected to Show Remarkable Growth During the Forecast Period

Figure 6.           APAC PEST Analysis

Figure 7.           Experts Opinion

Figure 8.           Impact Analysis of Drivers and Restraints Pertaining to APAC Metabolomics Services Market

Figure 9.           APAC Metabolomics Services Market– By Revenue Forecast and Analysis – 2019- 2028

Figure 10.        APAC Metabolomics Services Market, by Service Type 2021 & 2028 (%)

Figure 11.        APAC Targeted Metabolomics Service: Metabolomics Services Market Revenue and Forecasts to 2028 (US$ Mn)

Figure 12.        APAC Untargeted Metabolomics Service: Metabolomics Services Market Revenue and Forecasts to 2028 (US$ Mn)

Figure 13.        APAC Metabolomics Services Market Share by Application 2021 & 2028 (%)

Figure 14.        APAC Pharmaceutical and Biotechnology Industry: Metabolomics Services Market Revenue and Forecasts To 2028 (US$ Mn)

Figure 15.        APAC Biomarker Discovery: Metabolomics Services Market Revenue and Forecasts To 2028 (US$ Mn)

Figure 16.        APAC Toxicological Testing: Metabolomics Services Market Revenue and Forecasts To 2028 (US$ Mn)

Figure 17.        APAC Drug Discovery: Metabolomics Services Market Revenue and Forecasts To 2028 (US$ Mn)

Figure 18.        APAC Others : Metabolomics Services Market Revenue and Forecasts To 2028 (US$ Mn)

Figure 19.        APAC Agritech: Metabolomics Services Market Revenue and Forecasts To 2028 (US$ Mn)

Figure 20.        APAC Environment: Metabolomics Services Market Revenue and Forecasts To 2028 (US$ Mn)

Figure 21.        Asia Pacific Metabolomics Services Market Overview, by Country (2021)

Figure 22.        Asia Pacific: Metabolomics Services Market Revenue and Forecasts to 2028, By Country (%)

Figure 23.        Japan: Metabolomics Services Market Revenue and Forecasts to 2028 (US$ Mn)

Figure 24.        China: Metabolomics Services Market Revenue and Forecasts to 2028 (US$ Mn)

Figure 25.        India: Metabolomics Services Market Revenue and Forecasts to 2028 (US$ Mn)

Figure 26.        South Korea: Metabolomics Services Market Revenue and Forecasts to 2028 (US$ Mn)

Figure 27.        Australia: Metabolomics Services Market Revenue and Forecasts to 2028 (US$ Mn)

Figure 28.        Rest of Asia Pacific: Metabolomics Services Market – Revenue and Forecast to 2028 (USD Million)

Figure 29.        Impact of COVID-19 Pandemic in Asia Pacific Country Markets


  1. BASF SE
  2. BGI
  3. biocrates life sciences ag
  4. C-CAMP
  5. Chenomx Inc.
  6. Creative Proteomics
  7. Fred Hutchinson Cancer Research Center
  8. RTI International
  • Save and reduce time carrying out entry-level research by identifying the growth, size, leading players and segments in the APAC Metabolomics Services market.
  • Highlights key business priorities in order to assist companies to realign their business strategies
  • The key findings and recommendations highlight crucial progressive industry trends in the APAC Metabolomics Services market, thereby allowing players across the value chain to develop effective long-term strategies
  • Develop/modify business expansion plans by using substantial growth offering developed and emerging markets
  • Scrutinize in-depth APAC market trends and outlook coupled with the factors driving the Metabolomics Services market, as well as those hindering it
  • Enhance the decision-making process by understanding the strategies that underpin commercial interest with respect to client products, segmentation, pricing and distribution


Report Code
Full Name
Country Name
Email Id
Phone Number
Job Title
Company
Requirement

Note : Your data will never be shared with third parties, however, we may send you information from time to time about our products that may be of interest to you. By submitting your details, you agree to be contacted by us. You may contact us at any time to opt-out.


Purchase Options
Single User License
$3000
$1800
Site License
$4000
$2400
Enterprise License
$5000
$3000