Asia Pacific Geothermal Power Generation Market Forecast to 2031 - Regional Analysis - by Plant Type (Direct Dry Steam, Flash Steam, and Binary Cycle) and End User (Residential, Commercial, and Industrial)
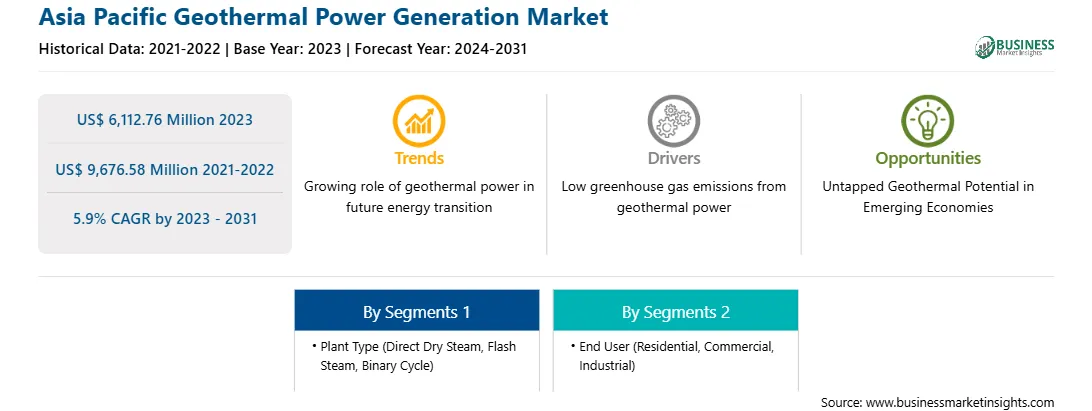
The Asia Pacific geothermal power generation market was valued at US$ 6,112.76 million in 2023 and is expected to reach US$ 9,676.58 million by 2031; it is estimated to register a CAGR of 5.9% from 2023 to 2031.
Untapped Geothermal Potential in Emerging Economies Fuels Asia Pacific Geothermal Power Generation Market
Heat flows from the Earth's interior that covers twice the global energy demand. To harness this heat, there is a requirement to drill deep underground and convert that heat into a usable form of energy. Another main advantage of geothermal energy is that it can provide baseload capacity, which is the minimum amount of electricity that must be available on the grid at any given time. While solar and wind output fluctuates seasonally and throughout the day, geothermal generation can be adjusted in the same way that a fossil fuel power plant can increase or decrease output. In addition, the government initiatives toward exploring the untapped geothermal potential globally. For instance, to help countries unlock the untapped potential of geothermal energy and promote its widespread use, the International Renewable Energy Agency (IRENA) established the Global Geothermal Alliance (GGA) in 2015 as a platform to improve dialogue, collaboration, and coordinated action to increase the share of geothermal power installed as well as heat generation worldwide. Moreover, Indonesia, Turkey, and Kenya are key economies expected to lead in geothermal electricity generation by the end of 2030. Thus, exploring the untapped geothermal potential in emerging economies is expected to create several opportunities for the geothermal power generation market growth during the forecast period.
Asia Pacific Geothermal Power Generation Market Overview
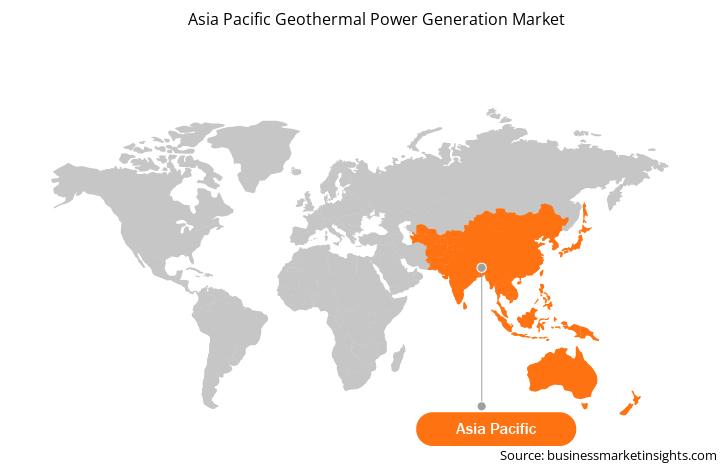
The Asia Pacific geothermal power generation market is segmented into Japan, Indonesia, New Zealand, the Philippines, and the Rest of Asia Pacific. In 2023, Asia Pacific held the largest geothermal power generation market share of ~39.6% in the geothermal power generation market worldwide and is expected to record a CAGR of 5.9% from 2023 to 2031. This is owing to the presence of geothermal power-generating countries, including Indonesia, the Philippines, New Zealand, and Japan. The demand for power in Asia Pacific continues to increase owing to rapid industrialization across the region, which has further led to increased generation of sustainable electricity. Moreover, increasing government initiatives and funding toward the construction of geothermal power plants in the region is projected to fuel the geothermal power generation market growth in the coming years.
Asia Pacific Geothermal Power Generation Market Revenue and Forecast to 2031 (US$ Million)
Asia Pacific Geothermal Power Generation Market Segmentation
The Asia Pacific geothermal power generation market is categorized into plant type, end user, and country.
Based on plant type, the Asia Pacific geothermal power generation market is segmented into direct dry steam, flash steam, and binary cycle. The flash steam segment held the largest market share in 2023.
In terms of end user, the Asia Pacific geothermal power generation market is categorized into residential, commercial, and industrial. The industrial segment held the largest market share in 2023.
By country, the Asia Pacific geothermal power generation market is segmented into Japan, Indonesia, Philippines, New Zealand, and the Rest of Asia Pacific. Indonesia dominated the Asia Pacific geothermal power generation market share in 2023.
Turboden SpA, Toshiba Energy Systems and Solutions Corp, Berkshire Hathaway Inc, NIBE Industrier AB, General Electric Co, Fuji Electric Co Ltd, Carrier Global Corp, and Danfoss AS. are some of the leading companies operating in the Asia Pacific geothermal power generation market.
TABLE OF CONTENTS
1. Introduction
1.1 The Insight Partners Research Report Guidance
1.2 Market Segmentation
2. Executive Summary
2.1 Key Insights
2.2 Market Attractiveness
3. Research Methodology
3.1 Secondary Research
3.2 Primary Research
3.2.1 Hypothesis formulation:
3.2.2 Macro-economic factor analysis:
3.2.3 Developing base number:
3.2.4 Data Triangulation:
3.2.5 Country level data:
4. Asia Pacific Geothermal Power Generation Market Landscape
4.1 Overview
4.2 Ecosystem Analysis
4.2.1 Equipment or Component Suppliers
4.2.2 Geothermal Power Plant Operators/Product Manufacturers
4.2.3 End User
5. Asia Pacific Geothermal Power Generation Market - Key Market Dynamics
5.1 Market Drivers
5.1.1 Rise in Demand and Utilization of Geothermal Energy
5.1.2 Surge in Investment and Government Support toward Geothermal Power Generation
5.2 Market Restraints
5.2.1 High Investment Cost
5.3 Market Opportunities
5.3.1 Untapped Geothermal Potential in Emerging Economies
5.4 Future Trends
5.4.1 Growing Role of Geothermal Power in Future Energy Transition
5.5 Impact of Drivers and Restraints:
6. Geothermal Power Generation Market - Asia Pacific Analysis
6.1 Asia Pacific Geothermal Power Generation Market Overview
6.2 Geothermal Power Generation Market Revenue, 2021-2031 (US$ Million)
6.3 Geothermal Power Generation Market Forecast Analysis
7. Asia Pacific Geothermal Power Generation Market Analysis - by Plant Type
7.1 Direct Dry Steam
7.1.1 Overview
7.1.2 Direct Dry Steam: Geothermal Power Generation Market - Revenue and Forecast to 2031 (US$ Million)
7.2 Flash Steam
7.2.1 Overview
7.2.2 Flash Steam: Geothermal Power Generation Market - Revenue and Forecast to 2031 (US$ Million)
7.3 Binary Cycle
7.3.1 Overview
7.3.2 Binary Cycle: Geothermal Power Generation Market - Revenue and Forecast to 2031 (US$ Million)
8. Asia Pacific Geothermal Power Generation Market Analysis - by End User
8.1 Residential
8.1.1 Overview
8.1.2 Residential: Geothermal Power Generation Market - Revenue and Forecast to 2031 (US$ Million)
8.2 Commercial
8.2.1 Overview
8.2.2 Commercial: Geothermal Power Generation Market - Revenue and Forecast to 2031 (US$ Million)
8.3 Industrial
8.3.1 Overview
8.3.2 Industrial: Geothermal Power Generation Market - Revenue and Forecast to 2031 (US$ Million)
9. Asia Pacific Geothermal Power Generation Market - Country Analysis
9.1 Asia Pacific
9.1.1 Asia Pacific: Geothermal Power Generation Market Breakdown, by Key Countries, 2023 and 2031 (%)
9.1.1.1 Asia Pacific: Geothermal Power Generation Market - Revenue and Forecast Analysis - by Country
9.1.1.2 Japan: Geothermal Power Generation Market - Revenue and Forecast to 2031 (US$ Million)
9.1.1.2.1 Japan: Geothermal Power Generation Market Breakdown, by Plant Type
9.1.1.2.2 Japan: Geothermal Power Generation Market Breakdown, by End User
9.1.1.3 Indonesia: Geothermal Power Generation Market - Revenue and Forecast to 2031 (US$ Million)
9.1.1.3.1 Indonesia: Geothermal Power Generation Market Breakdown, by Plant Type
9.1.1.3.2 Indonesia: Geothermal Power Generation Market Breakdown, by End User
9.1.1.4 New Zealand: Geothermal Power Generation Market - Revenue and Forecast to 2031 (US$ Million)
9.1.1.4.1 New Zealand: Geothermal Power Generation Market Breakdown, by Plant Type
9.1.1.4.2 New Zealand: Geothermal Power Generation Market Breakdown, by End User
9.1.1.5 Philippines: Geothermal Power Generation Market - Revenue and Forecast to 2031 (US$ Million)
9.1.1.5.1 Philippines: Geothermal Power Generation Market Breakdown, by Plant Type
9.1.1.5.2 Philippines: Geothermal Power Generation Market Breakdown, by End User
9.1.1.6 Rest of Asia Pacific: Geothermal Power Generation Market - Revenue and Forecast to 2031 (US$ Million)
9.1.1.6.1 Rest of Asia Pacific: Geothermal Power Generation Market Breakdown, by Plant Type
9.1.1.6.2 Rest of Asia Pacific: Geothermal Power Generation Market Breakdown, by End User
10. Competitive Landscape
10.1 Heat Map Analysis by Key Players
10.2 Company Positioning and Concentrations
11. Industry Landscape
11.1 Overview
11.2 Market Initiative
11.3 Merger and Acquisition
12. Company Profiles
12.1 Turboden SpA
12.1.1 Key Facts
12.1.2 Business Description
12.1.3 Products and Services
12.1.4 Financial Overview
12.1.5 SWOT Analysis
12.1.6 Key Developments
12.2 Toshiba Energy Systems & Solutions Corp
12.2.1 Key Facts
12.2.2 Business Description
12.2.3 Products and Services
12.2.4 Financial Overview
12.2.5 SWOT Analysis
12.2.6 Key Developments
12.3 Berkshire Hathaway Inc
12.3.1 Key Facts
12.3.2 Business Description
12.3.3 Products and Services
12.3.4 Financial Overview
12.3.5 SWOT Analysis
12.3.6 Key Developments
12.4 NIBE Industrier AB
12.4.1 Key Facts
12.4.2 Business Description
12.4.3 Products and Services
12.4.4 Financial Overview
12.4.5 SWOT Analysis
12.4.6 Key Developments
12.5 General Electric Co
12.5.1 Key Facts
12.5.2 Business Description
12.5.3 Products and Services
12.5.4 Financial Overview
12.5.5 SWOT Analysis
12.5.6 Key Developments
12.6 Fuji Electric Co Ltd
12.6.1 Key Facts
12.6.2 Business Description
12.6.3 Products and Services
12.6.4 Financial Overview
12.6.5 SWOT Analysis
12.6.6 Key Developments
12.7 Carrier Global Corp
12.7.1 Key Facts
12.7.2 Business Description
12.7.3 Products and Services
12.7.4 Financial Overview
12.7.5 SWOT Analysis
12.7.6 Key Developments
12.8 Danfoss AS
12.8.1 Key Facts
12.8.2 Business Description
12.8.3 Products and Services
12.8.4 Financial Overview
12.8.5 SWOT Analysis
12.8.6 Key Developments
13. Appendix
13.1 About The Insight Partners
List of Tables
Table 1. Asia Pacific Geothermal Power Generation Market Segmentation
Table 2. Geothermal Power Generation Market - Revenue and Forecast to 2031 (US$ Million)
Table 3. Geothermal Power Generation Market - Revenue and Forecast to 2031 (US$ Million) - by Plant Type
Table 4. Geothermal Power Generation Market - Revenue and Forecast to 2031 (US$ Million) - by End User
Table 5. Asia Pacific: Geothermal Power Generation Market - Revenue and Forecast to 2031 (US$ Million) - by Country
Table 6. Japan: Geothermal Power Generation Market - Revenue and Forecast to 2031 (US$ Million) - by Plant Type
Table 7. Japan: Geothermal Power Generation Market - Revenue and Forecast to 2031 (US$ Million) - by End User
Table 8. Indonesia: Geothermal Power Generation Market - Revenue and Forecast to 2031 (US$ Million) - by Plant Type
Table 9. Indonesia: Geothermal Power Generation Market - Revenue and Forecast to 2031 (US$ Million) - by End User
Table 10. New Zealand: Geothermal Power Generation Market - Revenue and Forecast to 2031 (US$ Million) - by Plant Type
Table 11. New Zealand: Geothermal Power Generation Market - Revenue and Forecast to 2031 (US$ Million) - by End User
Table 12. Philippines: Geothermal Power Generation Market - Revenue and Forecast to 2031 (US$ Million) - by Plant Type
Table 13. Philippines: Geothermal Power Generation Market - Revenue and Forecast to 2031 (US$ Million) - by End User
Table 14. Rest of Asia Pacific: Geothermal Power Generation Market - Revenue and Forecast to 2031 (US$ Million) - by Plant Type
Table 15. Rest of Asia Pacific: Geothermal Power Generation Market - Revenue and Forecast to 2031 (US$ Million) - by End User
List of Figures
Figure 1. Asia Pacific Geothermal Power Generation Market Segmentation, by Country
Figure 2. Ecosystem Analysis
Figure 3. Asia Pacific Geothermal Power Generation Market - Key Market Dynamics
Figure 4. Impact Analysis of Drivers and Restraints
Figure 5. Geothermal Power Generation Market Revenue, 2021-2031 (US$ Million)
Figure 6. Geothermal Power Generation Market Share (%) - by Plant Type (2023 and 2031)
Figure 7. Direct Dry Steam: Geothermal Power Generation Market - Revenue and Forecast to 2031 (US$ Million)
Figure 8. Flash Steam: Geothermal Power Generation Market - Revenue and Forecast to 2031 (US$ Million)
Figure 9. Binary Cycle: Geothermal Power Generation Market - Revenue and Forecast to 2031 (US$ Million)
Figure 10. Geothermal Power Generation Market Share (%) - by End User (2023 and 2031)
Figure 11. Residential: Geothermal Power Generation Market - Revenue and Forecast to 2031 (US$ Million)
Figure 12. Commercial: Geothermal Power Generation Market - Revenue and Forecast to 2031 (US$ Million)
Figure 13. Industrial: Geothermal Power Generation Market - Revenue and Forecast to 2031 (US$ Million)
Figure 14. Asia Pacific Geothermal Power Generation Market, by Key Countries- Revenue, (2023) (US$ Million)
Figure 15. Asia Pacific: Geothermal Power Generation Market Breakdown, by Key Countries, 2023 and 2031 (%)
Figure 16. Japan: Geothermal Power Generation Market - Revenue and Forecast to 2031 (US$ Million)
Figure 17. Indonesia: Geothermal Power Generation Market - Revenue and Forecast to 2031 (US$ Million)
Figure 18. New Zealand: Geothermal Power Generation Market - Revenue and Forecast to 2031 (US$ Million)
Figure 19. Philippines: Geothermal Power Generation Market - Revenue and Forecast to 2031 (US$ Million)
Figure 20. Rest of Asia Pacific: Geothermal Power Generation Market - Revenue and Forecast to 2031 (US$ Million)
Figure 21. Heat Map Analysis by Key Players
Figure 22. Company Positioning and Concentration
- Turboden SpA
- Toshiba Energy Systems and Solutions Corp
- Berkshire Hathaway Inc
- NIBE Industrier AB
- General Electric Co
- Fuji Electric Co Ltd
- Carrier Global Corp
- Danfoss AS
- Save and reduce time carrying out entry-level research by identifying the growth, size, leading players, and segments in the Asia Pacific geothermal power generation market.
- Highlights key business priorities to assist companies to realign their business strategies.
- The key findings and recommendations highlight crucial progressive industry trends in the Asia Pacific geothermal power generation market, thereby allowing players across the value chain to develop effective long-term strategies.
- Develop/modify business expansion plans by using substantial growth offering developed and emerging markets.
- Scrutinize in-depth Asia Pacific market trends and outlook coupled with the factors driving the Asia Pacific geothermal power generation market, as well as those hindering it.
- Enhance the decision-making process by understanding the strategies that underpin commercial interest with respect to client products, segmentation, pricing, and distribution.