Asia Pacific EV Charging Cables Market
Market Introduction
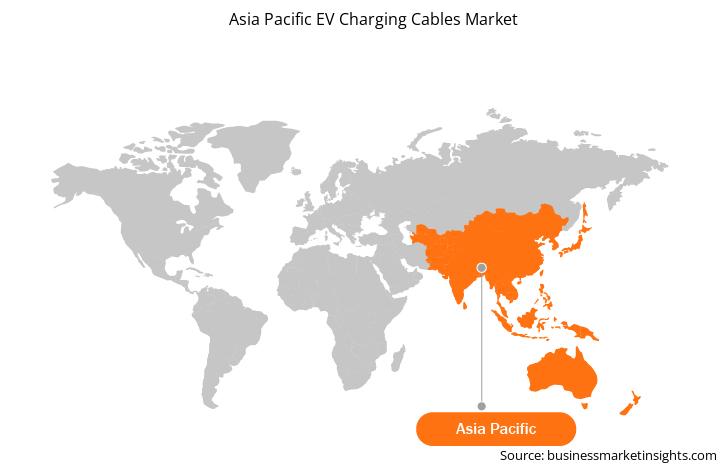
Asia Pacific has surfaced as the leading and fastest-growing region in the global automobile manufacturing space due to extensive manufacturing facilities in China, India, and Japan; a massive consumer base; and the presence of key market players. China is the largest market for electric vehicles in Asia Pacific, with the high dominance of charging stations. The EV charging cables market in the region is mainly driven by the increasing production of electric vehicles and the upgradation of technologies. Innovations by vehicle manufacturing companies and investments by government agencies have boosted the auto production in Asia Pacific, propelling the demand for electric vehicles. Development of megachargers to facilitate long-distance trucking is the major factor driving the growth of the APAC EV charging cable market.
Except few developed countries like Japan and Singapore, Asia Pacific region is still considered to be in developing state. The developing countries do not have required health infrastructure and this was the main reason that led to the increase in the count of recorded cases in 2020. As per the Organization for Economic Co-operation and Development (OECD), the pandemic has affected significant economies such as India, Australia and Japan to some extent. Due to inadequate health and medicine facilities, government authorities had to impose restrictions of limited workforce at production sites. In China, where the electric vehicle share was higher than in Europe throughout 2019, sales have slightly decreased to around 4.2% during the first half of 2020. An underlying reason might be the reduction in purchase premiums for electric vehicles in China. As in China COVID-19 have negatively impacted on the green energy sector, including renewable energy sources, battery energy storage, electric vehicles (EVs), and renewable heating and cooling. Moreover, falling costumer demands due to low labour movement will affect the market growth. Even Tesla’s Gigafactory in Shanghai has hinted of possible supply shortages for the US, UK and Australia. And this supply constraint also has an negative impact on the global EV Charging cable markets along with energy storage projects, causing project delays or rises in cost.
Strategic insights for the Asia Pacific EV Charging Cables provides data-driven analysis of the industry landscape, including current trends, key players, and regional nuances. These insights offer actionable recommendations, enabling readers to differentiate themselves from competitors by identifying untapped segments or developing unique value propositions. Leveraging data analytics, these insights help industry players anticipate the market shifts, whether investors, manufacturers, or other stakeholders. A future-oriented perspective is essential, helping stakeholders anticipate market shifts and position themselves for long-term success in this dynamic region. Ultimately, effective strategic insights empower readers to make informed decisions that drive profitability and achieve their business objectives within the market. The geographic scope of the Asia Pacific EV Charging Cables refers to the specific areas in which a business operates and competes. Understanding local distinctions, such as diverse consumer preferences (e.g., demand for specific plug types or battery backup durations), varying economic conditions, and regulatory environments, is crucial for tailoring strategies to specific markets. Businesses can expand their reach by identifying underserved areas or adapting their offerings to meet local demands. A clear market focus allows for more effective resource allocation, targeted marketing campaigns, and better positioning against local competitors, ultimately driving growth in those targeted areas.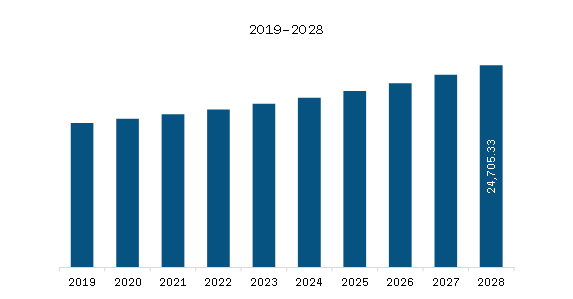 Get more information on this report
 Asia Pacific EV Charging Cables Strategic Insights
 Get more information on this report
 Asia Pacific EV Charging Cables Report Scope
Report Attribute
Details
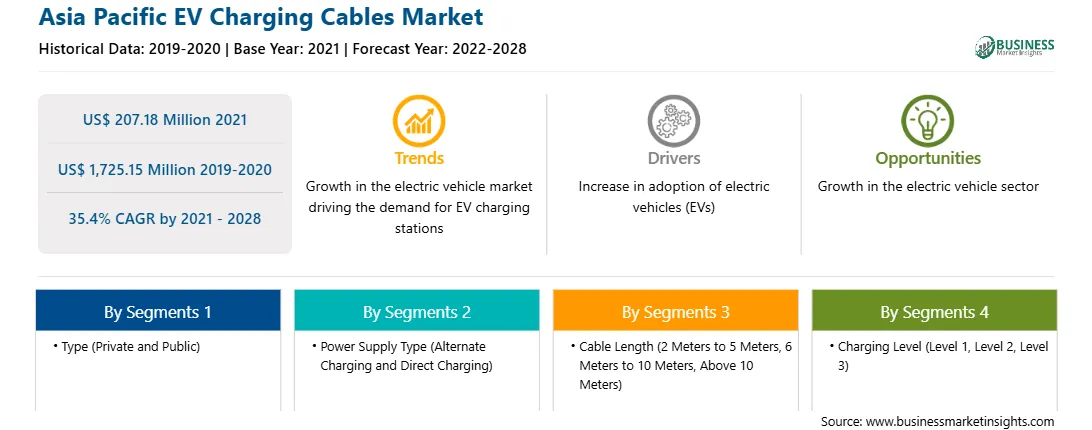
Market size in 2021
US$ 207.18 Million
Market Size by 2028
US$ 1,725.15 Million
Global CAGR (2021 - 2028)
35.4%
Historical Data
2019-2020
Forecast period
2022-2028
Segments Covered
By Type
By Power Supply Type
By Cable Length
By Charging Level
By Jacket Material
Regions and Countries Covered
Asia-Pacific
Market leaders and key company profiles
Get more information on this report Asia Pacific EV Charging Cables Regional Insights
 Get more information on this report
Market Overview and Dynamics
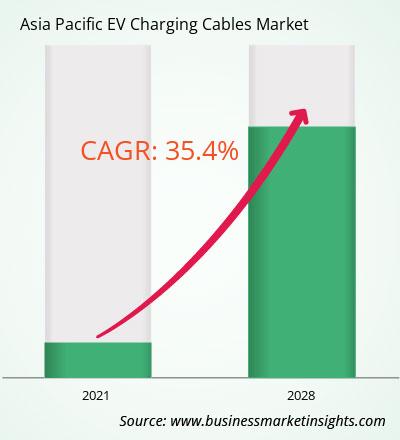
The EV charging cables market in APAC is expected to grow from US$ 207.18 million in 2021 to US$ 1,725.15 million by 2028; it is estimated to grow at a CAGR of 35.4% from 2021 to 2028. Automobile sales are reaching new heights due to the growing popularity of trucks and SUVs and the rising demand for compact sedans. Toyota, Hyundai, Nissan, Subaru, and Kia reported sales increases in the double digits. In 2020, 78 million vehicles were produced .With such huge vehicle manufacturing volumes, the scope of electric vehicle (EV) manufacturing is also gaining momentum. Also, few OEMs aim to reconfigure their product lines to manufacture only electric vehicles. In the first trimester of 2021, Volvo declared selling of only electric cars from 2030. Many countries in the world have set objectives emphasizing reducing car emissions. As a part of this, they have begun to promote the production and marketing of electric vehicles and related charging infrastructure. Thus, the surge in automotive production, with the growing focus on electric vehicles, is bolstering the EV charging cables market growth.
Key Market Segments
The APAC EV charging cables market has been segmented based on type, power supply type, cable length, charging level, jacket material, and country. Based on type, the APAC EV charging cables market is segmented into private charging and public charging. The private segment dominated the market in 2020 and public segment is expected to be the fastest growing during the forecast period. Based on power supply type, the market is segmented into alternate charging and direct charging. The alternate charging segment dominated the market in 2020 and direct charging segment is expected to be the fastest growing during the forecast period. Based on cable length, the market is segmented into 2 metres to 5 metres, 6 metres to 10 metres, and above 10 metres. The 2 metres to 5 metres segment dominated the market in 2020 and 6 metres to 10 metres is expected to be the fastest growing during the forecast period. Based on charging level, the EV charging cables market is segmented into level 1, level 2, and level 3. The level 2 dominated the market in 2020 and level 3 segment is expected to be the fastest growing during the forecast period. In terms of jacket material, the EV charging cables market is segmented into all-rubber jacket, thermoplastic elastomer jacket, polyvinyl chloride jacket. All rubber segment dominated the market in 2020 and segment is expected to be the fastest growing during the forecast period.
Major Sources and Companies Listed
A few major primary and secondary sources referred to for preparing this report on EV charging cables market in APAC are company websites, annual reports, financial reports, national government documents, and statistical database, among others. Major companies listed in the report are Aptiv PLC; BESEN INTERNATIONAL GROUP; Coroplast Group; DYDEN CORPORATION; EV TEISON; General Cable Technologies Corporation; Phoenix Contact E-Mobility; SINBON Electronics Co., Ltd.; and TE Connectivity Corporation are among others.
Reasons to buy report
APAC EV Charging Cables Market Segmentation
APAC EV Charging Cables Market –By
Type
APAC EV Charging Cables Market –By Power Supply Type
APAC EV Charging Cables Market –By Cable Length
APAC EV Charging Cables Market –By Charging Level
APAC EV Charging Cables Market –By Jacket Material
APAC EV Charging Cables Market -By Country
APAC EV Charging Cables Market -
Company Profiles
The Asia Pacific EV Charging Cables Market is valued at US$ 207.18 Million in 2021, it is projected to reach US$ 1,725.15 Million by 2028.
As per our report Asia Pacific EV Charging Cables Market, the market size is valued at US$ 207.18 Million in 2021, projecting it to reach US$ 1,725.15 Million by 2028. This translates to a CAGR of approximately 35.4% during the forecast period.
The Asia Pacific EV Charging Cables Market report typically cover these key segments-
The historic period, base year, and forecast period can vary slightly depending on the specific market research report. However, for the Asia Pacific EV Charging Cables Market report:
The Asia Pacific EV Charging Cables Market is populated by several key players, each contributing to its growth and innovation. Some of the major players include:
The Asia Pacific EV Charging Cables Market report is valuable for diverse stakeholders, including:
Essentially, anyone involved in or considering involvement in the Asia Pacific EV Charging Cables Market value chain can benefit from the information contained in a comprehensive market report.
Office No. 1011, First floor, Farena Corporate Park, Magarpatta-Mundhwa road, Pune - 411028, Maharashtra, India
US:+16467917070
sales@businessmarketinsights.com


 Get Free Sample For Asia Pacific EV Charging Cables Market
